Munich Personal RePEc Archive
The Impact of Counter-terrorism
Effectiveness on Economic Growth of
Pakistan: An Econometric Analysis
Mubashra, Sana and Shafi, Mariuam i
Lahore College for Women University, Lahore , Pakistan
2018
Online at
https://mpra.ub.uni-muenchen.de/84847/
1
The Impact of Counter-terrorism Effectiveness on Economic Growth of
Pakistan: An Econometric Analysis
1By
Sana Mubashra2 and Mariuam Shafi3
Abstract
The purpose of present study is to explore theoretically and empirically the impact of counterterrorism effectiveness on economic growth of Pakistan. The data for counter-terrorism components construct from GTD and data for growth variables gathered from WDI for the time 1980 to 2015. This study developed “negative binomial regression model” for investigating the magnitude and significance of counter-terrorism effectiveness. It also uses the ARDL bound test and causality analysis for examining the causal relationship between economic growth and counter-terrorism effectiveness. This study further identifies that there are three types of proactive strategies used by Government and military authorities to reduce violence: civilian policies, peace accords and military operations. The result shows that there are long term impacts of counter-terrorism policies on economic growth. The findings also imply that counter-terrorism
strategies may not be able to restrict violence and incapacitate militant‟s organization and their
sleeper cell if it lacks strong political support. The present work is raw evidence for the effort level of authorities and their preemptive strategies that leads to the significant breakdown effect to curb terrorism across the country.
Keywords: Counterterrorism: Causality: Military operations: Negative binomial
JEL Classification: K42, O10, Z10
1. INTRODUCTION
Pakistan has accommodated millions of refugees entering in country and supported the war in Afghanistan against Taliban. The militant insurgency has fallen over to FATA (Federally Administrated Tribal Areas), contiguous to Afghanistan and regularly threating the adjoining areas of KPK (Khyber Pakhtoun Khawan) and being a cause of irregular acts of violence in the rest of Pakistan. From the last three decades, the involvement in the war against terrorism, Pakistan facing a drastic conflict among different factions that spontaneously fluctuate its economic growth.
1
The paper is written from the MPhil thesis completed at the Department of Economics, LCWU, Lahore.
2
Sana Mubashra, MPhil Student at LCWU 3
2
Due to asymmetric violence and domestic conflicts, Pakistan has been graded second most affected country amongst countries (Global Terrorism Index, 2012). Over the past decades, Pakistan have used up huge amount of expenditures in implementing and designing the great number of policies to counter terrorism. There was 25% reduction in victims and 7% reduction in terrorist incidence in Pakistan from 2013 to 2014 (Global Terrorism Index, 2015). In 2016, there was 27% reduction in terrorist incidence and 12% reduction count in deaths (U.S Country Report on Terrorism, 2016). Evidently, the assessment of proactive counter-terrorism measures and policies needs more exploration to investigate whether the granted amount of resources on counter-terrorism are beneficial. Additionally, the capacity of antiterrorism spending has raise considerably overtime, exclusively after 9/11. The public cost of counter-terrorism and terrorism policies yields more than fifty thousand (50,000) victims, containing 15,700 military personnel
and 118.32$ billions of monetary costs from Pakistan‟s economy since 9/11 (Pakistan Economic
Survey, 2016).
The broader objective of this study is to test empirically the significance and magnitude of counter-terrorism effectiveness over time in reducing terrorism. Then, it also examines the policies and efforts made by the Government of Pakistan and Military authorities towards counter-terrorism. In addition, it investigates the impact of counter-terrorism effectiveness on economic growth and explains whether counter-terrorism effectiveness has an impact on economic growth or not. This study develops the magnitude and significance of
[image:3.612.143.516.439.615.2]counter-terrorism effectiveness by using “Negative Binomial Regression Model”. On the flip side, it‟s also investigated “ARDL model” and “Granger Causality” test for empirically check out the relationship between economic growth and counter-terrorism effectiveness.
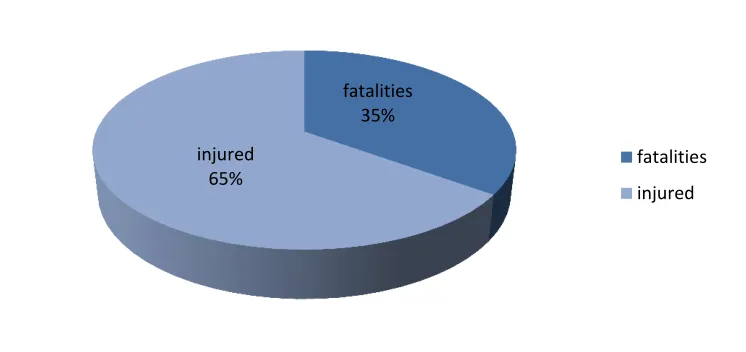
Figure 1.1: Percentage of Victims of Terrorism in Pakistan
Source: Global Terrorism Database (1980-2015)
In addition, this study adds short run and long run relationship between counter-terrorism effectiveness and economic growth. The counter-terrorism has an impact on number of victims whether the numbers of victims increase or decrease. In econometric model, the present study
fatalities 35%
injured 65%
fatalities
3
also accounted to explain three types of counter-terrorism effects, deterrence effect which is explains through military expenditures, GDP (per capita) and regime type. Accordingly, retaliation effect shows with total number of terrorist attacks which also explains the efforts level of militants. It is expected that both deterrence and retaliation effect tends to decrease number of terrorist attacks across the country. To this end, this study has developed the information delivered by the GTD4 (Global Terrorism Database), which categories the terrorism incidents in various classifications. GTD provided detail of 11928 terrorist incidents from 1980 to 2015. Nevertheless, economic growth is proxies by main variable GDP (per capita).
1.1Counter-terrorism Policies and Strategies of Pakistan
Government of Pakistan has established several proactive5 and defensive anti-terrorism measures to discourage and de-radicalized terrorist organizations. Pakistan had commenced just two operations of counterinsurgency against separatist of Karachi in 1992 and tribal militants of Baluchistan in 1974 before 9/11. The coinciding increased in terrorist attacks and operations of counterinsurgency around the country of dispute management policies appropriated by Government and military authorities to reduce violence after 9/11. According to the relevant literature on counterinsurgency and crime, there are three endorsements related to policies of the counter-terrorism effectiveness in empirical and theoretical analysis, respectively mentioned below in details (Landes, 1978; Rosendorff and Sandler 2010; Rehman et al., 2017).
I. Deterrence Effect
The first endorsement analyses the deterrence effect of counter-terrorism measures, which is link with cost of affecting a terrorist attack. The major deterrence effects against violence measured by the military expenditures and number of policies (Barros, 2003). Likewise, anti-terrorist acts can deter violence by striking severe punishment on imprisoned anti-terrorist. Therefore, measures that support to upturn the likelihood of apprehension and principle can lower the terrorist activities (Landes, 1978).
Anti-Terrorism Acts (1952-2012)
The government authorities of Pakistan proposed number of security and anti-terrorism acts since 1952. Those acts particularly reinforce provisions making the offence of violence financing, casing all the features of the offence in the light of worldwide ethics and offers for more effective actions for law-enforcement organizations to explore the offences. The approved
acts and bills by the government are “Security of Pakistan Act 1952”, “Prevention of Anti
-National Activities 1974”, “Prohibition of Private Armies Act 1974”, “Anti-Terrorism Act
1997”, “Pakistan Nuclear Regulatory Authority Ordinance 2001”, “National Command
4
The Global Terrorism Database (GTD) is an open-source database including information on terrorist events around the world from 1970 through 2016.
5
4
Authority Act 2010” and “Anti-terrorism (Amendment) Bill 2012”. These approved laws have endorsed possibly overtime, as the first parliamentary deterrence.
Peace Accords (2005-2009)
Pakistan has deterred the militants of South and North Waziristan agencies and Malakand division by signing peace agreements. The included signed accords are; Shakai agreement
(2004) in Gen. Musharraf era with Commander of Taliban Nek Muhammad in South Waziristan, Sararogha Peace Deal (2005) signed with Baitullah Mehsud pro-Taliban militant in South Waziristan agency after the death of Nek Muhammad, Miranshah Peace Accord (2006) with the militant of North Waziristan, Mohid-e-Sarorah agreement signed with Abdullah Mehsud, Swat agreement (2009) with Mullah Fazullah vice Commander of TTP. Nevertheless, all these peace accords have all proven useless.
II. Retaliation Effect
Retaliation effects measures the second proposition which explains that some anti-terrorist activities and military operation against militants may upturn the number of terrorist attacks in future, number of victims, property losses and repression. Actions that raise the cost of anti-terrorist activities can motivate violence and outcome in what is termed backlash or retaliation effect (Siqueira and Sandler, 2007; Schelling, 1980; Rosendorff and Sandler, 2010). According to Dutter and Seliktar (2007), an increase in the number of casualities is an evidence that terrorist organizations are failed to attack on hard target, so they chosed to attack on soft targets that may easier to find.
III. Breakdown Effect
[image:5.612.161.478.501.638.2]By directing the resources legacies of militants and incapacitate them to inauguration future attacks. For instance, government can use proactive strategies by deploying military to terminate
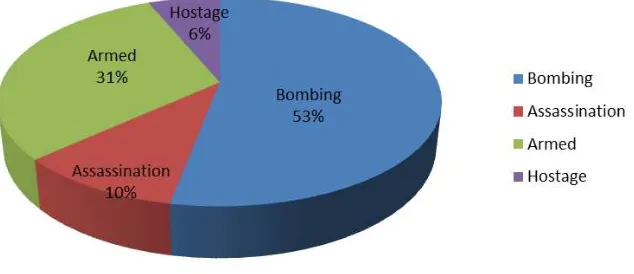
Figure 1.2: Total Percentage of Attack types of Terrorist Incidence in Pakistan
5
Terrorist network across the country and reduce the resources legacies of the rebel groups. Any preemptive strategy that reduces terrorist activities and attacks by decreasing their resources is incapacitation or Breakdown effect (Rehman et al., 2017). Further, the breakdown effect has measured by counter-insurgent and domestic operations by military authorities. The gathered information on carrot-and-stick counter-terrorism strategies and operations across the country by military stated below.
National Internal Security Policy (NISP 2014-2018)
The first-ever “National Internal Security Policy6 (NISP)” has been exposed by the Government of Pakistan after 67 years of Independence. The three main objectives of NISP includes, negotiation with all shareholders, separation of terrorist from their funding system and deterrence augmentation by capacity structure of the security gear to deactivate threats of inside security of Pakistan. For implementing the aims of NISP, all the security and law enforcement agencies works together under Counter-Terrorism Departments (CTDs).
National Action Plan (NAP)
Political and military authorities of Pakistan have learned from previous counterinsurgency strategies that undertaking the control of one region does not reduce the terrorist attacks and provide deterrence. In response of counterinsurgency operations, the well-established militants move their networks from one place to another. Therefore, the new inclusive counterinsurgency
strategy implemented by Government in January 2015 was “National Action Plan”. The plan was
hallmark of on ongoing operation Zarb-e-Azb in NWA (North Waziristan Agency). It was addressed as a main coordinated state revenge following the backlash attack of militants on army public school Peshawar in December 2014. Both NAP and Operation Zarb-e-Azb are the solid evidence of counter-terrorism effectiveness in reducing terrorist attacks on significant level (Rehman et al., 2017).
Military Operations (2001-2016)
The Pakistan Military Forces has been engaged in confirming internal stability and security through tackling militancy and insurgency in FATA (Federally Administered Tribal Areas), the PATA (Provincially Administered Tribal Areas) and across the country since 2001 (Khan, Z.A., 2012). In order to look challenges, Pakistan army has decided to bring variations in its motivation, orientation, strategies and thinking from the last sixteen years. In this regard, military has conducted seven major operations along with various smaller operations against the terrorists and insurgents. Finally, the study analyzes briefly the military operations launched by Pakistan Army.
6
6
Operation Enduring Freedom (2001-2002)
To some extent, it was a successful operation in its purposes of overthrowing the Terrorists regime and arrested some followers of Al-Qaeda in Afghanistan (Khan, Z.A., 2012). However, both Pakistan and United States forces futile to arrest main leaders of Al-Qaeda.
0 400 800 1,200 1,600 2,000
[image:7.612.115.496.145.374.2]1980 1985 1990 1995 2000 2005 2010 2015
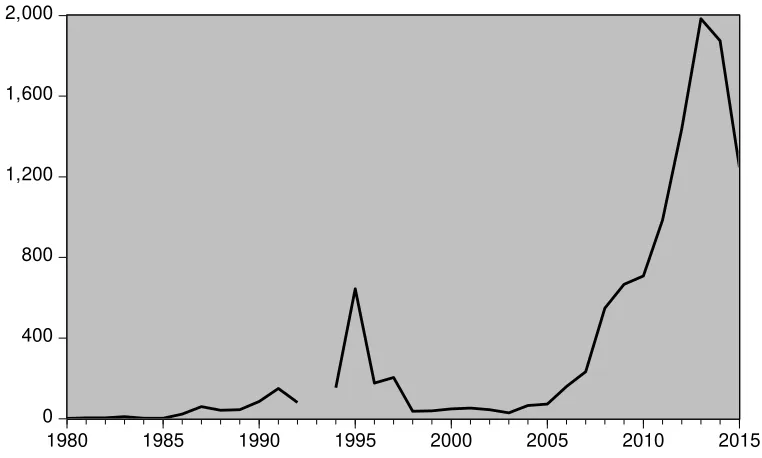
Figure 1.3: Total Number of Terrorist Incidents in Pakistan
Source: Global Terrorism Database (1980-2015)
Operation Al-Mizaan (2002-2006)
This Operation was conducted against the foreign militants in FATA under the compression of Washington (Khan, Z.A., 2012). It was contained various smaller operations, like Operation Kalosha-II in Waziristan. For this operation, government deploys frontier forces in between 70,000 to 80,000 in FATA (PIPS, 2016).
Operation Zalzala (2008)
The Sararogha fort was captured by the men of Baitullah Mehsud in South Waziristan agency and killed security personnel of Pakistan army (Khan, Z.A., 2012). The Pakistan Military forces launched three main operations against TTP (Baitullah Mehsud) after the failure of Sararogha Peace deal. Operation Zalzala (Earthquake) was the main component and security forces cleared most area of South Waziristan and interrupted some strategic suicide attacks. It was successful operation of Pakistan army (Khan, Z.A., 2012).
Operation Rah-e-Haq (2007-2009)
At the request of provisional government Operation Rah-e-Haq was conducted with the prime
7
Operation Sherdil (2008-2009)
Pakistan army began operations in different places of country after the partial success in southern areas of FATA against militants (Khan, Z.A., 2012). The major target of Operation Sherdil was
to capture the militant‟s organizations, it‟s known as “Battle-of- Bajour” (2008-2009). Over 1000 terrorists and 63 security personnel had been killed in this fight (PIPS7, 2016).
Operation Rah-e- Raast (2009)
Operation Rah-e-Raast launched in Mingora Swat and had aimed to clear most areas of swat and arrest or kill main leaders of TTP and other militants. The military successfully completed this operation and destroyed hidden explosives, ammunition, confiscated arms and concrete bunkers and regained hold on entire Mingora (Khan, Z.A., 2012; Rehman et al., 2017).
Operation Rah-e- Nijaat (2009)
In the center of increasing violence, ground operation was initiated by the Pakistani air force and military in South Waziristan, known as Operation Rah-e-Nijaat (Path of Salvation) in 2009 (Khan, Z.A., 2012; Rehman et al., 2017). Pakistani armed forces conducted “search
-and-clearance” operations beside numerous key roads and places in South Waziristan. They
successfully disrupted the TTP control and command system in the major Mehsud areas in South Waziristan. Hence, the preliminary targets of these operations were to abolish the TTP stranglehold in northern and southern areas of Waziristan. These operations were conclusive victories of Pakistan military against militants (PIPS, 2016).
Operation Brekhna (2009)
Pakistan military forces launched “Operation Brekhna (meaning Thunder)” against TTP (Tehrik -i-Taliban Pakistan) in Momand agency (Rehman et al., 2017). It began in 2009 and converted in
continuing operation “Zarb-e-Azb” in 2014.
Operation Khwakh Ba De Sham (2009-2010)
The counterinsurgency operation against TTP conducted by military in Orakazai agency and
Kurram agency called operation “Operation Khwakh Ba Da Sham (will teach you a lesson). It started in March 2010 and ended in June 2010. However, in September 2009, this operation was started in Kurram Agency (Khan, Z.A., 2012; Rehman et al., 2017).
Operation Zarb-e-Azb (2014-2017)
Operation Zarb-e-Azb intended as “eliminating terrorists regardless of the hue and color”. It was joint military offensive launched by Pakistan military forces against terrorist in NWA (North Waziristan Agency) without any distinction/discrimination of bad or good Taliban (Rehman et al., 2017). It is a successful operation and still ongoing in NWA. Operation Zarb-e-Azb
successfully brings the number of terrorist‟s incidents on minimum level and upgrade the image
8
of Pakistan on worldwide level also strengthens the relationship with bordering countries. Hence, it plays a crucial role in reinforce the bilateral ties among China and Pakistan, also bolstering the strategic ties in both states to deepened economic collaboration with China in the form of
“China-Pak Economic Corridor (CPEC)”.
Combing Operations (2016)
Combing Operations has been conducted countrywide to search and eliminate militants, their facilitators and sleeper cells.
Operation Radd-ul-Fasaad (2017-Onward)
Pakistan Army launched “Operation Radd-ul-Fasaad” across the country in the start of 2017. Operation intends at comprehensively eliminating residual threat of violence and ensuring the borders security. Tri Forces of Pakistan military, Law Enforcing Agencies (LEAs) and Civil Armed Forces (CAF) will endure to actively contribute to backing the efforts to eradicate the menace of violence/terrorism from the country. The efforts involve conduct counter-terrorism operation by Ranger in Punjab, continuance of ongoing operations crosswise the country and focus on more operative border security supervision. Countrywide explosive control and de-weaponisation are further cardinals of the efforts. Pursuance of NAP (National Action Plan) is the hallmark of operation Radd-ul-Fasaad.
2. Literature Review
Dunne et al., (1998) investigated the casual relationship between economic growth and defense spending of Turkey and Greece from the time period 1960-1996. For this purpose, they analysed
9
empirically justified his work by using negative binomial regrssion with robust standard error. Conclusions of his study shows that democratic involvment decrease terrorist events in a state rather than those state whose rulled by mixed system. On the basis of his empirical findings he suggested that democratic government can decrease the overall number of incidents within borders by satisfying its public and effective political participation rather to limitise press freedom, association and movement.
Drakos and Giannakopoulos (2009) analysed econometric analysis of the impact of counter-terrorism effectiveness on life and property losses. For this purpose, they used data on transational terrorism from ITERATE dataset (1973-2003). Further they empirically examined the Probit Model for finding probabilities for counter-terrorism effectiveness by authorities. They used time trend, militery expenditure, regime types, natural log of GDP per capita as control variables and used five dummmies denoting the number of terrorist groups and attacks types.
They also used „incident stopped by authorities‟ as dependent variable and a measure for
counter-terrorism. The study concluded that probability of terrorist attack is stopped by authorities has increased and relative counter-terrorism effectiveness increased when probability of casualities and property losses are diminish. Feridun and Shahbaz (2010) analysed that effectiveness of the military authorities is hamper terrorism in Turkey can be estimate. They explained their study with ARDL and Granger-Causality analysis with VECM by using time series data from 1986-2006. They obtained data for military defense expenditures from SIPRI, percentage of GDP and for terrorism events from MIPI dataset. They concluded their study on the basis of hypothsises as an increase in terrorist incident leads to an increase in military expenditure to counter-terrorim as expected. On the other hand the other hypothesis is failed to capture desired result as an increas in military expenditure leads to decline in terrorist activities. Futher they explained that military measures are not just enough to fight against terrorism but economic and social measures are also important to have desired results.
Dongen (2011) designed counter-terrorism effectiveness through different components like number of terrorist attacks, number of victims, material damages and number of arrest. According to authors these components may help to contribute in counter-terrorism effectiveness and can show whether counter-terrorism policies are doing well or not. He also mentioned that it is also necessary to consider and evaluate different separate components of counter-terrorism measures. The counterterrorism measures and implementations should be divides into some separate elements and that every element of policies leads to effectiveness. Than it will be easy to get desire result from that casual chain of separate elements of policies. He introduced a
10
data for the period 1974m1 to 2015m12, their findings from “negative binomial regression model” recommend that “peace accords have no significant impact on terrorism, while military operations increment terrorism, proposing the predominance of retaliation impact. Then again, operation Zarb-e-Azab, supplemented by the National Action plan, created a solid breakdown effect, prompting a significant diminishment in terrorism. Their findings support the idea that a viable counter-terrorism policy need a first rate military operation supported by strong political help.
3. Theoretical Framework
3.1 Potential impact of Terrorist act on Economic growth
The main short-run objective of terrorist is destabilization of economic growth. Terrorist attacks (such as bombing and assassination) are means to attain this short-run objective. Long-run political goals (e.g., redistribution of power and wealth) are to be imposed through such terrorist attacks. Collier (1999) distinguishes a few channels through which civil war influences the economy; Collier's thoughts might be exchanged to terrorism as another type of brutal conflict. The channels of exchange from war to the economy are: devastation, distraction, departure, dis-saving and portfolio replacement. Devastation mentions to the immediate costs of terrorist acts, as physical and human capital are crushed through psychological militant strikes.
The distraction impact may, for instance, converted manifest in higher exchange costs, as the adequacy of public foundations is challenged and controlled by terror, or as overall insecurity rises. Departure happens when public assets are moved from output-enhancing to non-beneficial security and defense expenditures. Dissaving indicates to a decrease in investment funds that influences the capital stock of economy. Portfolio substitution implies the flight of physical, human and budgetary capital from a nation in the face of war. Through every one of these impacts financial execution endures, specifically as they may strengthen each other. Entomb alia, Eckstein and Tsiddon (2004), Naor (2006) and Mirza and Verdier (2008) give related hypothetical considerations that additionally discuss about how terror may act contrarily on monetary movement.
As a rule, terrorism may mutilate the allocation of assets, fundamentally through the distraction, departure and portfolio replacement channel. It might likewise adversely impact asset accumulation, mainly by means of the devastation and dissaving channel. Blomberg et al.,
11
disturbance of exchange or tourism streams, or the redirection of assets far from private speculation, at last bringing about negative development impacts.
3.2 Potential Impact of Economic Performance on Terrorist act
Sandler and Enders (2004) argue that militants are rational individuals picking their levels of fierce action as indicated by the expenses and advantages emerging from their activities. In view of terrorist' assumed objectivity, the terror „opportunity costs likewise matter. Freytag et al., (2009) identifies that low opportunity costs of brutality (i.e., few prospects of monetary movement) lead to higher terrorism, though high opportunity costs result in the inverse. Times of financial achievement mean entomb alia, more individual monetary opportunities and investment. On the other hand, times of financial downturn ought to be joined by less economic opportunities and investment and hence by more financial disappointment. Blomberg et al.,
(2004) explained that during the monetary crisis protesters will probably depend on violence as the opportunity expenses of terrorism are low, while the potential long-run settlements from terrorism (i.e., a redistribution of rare financial assets which is to be authorized by terrorist actions) are nearly high.
To some degree, empirical evidence proposes that economic execution and terror are connected along the lines talked about before. The researches of Collier and Hoeffler (1998) show that larger amounts of financial advancement correspond with bring down probabilities of civil war, giving beginning confirmation that monetary achievement and struggle are oppositely contradicted. Considering financial advancement and terrorism, a few investigations find that more elevated amounts of improvement are impediments to the creation of terrorist acts (Santos Bravo & Mendes Dias, 2006; Lai, 2007; Freytag et al., 2009). Blomberg and Hess (2008) likewise find that higher earnings are a solid deterrence to the beginning of domestic terrorism. Moreover, Muller and Weede (1990) Freytag et al., (2009) find that there is prove associating strong short-run financial conditions with less political viciousness. Here, financial achievement appears to hinder the beginning of terrorism, apparently because of higher opportunity expenses of conflicts. As it were, during strong monetary execution people just have more to lose.
3.3 Rational Choice Theory of terrorism and Counter-terrorism
12
government authorities raise the relative cost of current attack that might change current possible attack to future periods. When the security level is high, current attack can be more costly than future ones. Consequently, the allocation of resources between different times period consider in balanced framework to maximize the predictable benefits, given the utility function:
( ) [∑ ( )] U’ (.) >0, U” (.) < 0 (A)
Where I1…. It represents terrorist incidence in different time periods given the information
obtainable. Likewise, a terrorist organization faces an inter-temporal constraint of budget while maximizing predicted utility. The inter-temporal constraint of resources of a militant organization is following:
(B)
Where R1 shows all resources of terrorist organization (including financial, physical, and
human) in time span 1, R2 represents the total budget in time span 2. A rational militant maximizes equation (A) given the constraint of budget in equation (B). A militant doesn‟t
utilize all resources in one time span because of maximizing the predicted benefits in two time spans. The higher security level increases the cost of an incidence in period 1 that subsequently reduces the predicted marginal benefits of an incidence. Consequently, a tactical terrorist organization allocates its resources between different time spans to keep the predicted level of least terrorism in each period. For instance, terrorist events in current period (period 1) are
equal to the organization‟s given capitals plus the reduced value of future (period 2) net
endowments. The 1st order condition for the maximization problem given in the next equation:
( ) ( )( ) (C)
For ease, we consider that the discount and interest rates are equal to 0. Equation (C) can be rewrite as:
( ) ( ) (D)
Where E(u1) and E(u2) the predicted marginal utilities from terrorist attack in current period (1)
and predicted period (2) respectively. Comprehensive and enhancement of security, including counterterrorism operations in present period reduces the predicted marginal utility of terrorist attacks comparative to its cost. A rational militant alternates available resources from current period (1) to predicted period (2) to satisfy the equation (D) for maintain a least or minimum level of terrorism overtime.
We debate now the deterrence, retaliation and breakdown hypotheses of counter surgery operations based on rational choice framework. Proactive measures and polices like military
operations decrease the terrorist group‟s contributions; from the left-hand side, it decreases R1 or
13
due to such preemptive policies (Rehman et al. 2017). If militant‟s organization assume massive losses from anti-terrorism actions of Government, it may reduce the violence in current period for the future periods (the deterrence effect). If a terrorist group targeted installations of Government without having complete information about the probable response and capacity of government, it may face greater loss in resources of organization. If Government reacts aggressively, it may lower the predicted attacks in future (the breakdown effect). Lastly, if “Law
enforcement agencies” take measures without any distinction and discrimination against
terrorists regardless of their hue and color, it may boost support for the terrorist organization which could enhance current attack (the retaliation or backlash effect).
Likewise, if the selective operations of military authorities relocate militants from one area to another, or if the organized terrorist organization has facilitators across country then one could suppose backlash attacks in reaction to counter-insurgency of Government. These intentions are investigated by using an equilibrium scrutiny of the utility function and budget constraint. It is predictable that a militant may alternates attacks overtime conditional on the opposing degrees of the deterrence, retaliation and breakdown effect. In short, a rational
militant‟s group chooses how to distribute attack across changed periods, allocating attacks
inter-temporally to captivate the shock from proactive and defensive anti-terrorism measures.
4. Data and Variables Description
4.1 Dependent Variable
For regression analysis, this study has included the number of Victims as a response variable for capturing the efforts of counter-terrorism (Dongen, 2011). The present study used „fatalities and
Injured‟ for number of victims in models and constructed these variables from GTD. This study also used GDP (per capita) as dependent variable for analyzing the impact of counter-terrorism on economic growth of Pakistan.
4.2 Explanatory Variables
This paper acknowledges that economic growth, politics and military spending are also strong contributors towards fighting against terrorism (Li, 2005). It includes these contributors for analysis the impact of counter-terrorism effectiveness on economic growth. The control variables count Gross Domestic Product (GDP), regime stability, population size, defense expenditures and total attack types. Details and sources of these variables are mentioned as requirement.
Regime Stability
14
type and it also helps for measuring authorities „effectiveness. The data has been drawn for
regime stability from Polity IV Project (Li, 2005).
Defense Expenditures
Drakos and Giannakopoulos (2009), Feridun and Shahbaz (2010) investigated “Defense expenditure” for measuring the authorities „effectiveness and used it as contributor to counter -terrorism. They mentioned in their study that authorities' counter-terrorism performance affects differently the likelihood of victims and property losses. This study has used defense expenditures as a proxy variable for counter-terrorism effectiveness and constructs data from Pakistan Economic Surveys.
Number of Incidence
Drakos and Giannakopoulos (2009) finds that counter-terrorism efforts made by authorities reducing terrorism incidents in country. Dongen (2011) used “number of terrorist attacks” as a measure of terrorism score in the country. This analysis accounted for counter-terrorism
effectiveness, so it used the “number of incidence” to estimate close relationship among counter -terrorism effectiveness and -terrorism.
GDP (Per capita)
Firstly, this study included the real GDP per capita as a main indicator and backer of growth. It used Gross domestic product (GDP) as the growth variable and compared the GDP of previous years with recent decades for investigating the impact of counter-terrorism effectiveness on economic growth. Li (2005) explained that terrorist incidents reduce by the economic development measured by GDP per capita.
4.3 Econometric Methodology
4.3.1 Negative Binomial Regression Model
For the analytical procedure, this study has used “number of victims” in each period as controlled variable against the effort level of Government authorities towards counter-terrorism. Here, the study is going to test the significance and magnitude of counter-terrorism effectiveness
by using “negative binomial regression model”. The terrorist incidents series is based on counts
so the dependent variable is count variable that allows us to estimate model through Count Data Models (Li, 2005). This paper has employed the “Negative Binomial Regression model” by following (Li, 2005). The count data models have some assumptions and limitations that based on observed, unobserved heterogeneity and dispersion in data.
The “Poisson regression model” indicates the observed heterogeneity among the observations i,
15
“Poisson regression model” by adding the parameter β that reveal unobserved heterogeneity
among predictions Long and Freese (2014), that is,
( | )
Where term δi = eγi is unobserved heterogeneity and predictor of the independent variables xi.
The variable Yi dependent on variable Xi and δi is Poisson with dependent mean and dependent
variance µiδi.
( | ) ( ) (1)
Let‟s assumed the probability mass function is p (δi). Then the model Pr (yi|xi) is (no longer dependent on τi) derived by integrating Pr(yi|xi, δi ) with respect to δi:
( | ) ∫ ( | ) ( ) (2)
The integral stays when δi is consider as going after a gamma distribution. This estimation is “Negative Binomial regression model” that have a constant term and it is important to suppose
that to explain the mean of the model Cameron and Johansson (1997). Thus, it
is supposed that δi go after a gamma distribution with Eδi =1 and Varδi= 1/ϑ.
( ) ( ) ( ) (3)
Where, ( ) ∫ ( ) gamma function and ϑ is a positive parameter. Thus, the mass of yi for given xi is estimated as,
( | ) ( ( ) )( ) ( ) (4)
By making the substitution ( ), the “Negative Binomial Model” can be revising as;
( | ) ( ( ))( )
( ) (5)
The gamma distribution of “Poisson regression” derived “negative binomial regression model”
that has a dependent mean,
( | )
And dependent variance,
( | ) ( ) ( ) ( | )
The dispersion in predictions is obtained by parameter β (Long and Freese, 2014). The dependent
variance of “Negative binomial model” exceeds the dependent mean. So, there is over-dispersion from unobserved heterogeneity. If the mean and variance are equal we have equi-dispersion in
16
mean, there is over-dispersion in data we need to use “Negative Binomial Regression Models” Cameron and Johansson (1997).
4.3.1.1 Over-dispersion Test
The “Negative Binomial regression” command count ln (α) so the null hypothesis is,
H0: ln (α) = 0
The alternative hypothesis is,
H1: ln (α) ≠ 0
The requirement of significance for test is α ≥ 0 and the sampling distribution will be normal for
α = 0 because values have a 0 probability when they are less than 0. The log likelihood-ratio (LR) test for H0: α = 0 i.e. mentioned below the parameters‟ estimation of NBR model (1).
Likelihood-ratio test of alpha=0: chibar2 (01) = 9809.80 Prob>=chibar2 = 0.000
The test statistics “chibar2 (01)” is estimated as,
G2 = 2 (ln LNBRM – ln LPRM)
= 2 (- 270.901 – (-5175.802)) = 9809.80
The log likelihood for the “Poisson Regression model” (ln LPRM) is use from the iteration „Fitting
Poisson Model‟ and the log likelihood for “negative binomial regression model” (ln LNRBM) is
from the end of the final iteration. There is strong and significant evidence for over-dispersion (G2 = 827.71, p < 0.000, so the “negative binomial regression model” (NBRM) is preferred over
the “Poisson Regression model” (PRM). The log likelihood ratio is not shown for robust
standard error option because robust standard error has computed in NBRM by simply if there is over-dispersion Long and Freese (2014).
4.3.1.2 Robustness Test
When variance specification is misspecified in the model, standard errors are downwardly biased in presence of over-dispersion, so it is recommended that with the “negative
binomial regression model” (NRBM) this study can use the robust standard error Cameron and
Trivedi (2013). The “negative binomial model” can perfectly estimate the predicted probabilities
in the presence of over-dispersion. When the study uses robust standard errors, the “negative
17 4.3.1.3 Interpretation using IRR
The “incidents rate ratio” (IRR) is an equation for the NBRM using for interpreting the
change in predicted count by the predictors Long and Freese (2006). The linear combination of explanatory variables predicts the log of count variables.
( )
This implies,
( ) ( ) ( ) ( ) ( )
The leading interpretation is that a change of β in xk, the predicted counts exceeds by a factor change of exp (βk*α) keeping other variables same Long and Freese (2006). The estimated coefficients in log(y) have an “additive effect” and the IRR explained the “multiplicative effect” in the y. The expected counts do not effect by the dispersion parameter “alpha” in NBRM but
estimated variance does effect by the “alpha” Long and Freese (2006).
4.3.1.4 Interpretation using Marginal Effects and Predicted Probabilities
In the “negative binomial regression model” with the presence of over-dispersion, the predicted probabilities can differ substantially and the predicted rates are same Long and Freese (2006). For this, the method for interpreting predicted probabilities is same as we computed
probabilities for “negative binomial regression model”,
( | ) ( ( ) () ) ( )
Where,
µ = exp (xα)
By using „predict‟ we can estimate predicted probabilities for observed values of explanatory variables. Predicted Probabilities can be computed using margins or marginal effects. Marginal effects or margins can estimate the change in a predicted size as an explanatory variable change, keeping other variables constant Long and Freese (2006). The marginal effects can estimate prediction. The dy/dx (varlist) is denoted for the list of independent variables for those changes are computed, hence dy/dy (*) shows that changes for all explanatory variables are to be estimated. The marginal effects compute the marginal change that is the partial derivative with respect to a given variables, keeping other variables constant.
4.3.2 An Econometric Analysis of Counter-terrorism and Economic Growth
18
terrorism (Barros, 2003). If there is integration in two series the Granger Causality must be present in at least unidirectional (Engle and Granger, 1987). The first step has been taken to construct the integration assumption of our series through “Augmented-Dickey Fuller (ADF)
test”. If all series have a same level of integration i.e. I (1), then might be the series have long -run relationship. The second step has been taken to find long--run and short--run relationship by
using “ARDL bound test” and VECM for separating long-run and short-run coefficients. The last
step entails to build the “Granger-causality test” enlarge with a suitable error term. These steps have been taken to pre-test strategy to construct whether causality occur earlier to specifying the direction via level Granger-test (Dunne et al, 1998).
4.3.2.1 Testing for Unit-root
This paper begins empirical analysis by using ADF test for establishing the assumption of integration for Gross Domestic Product (GDP), number of incidents, Polity (regime type), and defense expenditures. For granger causality test, series must be integrated at order one denoted as I (1) Asteriou (2015). So, we employ ADF test to check the stationarity of series. The ADF methodology includes additional lagged terms of controlled variables to remove autocorrelation. The lag length criteria for additional terms is either check through AIC and SBC or more appropriately by the needed lag length to check the residual Asteriou (2015).
The three feasible types of the ADF test are mention in following equations:
∑ (1)
∑ (2)
∑ (3)
Where,
( ∑
)
∑
The coefficient of attention is β, if β=0 the equation is integrated at order 1, so it has unit root
Enders (2004). Again, the variation between above three regressions prior to existence of these
δ0 and δ2t components. The critical values of the ADF test take from MacKinnon (1991).
4.3.2.2 ARDL Bound test
19
performs preferred in small sample sizes over other cointegration procedures. Furthermore, it is applicable independent of whether the fundamental regressors are simply I(0), absolutely I(1) or commonly cointegrated. The statistics underlying this system is the commonplace Wald or F-statistics in a summed up Dickey– Fuller type regression, which is utilized to test the significance of lagged levels of the variables under thought in a conditional unrestricted equilibrium "error correction model(ECM) (Pesaran et al., 2001).
The ARDL approach includes estimating the conditional error correction version of the ARDL model for the variable under estimation. The Augmented ARDL (p, q1, q2,…, qk) is given by the following equation (Pesaran et al., 2001):
( ) ∑ ( )
( )
Where,
( )
( )
yt is dependent variable, β is the constant term, l is the lag operator such that lyt = yt– 1, wt is the
s × 1 vector of deterministic variables such as intercept term, exogenous variables with fixed lags. The long-term elasticities are measured by:
̂( ̂) ( ̂)
̂ ̂ ̂ ̂
̂ ̂ ̂ ( )
Where ̂ ̂ , i = 1, 2, ..…, k are the selected (estimated) values of ̂ ̂ , i = 1, 2, .…, k. The long run coefficients are estimated by:
̂( ̂ ̂ ̂ ̂ )
̂ ̂ ̂ ( )
Where ̂( ̂ ̂ ̂ ̂ ) denotes the OLS estimates of ̂ in equation (1) for the selected ARDL model.
20
2005). This study utilizes a more broad type of ECM with unrestricted intercept and no trends (Pesaran et al., 2001):
∑
( )
Where c0≠ 0 and c1 = 0. The “Wald test” (F-statistics) for the null hypothesis are:
and alternative hypothesis are:
Hence, the combined null hypothesis of the concern in the above equation is given by:
and the alternative hypothesis is respectively stated as:
In the present study, the existence of a long-run relationship between counter-terrorism and economic growth investigated in the form of the unrestricted error correction model for each variable as follows:
∑
∑
∑
∑
∑
( )
Where, GDP representing economic growth, however DEXP, Victims, NOI, and Polity are components of counter-terrorism. On the flip side is error term in the model. The first part of
both equations with α1, α2, α3,α4 α5 represents the short-run dynamics of the model, whereas the second part with α6, α7, α8, α9, α10 represents the long-run phenomenon. The null hypothesis in
equation (5) is α6 = α7 = α8 = α9 = α10 = 0 which means the non-existence of the long run
relationship and vice versa.
21
regardless of whether the fundamental orders of integration of the variables are I(0) or I(1). Similarly, if the F-test statistic falls below the lower critical value, the null hypothesis is not rejected. However, if the sample F-test statistic falls between these two bounds, the result is inconclusive. When the order of integration of the variables is known and all the variables are I(1), the decision is made based on the upper bounds. Likewise, if all the variables are I(0), then the decision is made based on the lower bounds. The model can be selected using the lag length criteria like Akaike information criterion, Schwartz-Bayesian Criteria (SBC) and Hannan-Quinn (HQ) information criterion.
4.3.2.3 Granger Causality test
The third stage includes accompanying standard “Granger causality test” augmented with a lagged error-correction term. “Granger Causality test” is often used to check the causal relationship among variables. The Granger representation theorem recommends that there will be Granger causality in at least one direction if there occur a co-integration relationship among the variables offers the variables are integrated order of one. Engle and Granger (1987) cautioned that if the Granger causality test is conducted at first difference through the vector auto regression (VAR) method then it will be misleading in the presence of co-integration. Therefore, a presence of an additional variable to the VAR method such as the error correction term would help us to capture the long-run relationship.
The Granger (1969) model provides a bivariate VAR model that is used in this study to empirically test the causal relationship between counter-terrorism measures and economic growth.
∑ ∑ (6)
∑ ∑ (7)
The null hypothesis for this test can be formalize as equation (7) is “X does not granger-causes
y” or “y does not granger causes x”.
Ho: γi = 0, i = 1, 2, 3,…, m
Ho: γj = 0, j = 1, 2, 3,...., n
And the alternative hypotheses can we written as follows,
H1: γi≠ 0, i = 1, 2, 3, ..., m
H1: γj≠ 0, j = 1, 2, 3, ..., n
It‟s may appear that test provides us some amazing results when we count the definitions of
22
desired value is at and the expected square of the difference between at and yt is cost function
(Granger, 1988).
Suppose the government has controlled the variable xt and yt is derived from following equation,
we have,
(8)
Let the predicted variable is Xt, refers as wt-1= xt and it is also belonging to time in which it is estimated, εt is white-noise zero mean.
(9)
( ) (10)
(11)
Where,
( )
The interpretation will be incorrect if equation (10) would explained by an economic theory that wt-1 must be causes by yt. From the perspective of government in this case wt-1 does not causing
yt. Equation (11) contained the information that yt and at is exactly explaining wt (Granger,
1988).
The “vector error correction model” is stated as follows:
∑
∑
∑
∑
∑
( )
Where α1, α2, α3 α4 and α5 are the short-run dynamic coefficients of the model‟s convergence to
equilibrium and α is the speed of adjustment. Through the ECT, the VECM offer new directions for Granger causality to appear. Long-run causality can be exposed through the significance of the lagged ECTs by a t- test, while the F-statistic or Wald test examine short-run causality over the significance of joint test with an application of the sum of lags of explanatory variables in the model.
5. Empirical Results and Discussion
5.1 Findings of Negative Binomial Regression model
The “negative binomial regression model” provides the results for a concerned objective
23
terrorism are working or not. Perhaps the scholarly counter-terrorism research pays a bit attention to when and how counter-terrorism yields the needed results (Lum et al., (2006).
5.1.1 Statistical Description
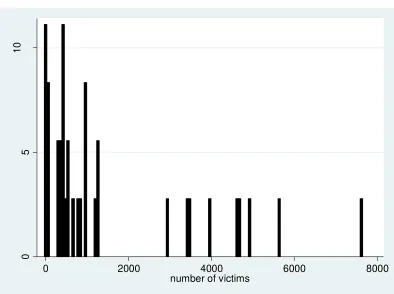
It‟s always a better idea to begin with plots and statistical description. The statistical description of the annual number of victims given in table (5.1). The distribution of dependent variable seems much responsible. The statistical description of count variable shows that the conditional mean is very lower than the conditional variance of variable. Hence, the assumption
of “negative binomial regression model” is completely fulfilled as the conditional variance is
exceeds than the conditional mean of count variables, so it suggests for using the “negative
binomial regression model” for count dependent variable (Rehman et al., 2017).
Table (5.1) Statistical Description for Annual number of Victims
Time Period Total Victims Mean St.Dev. Min Max
1980-2015 55072 1529.7 1951.52 0 7631
1980-2000 10225 486.9 435.06 0 1286
2001-2015 44847 2989.8 2309.8 300 7631
2006-2015 42349 4234.9 1760.6 965 7631
Graph (5.1) Histogram for Number of Victims
0
5
10
0 2000 4000 6000 8000
[image:24.612.110.504.416.710.2]24
Table 5.2: Negative Binomial Regression Model for No. of Victims
Variables Estimated
Coefficients
Standard Errors (Robust)
IRR
p-values
Marginal Effects
GDP (per capita) -0.0795 0.0629 0.9235 0.207 0.445
Polity (Regime Type) 0.0749 0.0331 1.0778 0.024 0.032
Defense Expenditures -0.2909 0.1498 0.7475 0.052 0.010
No. of Incidence 0.0006 0.0003 1.0006 0.063 0.134
Lnalpha -0.2051 0.3281 - - -
Alpha 0.8145 0.2672 - - -
Likelihood-ratio test of alpha=0: chibar2 (01) = 9809.80 Prob>=chibar2 = 0.000
5.1.2 Analysis of Counter-Terrorism Effectiveness
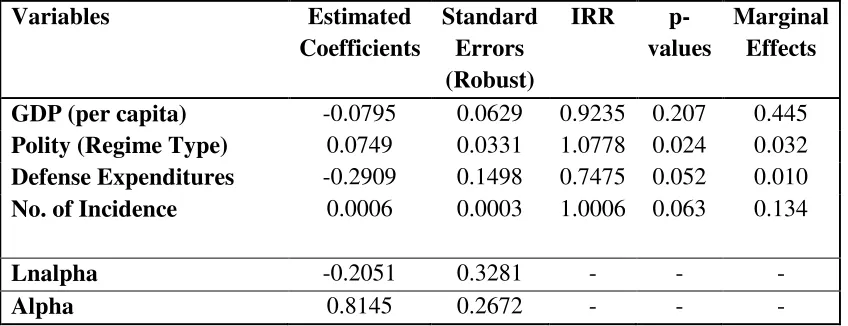
The estimation of “negative binomial regression model” mentioned in table (5.2) and it
appropriately fulfilled the hypothesis of our study. In this part, we present sensitivity analysis for assessing the robustness of our findings. The degree of increasing or decreasing number of victims conditioned on different counter-terrorism measures.
Table (5.2) indicates the empirical findings for the counter-terrorism achievements based on the
results. The GDP (per capita) is estimate of “negative binomial regression”; the coefficient of
GDP is negative but insignificant. It indicates that income has no impact on terrorism and counter-terrorism measures in Pakistan. Moreover, religious, ethnic and political indicators can affect the terrorism and counter-terrorism measures in the country. The marginal effect indicates that probability of number of victims for GDP (per capita) is increase by 44.5 percentage points (Drakos and Giannakopoulos, 2009). For counter-terrorism measures, economy is an indirect and not good indicator to interpret effectiveness (Dongen, 2011).
Polity is also positive and significant explanatory variable of model indicates that unstable democratic participation can increase the expected number of terrorist attacks by 0.0749 percent. The marginal effect for polity, the probability of number of causalities increase by 3.2 percentage points. Countries with stable regimes experience fewer terrorist incidents than those countries which are not politically stable (Li, 2005). The positive relationship between terrorism and polity is due to political instability (Piazza, 2006).
25
probability of number of victims, a result that is contrast to estimated coefficient (Drakos and Giannakopoulos, 2009). Military actions and proactive efforts in a backlash of terrorist activities can exceed the deadly terrorist attacks as beef (Rosendorff and Sandler, 2004). The incident rate ratio (IRR) shows that one unit increase in defense expenditures can decrease the terrorist attacks by factor 0.7475. This estimation is raw evidence of effectiveness level of military authorities and counter-terrorism seems much more effective as compared to terrorism. The deterrence effect is measured by the defense expenditures and result shows its dominants on retaliation effect.
The estimated coefficient of number of incidence is positive but significant. The increasing number of incidents shows the retaliation effects. The marginal effect for number of incidence shows that the probability for number of victims increases by 13.4 percentage points (Drakos and Giannakopoulos, 2009). An increase in the total terrorist attacks is not a definitive indication that counter-terrorism measures are not working well. The severity in terrorist incidents can be the result of radicalization which shows the psychological level of new terrorist group. The reinforce one type of attack would exceeds the other types of attacks and this intensity of terrorist campaign might be dangerous for terrorist organizations (Dongen, 2011). The estimation shows that if a unit increases in number of terrorist attacks can increase the number of victims by 0.0006 units. The defensive efforts of military authorities can move the attention of terrorist organizations from hard targets to soft targets e.g. increasing number of victims (Dongen, 2011).
5.2 Analysis of Economic Growth and Counter-Terrorism
5.2.1 Results of Unit Root
Table (5.3) Augmented Dickey Fuller (ADF) test
Variables
Level
Intercept Trend & Intercept
1st Difference
Intercept Trend & Intercept Decision
NOI -0.6079
(0.8505) -1.2639 (0.8714) -2.7003 (0.086) 1.9607 (1.000)
Non-stationary at I(0) but Stationary at I(1)
D.Exp 0.7340
(0.9912) -2.1075 (0.5239) -7.502 (0.0000) -7.953 (0.0000)
Non-stationary at I(0) but Stationary at I(1)
Polity -1.703 (0.4207) -1.6885 (0.7351) -5.4334 (0.0001) -5.359 (0.0006)
Non-stationary at I(0) but Stationary at I(1)
GDPPC -4.1122
(0.0029) -3.4439 (0.0205) -7.3855 (0.0000) -7.3755 (0.0000)
Stationary at I(0) but also Stationary at I(1)
NOV -1.3878
(0.5770) -2.3647 (0.3904) -5.4029 (0.0001) -5.4526 (0.0005)
[image:26.612.68.546.486.677.2]26
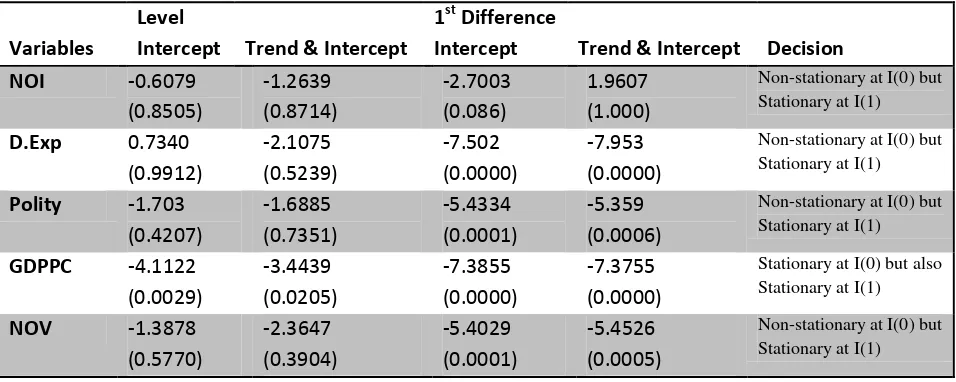
Through appropriate unit root test (ADF) this study checked the stationarity of all variables. The tabulated t-values compared to the calculated t-value. The results of ADF test shows that all variables of counter-terrorism measures and economic growth are stationary at I(0) level (intercept, trend and intercept). But they some of them became stationary after taking first difference I(1). Further, the results of ADF test fulfilled the assumption of integration for Cointegration test and Casualty test that all variables are stationary at 1st difference. The studies of Anwar et al., (2012) and Malik and Zaman (2013) are supportive in this regard.
5.2.2 ARDL Bound test approach to Long-run Relationship
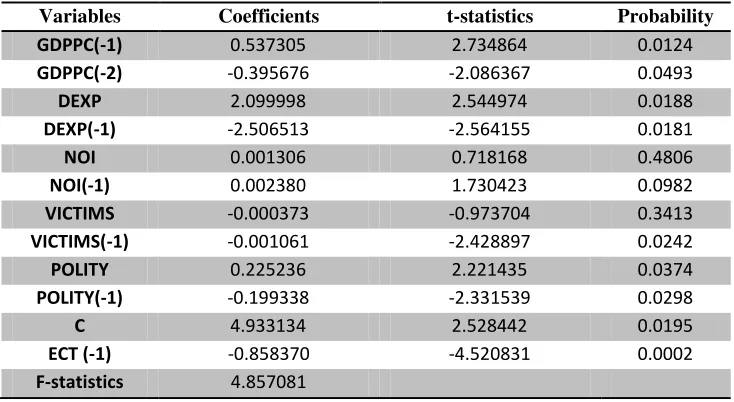
[image:27.612.123.490.381.582.2]The results of the ARDL bounds testing approach to long run relationship are reported in Table (5.4). The findings of the short run dynamic coefficients related with the long-run relationships attained from the equation (5) are given in Table (5.4). The results recommend the rejection of the null hypothesis of no long-run relationship at the 5% level of statistical significance when GDP is treated as the dependent variable. As can be seen from the table, the estimated F-statistic is greater than the upper bound critical values given in the model at 5% and 2.5 % level of significance. This finding shows the presence of a long-run relationship between economic growth and counter-terrorism when the latter is treated as the independent variable.
Table 5.4 ARDL (2, 1, 1, 1, 1) Model selected based on AIC
Variables Coefficients t-statistics Probability
GDPPC(-1) 0.537305 2.734864 0.0124
GDPPC(-2) -0.395676 -2.086367 0.0493
DEXP 2.099998 2.544974 0.0188
DEXP(-1) -2.506513 -2.564155 0.0181
NOI 0.001306 0.718168 0.4806
NOI(-1) 0.002380 1.730423 0.0982
VICTIMS -0.000373 -0.973704 0.3413
VICTIMS(-1) -0.001061 -2.428897 0.0242
POLITY 0.225236 2.221435 0.0374
POLITY(-1) -0.199338 -2.331539 0.0298
C 4.933134 2.528442 0.0195
ECT (-1) -0.858370 -4.520831 0.0002
F-statistics 4.857081
Table 5.5 Critical Value Bounds
Significance I0 Bound I1 Bound
10% 2.45 3.52
5% 2.86 4.01
2.5% 3.25 4.49
27
The coefficient on the lagged error-correction term (ECT) is significant at 1% level with the negative sign, which approves the result of the bounds test for cointegration. Its value is estimated to -0.85 which suggests that the speed of adjustment to equilibrium is high. Approximately, this model is getting adjusted at the speed of 85% converge to the long-run equilibrium. In the long run D.Exp, Victims, NOI and Polity Granger cause GDP. This result suggests that causality runs cooperatively through the error-correction term from D.Exp, Victims, NOI and Polity to GDP. In the short run, only defense expenditure and polity are significant at 5% level and has an important impact on GDP. Economic growth and Victims have a negative impact but not significant. The impact of NOI is positive but not significant.
5.2.2.1 Diagnostic Test
[image:28.612.81.529.333.365.2]The regression for the fundamental ARDL equation (5) fits very well and the model is globally significant at 5% level and 2.5%. It also passes the diagnostic test against serial correlation (Durbin Watson test and Breusch-Godfrey test).
Table 5.6 Breusch-Godfrey Serial Correlation LM Test
F-statistic 0.962566 Prob. F(2,19) 0.3998 Obs*R-squared 2.944031 Prob. Chi-Square(2) 0.2295
The p-values is only approximate, but they strongly suggest that there is no evidence of serial correlation in the model's residuals.
5.2.2.2 Parameter Stability Test
The presence of cointegration between economic growth and counter-terrorism measures does not necessary indicate that the valued coefficients are stable. If the coefficients are not stable the results will be possibly biased. For testing the long-run parameter stability, Pesaran and Pesaran
(1997) recommend applying the “cumulative sum of recursive residuals” (CUSUM) and the “CUSUM of square” (CUSUMSQ) tests to the residuals of the estimated error correction models.
The benefit of these tests is that, unlike the Chow test that entails break point(s) to be identified, they can be used without the condition of a priori information of the structural break point. The associated null hypothesis is that all coefficients are stable.
The CUSUM test practices the “cumulative sum of recursive residuals” created on the first
28
lines are crossed then the null hypothesis of parameter stability is rejected at the 5% significance level.
-15 -10 -5 0 5 10 15
96 98 00 02 04 06 08 10 12 14
CUSUM 5% Significance
Graph (5.2) Plot of cumulative sum of recursive residuals
Note: The straight lines represent critical bounds at 5% significance levels
-0.4 -0.2 0.0 0.2 0.4 0.6 0.8 1.0 1.2 1.4
96 98 00 02 04 06 08 10 12 14
CUSUM of Squares 5% Significance
Graph (5.3) Plot of cumulative sum of squares of recursive residuals
Note: The straight lines represent critical bounds at 5% significance level.
Graph 5.2 and 5.3 shows the results of the CUSUM and CUSUMSQ, respectively. As can be seen, the results show the absence of any instability of the parameters because the plot of the CUSUM and CUSUMSQ statistic lie within the critical bands of the 5% confidence interval of parameter stability.
5.2.3 Causality between Counter-terrorism and Economic Growth
bi-29
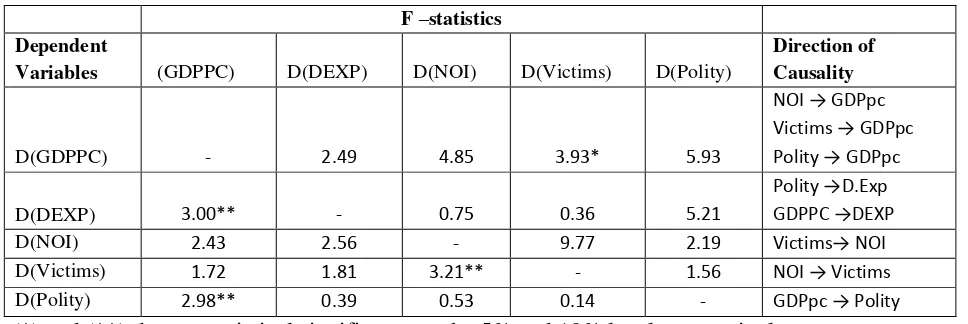
variate “Granger Causality test" for variables of economic growth and variables of counter -terrorism by following the sequence of variables in ARDL model. For Granger Causality, if the F-statistics is 4 and p-value is lower than 0.05 than we reject Ho (Anwar et al., 2012).
Table (5.7) Results of Granger Causality test
F –statistics Dependent
Variables (GDPPC) D(DEXP) D(NOI) D(Victims) D(Polity)
Direction of Causality
D(GDPPC) - 2.49 4.85 3.93* 5.93
NOI → GDPpc Victims → GDPpc Polity → GDPpc
D(DEXP) 3.00** - 0.75 0.36 5.21
Polity →D.Exp GDPPC →DEXP
D(NOI) 2.43 2.56 - 9.77 2.19 Victims→ NOI
D(Victims) 1.72 1.81 3.21** - 1.56 NOI → Victims
D(Polity) 2.98** 0.39 0.53 0.14 - GDPpc → Polity
(*) and (**) denote statistical significance at the 5% and 10% levels respectively.
Table (5.7) indicates the results for the causal relationship between economic growth and counter-terrorism measures. Results shows that NOI does Granger cause GDPPC, Victims does Granger cause GDPPC, it means there is uni-directional causal relationship between these variables.Polity does Granger cause GDPPC and GDPPC does Granger cause Polity that means there is bi-directional causality exist. GDPPC does Granger cause DEXP. Polity does Granger cause DEXP but DEXP does not Granger cause Polity, implies that unidirectional causality occurs between Polity and DEXP (Malik and Zaman, 2013). However, NOI does Granger cause Victims and Victims does Granger cause NOI which implies the bi-directional causal relationship between NOI and Victims.
6. Conclusion and Policy Implications
6.1 Conclusions
This study aimed to investigate the impact of counter-terrorism effectiveness on economic growth. Due to lack of most essential and appropriate data for the analysis of counter-terrorism polices on public databases, the present study has used different components of terrorism events that may help to contribute in counter-terrorism effectiveness. The results of those components shows when and how counter-terrorism policies yield the desired results. For this purpose, we
constructed data on terrorism events from “Global Terrorism Database” (GTD) for the period
1980-2015 and employed data for economic growth from “World Development Indicators” (WDI).
[image:30.612.66.550.153.315.2]30
which explained through peace accords and agreements, Retaliation effect that showed the effort level of terrorist organizations and Breakdown effect which explained the incapacitation of terrorist organization by following civilian polices and military operations.
The study empirical test the magnitude and significance of counter-terrorism effectiveness
through “negative binomial regression model” (NBRM). The estimation is raw evidence of effectiveness level of military authorities and counter-terrorism seems much more effective as compared to terrorism. The deterrence effect is measured by the defense expenditures and result shows it dominants on retaliation effect. The findings show that defensive efforts of military authorities can move the attention of terrorist organizations from hard targets to soft targets and increase the number of victims and more deadly terrorist attacks as gripes. The result implies that counter-terrorism policies and strategies may not be able to restrict violence and incapacitate
militant‟s organization if it lacks solid political support.
On the flip side, this paper has developed econometric models for ARDL Bound testing and causality analysis for checking the relationship between counter-terrorism effectiveness and economic growth. It empirically checked the cointegration for long run as well as short-run relationship exists between economic growth and counter-terrorism efforts. The results also show that there are short term and also long term impacts of counter-terrorism effectiveness on economic growth of Pakistan, but strong counterinsurgency strategies can lead to long term impacts in future.
In 2015, Pakistan recorded a considerable drop in terrorism with 45 % less assaults and 38 % less deaths than in the earlier year (U.S Country Report on Terrorism 2016). This is the second back to back year in which Pakistan has seen a diminishment in terrorism. Terrorism in the nation is currently at its most reduced levels since 2006. Be that as it may, with 1,086 victims, Pakistan is yet the 6th deadliest nation. The diminishment in death from terrorism is to a limited extent clarified by Operation Zarb-e-Azb by the Pakistan Army which began in mid-2014. This concentrated on expelling activist places of refuge in the North Waziristan locale of the FATA (Global Terrorism Index, 2016). The results show the significant backlash or breakdown effect of proactive measures, exclusively military operations, by law enforcement agencies and departments.
6.2 Policy Implications