Munich Personal RePEc Archive
Does institutional quality foster
economic complexity?
Vu, Trung V.
Department of Economics, University of Otago, New Zealand
December 2019
December 20, 2019
Does institutional quality foster economic complexity?
Trung V. Vu*
Department of Economics, University of Otago, Dunedin, New Zealand
Abstract
This paper examines the extent to which the quality of institutions, measured by the
Economic Freedom of the World index, helps shape cross-country differences in
economic complexity. To this end, I employ the intensity of ultraviolet radiation
(UV-R) to isolate an exogenous source of variation in institutions, which helps circumvent
endogeneity concerns. Empirical results indicate that the exogenous component of
institutional quality exerts a strong and robust positive effect on economic complexity.
The findings prevail after performing a battery of robustness tests. Furthermore, I find
that institutions affect economic complexity by inducing human capital accumulation
and strengthening incentives for innovative activities.
Key words: Economic Complexity, Economic Freedom, Institutions, Capabilities,
Productive Structures.
JEL Classification: O43, O11, H11.
* Corresponding address: Department of Economics, University of Otago, PO Box 56, Dunedin
9054, New Zealand. Email: [email protected] or [email protected].
1
1. Introduction
One of the most intriguing and difficult questions in economics is “why are some countries
more affluent than others?” Recent contributions to this debate hold that economic complexity
helps explain the pattern of economic growth and development in the world (Hidalgo &
Hausmann, 2009; Hausmann & Hidalgo, 2011; Hausmann et al., 2014; Hartmann et al., 2017;
Lee & Vu, 2019). Specifically, complexity reflects the level of sophistication of production of
an economy. Thus, robust growth would be seen in countries whose productive structures are
geared toward sophisticated products (Felipe et al., 2012). This line of inquiry has its roots in
an earlier view asserting that economic development is the process of structural transformation
by which resources are transferred from low-productivity (simple) industries toward
high-productivity (complex) industries (e.g., Lewis, 1955; Rostow, 1959; Kuznets & Murphy,
1966; Kaldor, 1967; Chenery & Taylor, 1968). A key insight of this literature is that the mix
of products an economy produces is strongly predictive of its economic performance.
A quantitative measure of the productive structure, however, has been equated with the
contribution of agriculture, manufacturing and services to GDP for many decades. Hartmann
et al. (2017) argue that this aggregate measure does not effectively capture the level of
sophistication of a country’s production.1 To address this concern, Hidalgo and Hausmann
(2009) develop the Economic Complexity index (ECI), using highly disaggregated data at the
product level. This indicator reflects the availability of productive capabilities that allow a
country to produce more sophisticated products. Recent studies find that economic complexity
is a strong and robust predictor of economic growth (Hidalgo & Hausmann, 2009; Felipe et
al., 2012; Hausmann et al., 2014; Zhu & Li, 2017) and income inequality (Hartmann et al.,
2017; Lee & Vu, 2019).
Moreover, Sweet and Maggio (2015) contend that economic complexity constitutes a
good measure of a country’s innovative outputs. An increase in complexity implies an improvement in production capacity, obtained through acquiring new productive capabilities.
It also captures the extent to which a country can utilize its knowledge and capabilities to create
innovative outputs, which is relevant for economic prosperity. If economic complexity
1 Hartmann et al. (2017) note that calculating the sophistication of the productive structure at broad categories
2
determines the pattern of growth and development across countries, an interesting question
emerges as “What determines economic complexity in the first place?”
There is a parallel literature arguing that the quality of institutions is a fundamental
determinant of long-run economic performance. In particular, the institutional theory of
comparative development can be traced back to the seminal contribution of North (1990, p. 3)
who views institutions as “the rules of the game in a society, or, more formally, … the humanly
devised constraints that shape human interaction.” Good institutions, reflected in security of
property rights or competitive markets, affect the relative returns to different productive and
non-productive economic activities. As such, institutional quality fundamentally drives
motivations for investment in human and physical capital and innovative activities. This
ultimately helps explain wealth differences across the world.
On the empirical side, testing the effect of institutions on economic performance is
challenging mainly because of the endogeneity of institutions. An influential study that
endeavors to tackle this issue is the seminal article of Acemoglu et al. (2001). A novel
contribution of this much-cited paper is that it employs the settler mortality rate as an
exogenous source of variation in institutions to explain the global inequality of GDP per capita.
The authors argue that Europeans adopted different colonization strategies depending on the
disease environment of former colonies. In places where Europeans could healthily settle, they
established inclusive institutions. In contrast, where the disease environment was unfavorable
for Europeans to settle permanently, they set up extractive institutions. The early institutions
persist until today, thus affecting economic development. Subsequent studies lend strong
empirical support for the causal effect of institutions on economic progress (e.g., Easterly &
Levine, 2003; Rodrik et al., 2004; Acemoglu & Johnson, 2005; Acemoglu et al., 2005;
Knowles & Owen, 2010; Acemoglu et al., 2014). If the cross-country variation in income per
capita is rooted in differences in institutions, we may well ask whether institutions
fundamentally drive economic complexity in the first place.
The two lines of research discussed above offer two different views about the
determinants of comparative prosperity across countries. Hence, they have been generally
examined separately as competing alternatives. This paper goes beyond the current literature
by bringing them together. In particular, this is the first study that empirically examines the
effect of institutional quality on economic complexity. I hypothesize that institutions positively
affect economic complexity through providing incentives for innovative activities and human
3
capture the long-run relationship between economic complexity and the quality of institutions.
Empirical results lend strong credence to this supposition. I also perform a variety of sensitivity
tests, none of which alters the main results.
This study contributes to a rapidly growing body of research examining economic
complexity as a driver of economic development (Hausmann & Rodrik, 2003; Hausmann et
al., 2007; Hidalgo & Hausmann, 2009; Hausmann & Hidalgo, 2011; Felipe et al., 2012;
Hausmann et al., 2014; Hartmann et al., 2017; Zhu & Li, 2017; Lee & Vu, 2019). In particular,
this paper attempts to uncover the institutional environment that fosters the ability to produce
more value-added products (Zhu & Fu, 2013). By doing so, it contributes to a better
understanding of the fundamental determinants of economic complexity. Additionally, I also
provide some evidence of the mechanisms through which institutions transmit to complexity.
The current research is closely related to Zhu and Fu (2013) who explore the determinants
of export sophistication, using a system GMM estimator. This paper, however, focuses on
economic complexity, which resolves several issues of the export sophistication index of
Hausmann et al. (2007). As noted by Felipe et al. (2012), complexity provides better
information than the measure of export sophistication when it comes to reflecting the level of
sophistication of production. I also use an exogenous instrument instead of relying on internal
instruments as in their work. Importantly, this paper takes into account different theories of
comparative development. Thus, I control for other fundamental determinants of economic
performance. Failure to incorporate those potential confounders may yield biased and
inconsistent estimates as discussed later.
Moreover, this paper advances the literature exploring institutions as the fundamental
determinants of economic performance in different dimensions. First, it employs the Economic
Freedom of the World index as the proxy for institutions. This indicator reflects a broad range
of institutions and policies that co-evolve with economic development. As highlighted by Faria
et al. (2016) and Bennett et al. (2017), this index is more informative for policymakers than
unidimensional measures of institutions (e.g., constraints on the executive, rule of law, or risk
of expropriation). Glaeser et al. (2004) note that defining institutional quality as security of
property rights is too narrow, which necessitates using better measures of institutions.
Nevertheless, other measures of institutional quality will be used for sensitivity analysis.
Second, I use the intensity of ultraviolet radiation, constructed by Andersen et al. (2016),
4
institutional theory of Ang et al. (2018). This instrument also has several advantages over the
settler mortality rate of Acemoglu et al. (2001), which will be discussed later. However, the
settler mortality rate will be used as an instrument in a robustness test. Finally, this paper
contributes to an inconclusive debate on the relative significance of institutions and geography,
with some studies finding that geographic endowments directly affect economic performance
(Sachs, 2003; Carstensen & Gundlach, 2006), while other papers argue that geography affects
prosperity only indirectly via institutions (Easterly & Levine, 2003; Rodrik et al., 2004). I find
that the effect of institutions on complexity remains relatively robust to including a large set of
geographic controls. By contrast, most geographic variables are individually insignificant at
conventionally accepted levels when institutions are included in the regression. This adds
evidence supporting the primacy of institutions.
The rest of the paper proceeds as follows. Section 2 discusses the theoretical framework
for analysis. Section 3 describes the econometric methods used to estimate the causal effect of
institutions on complexity. Section 4 provides the main empirical findings, followed by
discussions of the results of robustness tests in Section 5. Next, Section 6 examines the channels
of causality. The paper concludes by summarizing the results and discussing some implications
for policymakers and future research.
2. Theoretical framework
An early line of inquiry emphasizes the role of formal and informal institutions in economic
development (North, 1990; Williamson, 2000). Building upon this literature, subsequent
studies attend to the quality of institutions as a key deep determinant of long-term economic
performance (e.g., Hall & Jones, 1999; Acemoglu et al., 2001; Acemoglu et al., 2005;
Knowles & Owen, 2010; Acemoglu et al., 2014). The institutional viewpoint, in particular,
holds that institutions, often referred to as “rules of the game”, stimulate investment in human
capital and innovation, thus driving comparative prosperity. Consistent with this view, I argue
that institutions exert a positive influence on economic complexity by enhancing the quality of
human capital and providing incentives for innovative activities.
There is a vast literature linking economic institutions and human capital. Dias and
Tebaldi (2012), for example, construct a micro-foundations model demonstrating that
institutional quality plays an important role in affecting the pattern of human capital
accumulation. Specifically, the incentives to improve education depend on returns to
5
reflected in security of property rights, enforcement of contracts, laws, and regulations, are the
prerequisites of a well-functioning labor market. This affects the gains from obtaining
knowledge, thus promoting human capital accumulation. Furthermore, human capital is
essential for a country to obtain productive capabilities. This is because countries endowed
with better human capital tend to learn and master complex production tasks faster (Zhu & Li,
2017). Hence, a more educated workforce fosters the ability to produce complex products. This
proposition has gained empirical support in several studies. Zhu and Fu (2013), for instance,
find that human capital positively affects the level of export sophistication. Hausmann et al.
(2014) also document a positive relationship between human capital and economic complexity.
Costinot (2009) develops a theoretical model illustrating that countries with better institutions
and human capital are more likely to reveal comparative advantage in complex industries.
Hence, good institutions help improve a country’s human capital, thereby enhancing economic
complexity.
Another argument for why institutions positively influence economic complexity rests
upon a well-established literature linking institutions and innovation. There is a strong
consensus in this area that good institutions provide incentives for innovative and
entrepreneurial activities (e.g., Busenitz et al., 2000; Licht & Siegel, 2006). There are many
empirical studies supporting the positive effect of institutions on innovation, mainly measured
by R&D intensity and patents (Varsakelis, 2006; Tebaldi & Elmslie, 2013; Wang, 2013).
Sweet and Maggio (2015) argue that economic complexity reflects improvements in a
country’s productive capacity. An increase in complexity, therefore, captures the extent to which an economy can create innovation through acquiring new productive capabilities to
produce sophisticated commodities. Furthermore, complexity provides information about the
ability to apply innovation in production, which is essential for economic prosperity
(Hausmann et al., 2014). In this regard, the institutional environment plays an important role
in providing incentives for acquiring new productive capabilities through which it improves
economic structure. With respect to this view, Hausmann et al. (2007) demonstrate that the
ability to export sophisticated goods critically depends on the institutional environment that
stimulates entrepreneurs to engage in innovative activities. From this reasoning, I argue that
institutional quality positively influences economic complexity via creating a conducive
environment for innovative activities.
The existing literature provides strong support for the positive influence of institutions
6
positive association between institutions and economic complexity, which is in line with the
above discussion. As far as I know, there is no empirical study linking these two variables.
Given that there is a plausible theoretical connection between institutions and complexity, it is
necessary to test the relationship between them. This paper, therefore, attends to institutional
quality as a key factor that fundamentally drives cross-country differences in economic
complexity. I suppose that two important mechanisms whereby institutions affect complexity
include human capital accumulation and providing incentives for innovative activities.
3. Empirical approach
3.1. Model specification and data2
This paper aims to test the proposition that institutions positively affect economic complexity.
To this end, I specify the following cross-country model:
𝐸𝐶𝐼𝑖 = 𝛼 + 𝛽𝐼𝑁𝑆𝑖 + 𝛾𝑋𝑖+ 𝜀𝑖 [1]
where subscript i denotes country i. 𝐸𝐶𝐼 is the Economic Complexity index, 𝐼𝑁𝑆 is the measure
of institutional quality, 𝑋 is the set of exogenous control variables, 𝜀 is the unobserved error
term. 𝛽 is the estimated coefficient of the effect of institutions on economic complexity, and is
expected to have a positive sign.
Economic Complexity
The outcome variable is the ECI, obtained from the Observatory of Economic Complexity
(https://atlas.media.mit.edu). The ECI reflects the sophistication of a country’s economic
structure. In particular, this indicator measures the availability of productive capabilities that
allow countries to produce complex products. The number of productive capabilities in a
country is dictated by information on the diversity of products it exports and the ubiquity of its
products – the number of countries exporting a product (Hidalgo & Hausmann, 2009).3 A
country has more productive capabilities if it can export a diverse range of products.
Sophisticated products, reflected in low ubiquity, are exported by only a few economies
because they require many hard-to-find capabilities.4 Combining this information by the
so-called method of reflections, Hidalgo and Hausmann (2009) construct the ECI. The intuition is
that complex economies are diverse and export products with low ubiquity. The average values
2See the online appendix for detailed information on the list of countries, variables’ definitions and data sources.
3 Hidalgo and Hausmann (2009) consider only products a country can export with revealed comparative
advantage.
4 According to Felipe et al. (2012), the most sophisticated products include machinery, chemicals, and metals
7
of the ECI, calculated over the period 2000-2010, are used in the benchmark model. I also
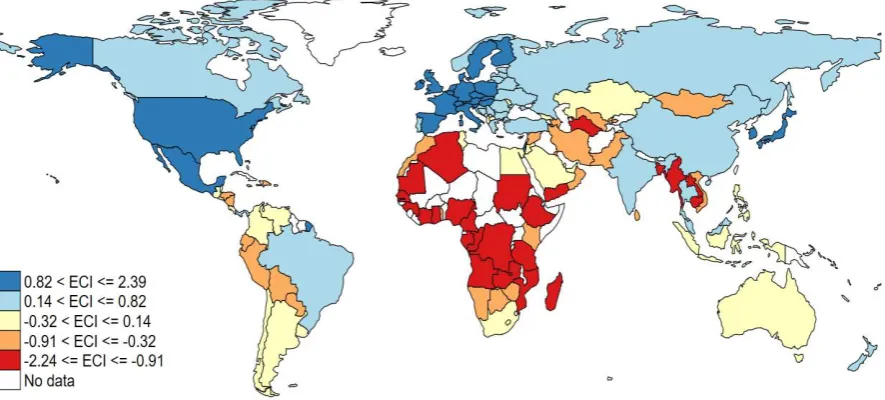
check the sensitivity of results using alternative measures of economic complexity. Figure 2
represents the cross-country variation in the ECI. Accordingly, Japan, Germany, and Sweden
are the most complex economies while the least complex economies include Nigeria, Sudan,
and Cameroon.
Economic Institutions
I employ the Economic Freedom of the World (EFW) index, published by the Canadian Fraser
Institute and the Heritage Foundation, as the baseline measure of economic institutions. This
indicator is comprised of five sub-dimensions, including protection of property rights and legal
system, size of government, freedom to trade internationally, access to sound money, and
regulation of credit, labor and businesses. Hence, it captures the extent to which the institutional
and policy environment within a country is consistent with freedom to enter markets and
compete, personal choice, voluntary exchange, and protection of privately-owned property
(Gwartney et al., 2004). The EFW index is scaled to take values between zero and one, with
higher values denoting better institutions. An advantage of using this index is that it reflects a
broad array of institutions and policies. For this reason, recent studies have employed the EFW
index to estimate the impact of institutions on income per capita (e.g., Gwartney et al., 2004;
Faria & Montesinos, 2009; Faria et al., 2016; Bennett et al., 2017). The EFW index is averaged
across the period from 2000 to 2010. It can be seen from Figure 2 that there is significant
variation in the quality of institutions across the globe. Good institutions, reflected in higher
values of the EFW index, can be observed in Switzerland, United States, and United Kingdom.
By contrast, Zimbabwe, Myanmar, Congo, and Angola suffer from much poorer institutions as
reflected in lower values of the EFW index.
Control variables
Geography has been identified as a fundamental cause of comparative development in various
studies. Some scholars argue that geography indirectly affects incomes through its effect on
motivation to work, agricultural productivity and the quality of institutions (see, for instance,
Bloom et al., 1998; Easterly & Levine, 2003; Rodrik et al., 2004). Another viewpoint asserts
that geography directly drives comparative prosperity (Sachs, 2003; Carstensen & Gundlach,
2006). Following this line of research, I select geographic conditions as controls, including
mean elevation, distance to the coast, and a landlocked dummy. Geographic conditions, such
8
and technologies that potentially affects economic complexity (Zhu & Fu, 2013). Furthermore,
countries with land areas being suitable for agriculture may specialize in less complex products
(Hausmann et al., 2007). Thus, land suitability for agriculture and the fraction of arable land,
will be used as controls. It is also necessary to check whether the estimated effect of institutions
on complexity is driven by unobserved continent-specific factors. Therefore, continent
dummies, with Oceania being excluded as the base group, are included in Eq. [1] to control for
regional heterogeneities. Additional control variables will be used for sensitivity analysis.
3.2. Estimation strategies
A major econometric issue when testing the institutional theory of comparative development
stems from the endogeneity of institutions. In particular, there exists a reverse feedback from
economic development to institutions because developed economies have better resources to
improve their institutional environment. The endogeneity bias may also be caused by
unobserved country-specific factors that we cannot rule out in a cross-country framework.
Furthermore, institutions may be subject to measurement errors. These problems make OLS
estimates biased and inconsistent.
For these reasons, obtaining consistent estimates of the effect of institutions on economic
complexity requires finding an exogenous source of variation in institutions. In this regard, the
“germs” theory of institutions, proposed by Acemoglu et al. (2001), is the most influential view. The authors employ the settler mortality rate as the instrumental variable for institutions.
Their main argument is that Europeans adopted different colonization strategies depending on
the disease environment of former colonies. Specifically, they established high-quality
institutions in countries where the disease environment was favorable for settlement. By
contrast, extractive institutions were set up in places where Europeans faced a higher risk of
dying from disease. Although the settler mortality rate has been widely used as the instrument
for institutions in subsequent studies, it is not free from criticism. First, Glaeser et al. (2004)
find that the disease environment is more highly correlated with human capital than with
institutions. They demonstrate that the historical event of European colonization matters for
economic growth by affecting human capital and technology, and not by affecting institutions
(Easterly & Levine, 2016). Second, Albouy (2012) shows that the settler mortality index suffers
from a severe measurement issue, which raises some concerns about the validity of this
instrument. Finally, data on settler mortality are only available for 64 former colonies (Albouy,
9
Given these limitations, this paper employs the intensity of ultraviolet radiation (UV-R)
as an alternative instrument for institutions. This indicator is constructed by Andersen et al.
(2016), using daily satellite-based data for ambient UV-R from NASA. A recent study by Ang
et al. (2018) examines the role of the UV-R in explaining cross-country variations in
institutional quality. The intuition is that countries with high UV-R intensity face a higher risk
of eye diseases, for example, cataracts, which are the leading cause of blindness (Ang et al.,
2018).5 Based on this mechanism, Ang et al. (2018) contend that the long-lasting threat of eye
diseases caused by the intensity of UV-R negatively affects a country’s motivations to invest
in cooperation by building institutions. Furthermore, the risk of becoming blind acts as a barrier
to investments in skills and technologies, which impedes the ability to accumulate a food
surplus. This, in turn, is detrimental to specialized activities such as institution building, which
require a food surplus. In other words, the negative effect of blindness on investments in skills
and technologies is associated with fewer people specialized in law-creation activities. The
UV-R, ultimately, deters skills and experience with establishing and maintaining institutions
(Ang et al., 2018). Using data for more than 120 countries, Ang et al. (2018) find that UV-R is
a strong and robust predictor of institutional quality.6
Motivated by their findings, this paper employs UV-R as a potential instrument for
institutions. However, I do recognize that the “germ” theory of institutions is an influential
viewpoint in this literature. It is also important to note that the aim of this paper is not to
compare the relative importance of the effect of the settler mortality rate and the UV-R on
institutions. Nevertheless, a salient advantage of using the UV-R is that it does not impose
further constraints on the sample size. Findings, therefore, may suggest a generalized pattern
between institutions and economic complexity across a large number of countries. Later, I also
perform a sensitivity test by using settler mortality as an instrument for institutions.
4. Results and discussions
4.1. IV-2SLS estimates
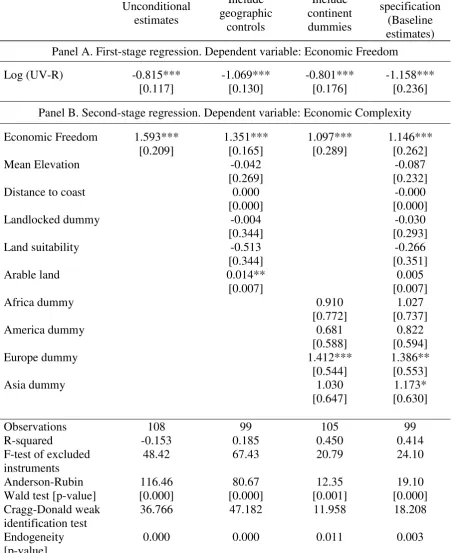
Baseline estimates are reported in Table 1. Specifically, Panel A shows the results of the
first-stage regression while the second-first-stage estimation results are shown in Panel B.
5 As noted by Ang et al. (2018), previous research has documented a positive association between UV-R and eye
diseases (see, for instance, Gallagher & Lee, 2006; Linetsky et al., 2014; Löfgren, 2017).
6 To be a valid instrument for institutions, the UV-R also needs to satisfy the exclusion restrictions. This will be
10
Column (1) of Table 1 presents the unconditional estimates in which no control variables
are included. The estimated coefficient of UV-R is statistically significant at the 1% level. This
indicates that the UV-R is negatively correlated with the quality of institutions. This finding is
consistent with the hypothesis of Ang et al. (2018) that countries with higher UV-R will suffer
from poorer institutions. It also supports the relevance of the UV-R as the instrument for
institutions. The second-stage estimates demonstrate that the estimated coefficient of the EFW
index is positive and statistically significant at the 1% level. This shows that the exogenous
component of institutions, generated by the UV-R, positively affects the ECI.
Geographic controls are added to the second column of Table 1. All geographic variables,
except the fraction of arable land, are statistically insignificant at conventionally accepted
levels. The p-value of the F-test of joint significance of those variables is 0.323. Hence, we fail
to reject that the estimated coefficients of geographic endowments are jointly indistinguishable
from zero. This indicates that geographic conditions, except arable land, are not shown to have
a statistically significant effect on ECI. Furthermore, this result provides evidence that
institutions are an important driver of cross-country differences in ECI. Controlling for
geographic endowments yields a slight decrease in the size of the effect of institutions on ECI.
However, the effect of institutions on ECI is still precisely estimated. Results remained largely
unchanged when continent dummies are included in the regression, as shown in column (3) of
Table 1. All variables are added in column (4) of Table 1, which does not alter the main
findings. Overall, the positive significant effect of institutions on ECI is robust to controlling
for geography and continent heterogeneities.
The size of the estimated coefficients suggests that institutions exert a substantial effect
on the ECI. For example, the EFW index of Thailand and Japan is 6.71 and 7.72, respectively.
The difference between these two countries equals to 1.01, which is approximately one
standard deviation of the EFW index in the sample (see Table A1 in the online appendix).
According to the estimated coefficients in column (4) of Table 1, a one-unit increase in the
exogenous source of variation in institutions, generated by the UV-R, implies a 1.146-unit
increase in the ECI. Thus, if Thailand instead experienced a level of the EFW index similar to
Japan, the expected increase in the ECI of Thailand would be 1.157 units, which is
approximately 2.5 times its initial ECI value (0.482), a substantial increase.
A number of diagnostic tests are also reported in Table 1. First, the endogeneity test of
Hausman (1978) indicates that we can reject the null of exogeneity of institutions at the 1%
11
exogenous in the ECI equation, which motivates the use of the instrumental variable. Second,
the value of the Sanderson and Windmeijer (2016) F-test for the excluded instrument is bigger
than the rule-of-thumb value of 10 in all cases, which implies that UV-R is not a weak
instrument. Third, I perform the test of robust inference with weak instruments of Anderson
and Rubin (1949). The low p-value indicates that we can reject the null hypothesis that the
coefficient of the endogenous variable is zero at the 1% level. This implies that the effect of
institutions on ECI is robust even in the presence of a weak instrument. Finally, I conduct the
test of weak instruments of Cragg and Donald (1993). The high values obtained in all cases
reveal that we can reject the null hypothesis that UV-R is weakly correlated with institutions.
4.2. Potential violation of the exclusion restriction
To my knowledge, there is no study linking UV-R and ECI. However, we cannot rule out the
possibility that UV-R may exert a direct effect on ECI other than through its influence on
institutions. If this channel of causation exists, the exclusion restriction is violated, invalidating
the IV-2SLS estimates. In particular, the intensity of UV-R may affect productivity through
shaping the disease environment and the motivation to work (Andersen et al., 2016). Thus,
UV-R may exert a direct impact on income levels. Because economic complexity and GDP per
capita are highly correlated, UV-R may also have some slight influence on complexity through
disease ecology. To minimize the violation of the exclusion restriction, I control for additional
geographic endowments, including latitude and malaria (Table 7). The baseline estimates are
robust to this consideration.
Importantly, GDP per capita and complexity are not perfectly correlated. For instance,
Chile and Malaysia have the same level of income but Malaysia’s ECI is much higher than that
of Chile (Hartmann et al., 2017). This ultimately helps explain why Malaysia enjoys a better
distribution of income (low inequality) compared with Chile (Hartmann et al., 2017).
Moreover, Australia has a relatively low ECI despite its high level of income (Hartmann et al.,
2017). Although UV-R may directly affect income, its effect on complexity is much less
clear-cut. Nevertheless, there may exist other channels through which UV-R affects complexity that
I do not account for in the regression. For this reason, I perform the plausibly exogenous bounds
test, proposed by Conley et al. (2012), to check the sensitivity of the baseline findings to partial
deviations from the perfect exogeneity assumption.
As argued by Owen (2017), the validity of instruments used in the determinants of
12
assumption. Conley et al. (2012) contend that the exclusion restriction is often debatable
because the disturbance term is unobserved. Motivated by this challenge, Conley et al. (2012)
develop the method of union of confidence intervals (UCI) that allows us to calculate upper
and lower bounds of the effect of institutions on ECI when the instrument (UV-R) partially
deviates from the assumption of perfect exogeneity. This approach can be demonstrated in the
following equation:
𝑌 = 𝛽𝑋 + 𝛾𝑍 + 𝜀
where 𝑌 is the outcome variable (ECI), 𝑋 is the endogenous regressor (EFW), 𝑍 is the
instrumental variable (UV-R), and 𝜀 is the disturbance term. The exclusion restriction
conventionally requires 𝛾 = 0, which means that UV-R exerts no direct effect on ECI other
than via its influence on institutions. Following the approach of Conley et al. (2012), this
assumption is assumed to be partially violated. In particular, 𝛾 is assumed to be different from
zero, taking some values in a given interval (𝛾 ∈ [−𝛿; +𝛿]). Hence, we can estimate the
confidence interval bounds of 𝛽, associated with each value of 𝛾. 𝛿 is the estimated coefficient
of the direct effect of UV-R on ECI in the above equation.
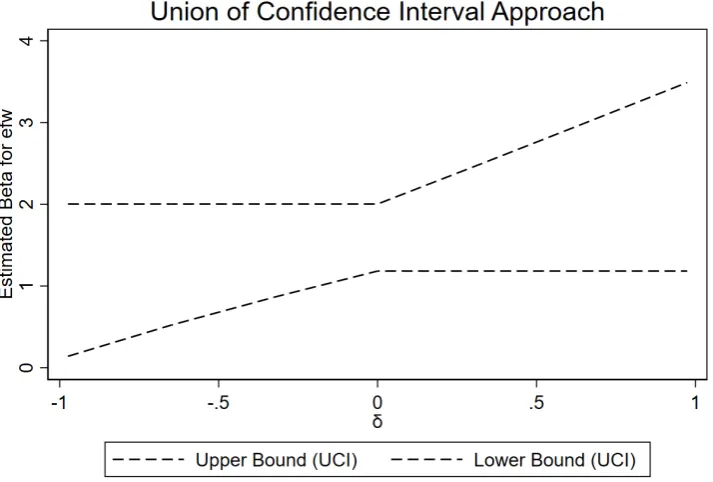
Estimation results are presented in Table 2. Accordingly, the estimated effect of
institutions on ECI is well above zero when the perfect exogeneity assumption is partially
relaxed. The 95% confidence intervals for 𝛽, associated with different values of 𝛾, are
illustrated in Figure 2. Accordingly, none of those confidence intervals includes zero. Hence,
the causal effect of institutions on economic complexity is consistently significant when 𝛾
deviates from zero. This suggests that the baseline findings are insensitive to potentially
violating the exclusion restriction, suggesting that the UV-R is “plausibly exogenous” (Conley
et al., 2012).
To further check for the sensitivity of the baseline findings to violating the exclusion
restriction, I conduct the fractionally resampled Anderson-Rubin test, following Berkowitz et
al. (2012). In particular, Berkowitz et al. (2012) demonstrate that the Anderson-Rubin test
over-rejects the null hypothesis of no effect of institutions on ECI when there is a minor deviation
from the exogeneity assumption. To address this concern, the authors modify the AR test but
allow for a slight violation of the exogeneity condition. More specifically, Berkowitz et al.
(2012) construct the fractionally resampled Anderson-Rubin (FAR) test, based on the jackknife
13
when the instrument is not perfectly exogenous. According to results in Table 3, we can reject
the null hypothesis of no effect of institutional quality on ECI at the 1% level of significance.
Overall, the UCI and FAR test results suggest that we can draw valid inference on the
effect of institutions on ECI even when the orthogonality condition is slightly violated. This
provides empirical support to the hypothesis that institutional quality positively affects ECI.
4.3. Using an alternative instrument for institutions
The discussion above supports the validity of the UV-R as the instrument for institutions. The
results are also insensitive to some degree of deviation from the exclusion restriction. This
section further explores whether the baseline findings are driven by the choice of instrument.
To this end, I employ the log of settler mortality rate of Acemoglu et al. (2001) as an alternative
instrument for institutions. Estimation results are represented in column (1) of Table 4. The
first-stage estimates indicate that the settler mortality rate is negatively correlated with
institutions. The estimated coefficient of the mortality rate is statistically significant at the 5%
level. This is consistent with the “germ” theory of institutions of Acemoglu et al. (2001). Turning to the second-stage estimates, the effect of institutions is still positive and statistically
significant at the 1% level. However, the value of the Sanderson-Windmeijer F-test of excluded
instruments and the Cragg and Donald (1993) test of weak instruments is smaller than the
rule-of-thumb value of 10. This suggests that the mortality rate is weakly correlated with
institutions, measured by the EFW index. However, the quantitative aspect of the baseline
estimates remains broadly unchanged even when the instrument is just weakly correlated with
institutions.
The sample size, however, decreases significantly when the settler mortality rate is used.
For this reason, I re-estimate the baseline regression for the sub-sample of countries whose data
on the mortality rate are available. This allows comparing the baseline estimates with those in
column (1) of Table 4 more precisely. As shown in column (2), the UV-R is strongly correlated
with institutions. This justifies the relevance of the benchmark instrument even for a much
smaller sample of former colonies. Furthermore, the impact of institutions on ECI remains
precisely estimated. Hence, the baseline results are robust to the choice of instruments for
institutions. Next, I use both instruments in column (3) to partially test for the validity of the
exclusion restriction. Results indicate that we fail to reject the null hypothesis that the
instruments are valid at conventionally accepted levels of significance. This partially provides
14
variables are highly correlated. Thus, including them in one regression may mask the effect of
each variable on the quality of institutions in the first-stage regression, thereby causing a weak
instruments problem. Nevertheless, the second-stage results in column (3) are quantitatively
similar to the baseline estimates.
5. Robustness tests
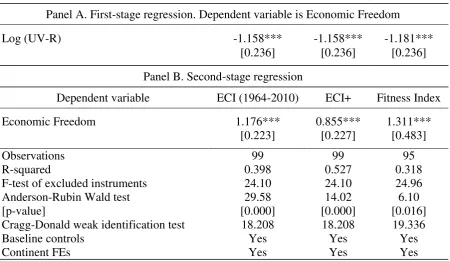
5.1. Using other measures of Economic Complexity and institutions
To check the sensitivity of the baseline estimates, I employ other measures of economic
complexity. First, I have used the ECI values calculated over the period 2000-2010 in the
benchmark model. The results, therefore, may reflect the short-run relationship between ECI
and institutions. Hence, it is necessary to check the sensitivity of the estimates using an
alternative period. To do this, I use the ECI values, averaged over the period from 1964 to 2010
for which data are available, as shown in column (1) of Table 5. Second, I employ the improved
ECI index (ECI+), constructed by Albeaik et al. (2017), in column (2) of Table 5. Albeaik et
al. (2017) apply the method of reflections of Hidalgo and Hausmann (2009) to construct the
ECI+ measure, but they take into consideration how difficult it is to export each product. This
indicator is also available from the Observatory of Economic Complexity. Finally, I adopt the
Economic Fitness index, developed by Tacchella et al. (2012), in column (3) of Table 5. This
indicator, obtained from the World Bank’s World Development Indicators, also reflects a
country’s ability to export sophisticated products. As shown in Table 5, the estimated effect of institutions on economic complexity remains statistically significant at the 1% level, which is
consistent with the baseline findings.
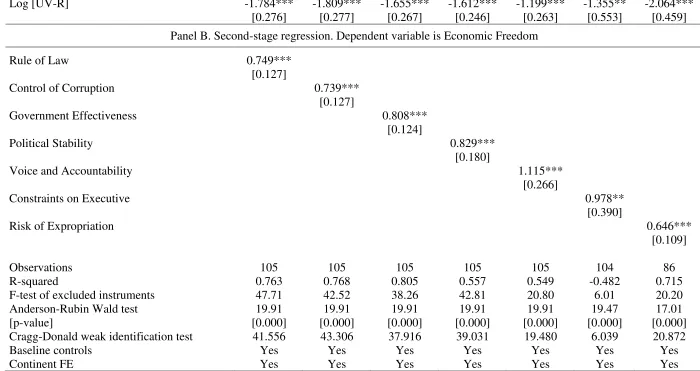
As argued earlier, the EFW index reflects a cluster of institutions and policies that
provide a more comprehensive understanding of institutions. Specifically, the fact that
institutions are often equated with security of property rights is too narrow (Glaeser et al.,
2004). Furthermore, the EFW index may be more informative for policy-makers than the
unidimensional measures of institutions (e.g., constraints on the executive, rule of law, or risk
of expropriation) as highlighted by Faria et al. (2016) and Bennett et al. (2017). However, I
re-estimate the benchmark model, using the commonly used measures of institutions to check the
robustness of the core estimates. Results reported in Table 6 indicate that the positive effect of
institutions on ECI is largely insensitive to this consideration.
5.2. Controlling for other effects
15
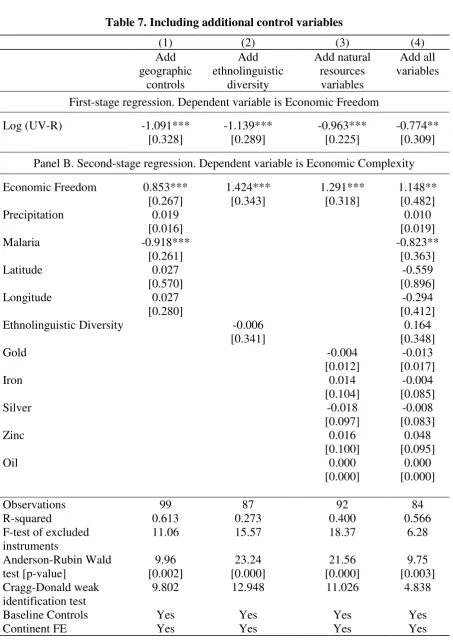
First, I include additional covariates as shown in Table 7. In particular, additional
geographic controls are added to the first column, including precipitation, latitude, longitude,
and the fraction of the population at risk of contracting malaria. Those variables, except
malaria, are individually insignificant at conventionally accepted levels. Furthermore, the
inclusion of those controls does not quantitatively alter the baseline findings. Next, I control
for the effect of ethno-linguistic fractionalization, obtained from La Porta et al. (1999). Ethnic
and linguistic diversity has been shown to affect several development outcomes, including
institutions (Alesina et al., 2003). Ethnolinguistically diversified countries may benefit from
the diversity of ideas, thus strengthening the ECI. The empirical findings, therefore, can be
biased if we fail to consider this effect. As shown in column (2), the estimated effect of
institutions on the ECI is still highly precise. Next, the third column adds a country’s world
share of natural resource reserves (e.g., gold, iron, silver, zinc, and oil), obtained from
Acemoglu et al. (2001). There is a line of research arguing that natural resources are essential
inputs of industrial upgrading (Zhu & Fu, 2013). Other studies contend that they are harmful
to institutions and economic growth, which is often referred to as the resource curse (e.g., Van
der Ploeg, 2011). The estimated coefficient of institutions, however, is still significant at the
1% level after controlling for the effect of natural resources. The baseline estimates also prevail
after all those variables are added to column (4).
Second, the long-term comparative development literature has identified several early
development factors as drivers of economic performance. The core results may be biased if we
do not properly control for those factors. For example, the historical experience with state-level
institutions may affect both the quality of institutions and the outcome variable (e.g., Bockstette
et al., 2002; Putterman & Weil, 2010; Ang, 2013; Borcan et al., 2018). I control for this effect
using the measure of state antiquity of Borcan et al. (2018), calculated from 3500BCE to
2000CE. Additionally, the legal origins theory of finance, proposed by La Porta et al. (1998),
argues that common-law countries with better security of property rights are more financially
developed than civil-law counterparts. Legal origins are also found to affect the quality of
institutions (La Porta et al., 1999), and they may exert some influence on the ECI. For this
reason, the second column of Table 8 adds dummies representing legal origins from Klerman
et al. (2011), with a civil-law dummy being excluded as the base category.7 There is another
7 Here, I follow the legal origins classification of Klerman et al. (2011), which is largely similar to that of La Porta
16
argument that the timing of agricultural transition, beginning 10,000 years ago, helps explain
comparative prosperity (Hibbs & Olsson, 2004). I account for this effect, using Putterman’s
(2006) dataset of the length of time elapsed since the Neolithic revolution. As also highlighted
by Spolaore and Wacziarg (2009), genetic distance from the technology frontier is harmful to
economic performance because it acts as a barrier to knowledge and technology diffusion.
Similarly, genetic diversity has a hump-shaped relationship with income levels, as suggested
by Ashraf and Galor (2013). The results can be biased if genetic characteristics are correlated
with both institutions and ECI. Thus, genetic variables are added to column (4) and (5) of Table
8. Those historical variables are highly correlated because they capture different aspects of
early development. Hence, I do not include all of them into one regression. Estimation results
in Table 8 indicate that the coefficients of institutions remain precisely estimated after
accounting for those historical confounders.
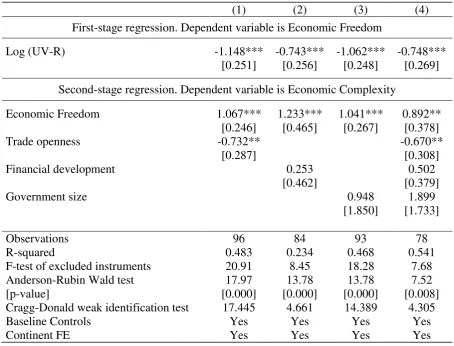
Finally, Table 9 includes some “proximate” determinants of ECI.8 Specifically, trade
openness may facilitate the dissemination of knowledge across countries, thus enhancing the
ability to produce sophisticated products (Zhu & Fu, 2013). The level of financial development,
measured by domestic credit to the private sector as a percentage of GDP, may affect industrial
upgrading via providing resources for innovation (Wang, 2013). In addition, government
spending may positively affect ECI through providing public goods such as education, legal
systems, and public order, as suggested by Sweet and Maggio (2015). I take the averaged data
for those variables over the preceding decade (1990-1999) to mitigate bias caused by reverse
causality. It is important to note that institutions are different from those “proximate”
determinants of ECI in the sense that they provides a deeper understanding of cross-country
differences in complexity. Hence, studies examining the fundamental determinants of
comparative prosperity have generally excluded the “proximate” determinants because they
may capture some of the effect of institutions on economic performance (see, for instance,
Acemoglu et al., 2001; Acemoglu et al., 2005; Knowles & Owen, 2010; Acemoglu et al.,
2014). However, the baseline estimates are largely insensitive to including those variables.9
8 Acemoglu et al. (2005) argue that human capital, physical capital, and innovation are proximate determinants of
economic growth because they require further explanation. By contrast, institutions, among others, are considered
as “deep” determinants because they offer a more fundamental explanation of comparative prosperity.
9 The quality of human capital and innovation are also potential “proximate” determinants of the ECI. As discussed
17
5.3. Panel data estimates
The major objective of this paper is to explore the role of institutions in explaining the
cross-country variation in ECI. Hence, setting up a cross-cross-country regression is relevant for the current
study, given that this paper aims to investigate the long-term relationship between institutions
and ECI. Furthermore, most of the geographic controls and the instrumental variable used in
the benchmark model are relatively stable over time. Hence, the cross-sectional regression that
utilizes averaged data over time allows us to capture the long-run relationship between ECI
and the quality of institutions.
For these reasons, estimating cross-sectional regressions is a conventional approach in
the comparative development literature.10 However, I recognize that we cannot properly control
for the effect of unobserved country-specific factors in a cross-sectional framework. In this
regard, cross-country estimates may yield a spurious relationship between institutional quality
and ECI if the unobserved country-specific characteristics are correlated with both these
variables. To test this possibility, this paper estimates a dynamic panel data including
non-overlapping 5-year periods from 1970 to 2010, using the system GMM estimator of Blundell
and Bond (1998).11 The model is specified as follows:
𝐸𝐶𝐼𝑖,𝑡 = 𝛼 + 𝛿𝐸𝐶𝐼𝑖,𝑡−1+ 𝛽𝐼𝑁𝑆𝑖,𝑡+ 𝛾𝑋𝑖,𝑡+ 𝜀𝑖 + 𝜇𝑡 [2]
where subscripts i and t stand for country i and period t, respectively. 𝐸𝐶𝐼 is the Economic
Complexity Index. 𝐼𝑁𝑆 denotes institutions, measured by the EFW index. 𝑋 is a set of control
variables, including trade openness, the fraction of arable land in total land area, the level of
financial development, and government spending. The choice of those controls is discussed
earlier, and they are similar to the proximate determinants included in Table 9. The baseline
controls, except arable land, are invariant, and are therefore excluded in Eq. [2]. The
time-period is mainly dictated by the availability of data. 𝜀 and 𝜇 reflect unobserved country- and
time-specific factors, respectively.
Estimating Eq. [2], using the system GMM estimator, helps solve several econometric
issues. First, the first-differenced equations, besides the level equations, control for the effect
of country-specific characteristics. Second, the lagged dependent variable accounts for the
dynamic characteristics of the ECI (Sweet & Maggio, 2015). Third, the instrument used in the
10 See Owen (2017) for an extensive review about econometric methods used in this literature.
11 Previous research investigating the determinants of economic growth has popularly used panel data including
18
benchmark model is not applicable in this context because it is time-invariant. Hence, I use
lags of endogenous regressors as the valid instruments, following Blundell and Bond (1998).
A major issue of using this approach is the problem of instrument proliferation, as highlighted
by Roodman (2009). To deal with this problem, this paper collapses the instrument set and uses
specific lags as instruments, following Roodman (2009).12
The system GMM estimates that potentially cater for the endogeneity bias are presented
in Table 10.13 The consistency of these estimates, however, critically depends on some
diagnostic tests. As suggested by Roodman (2009), the number of instruments should be ideally
less than the number of cross-sectional units, which is the number of countries in this context.
In addition, the validity of the instruments is checked by performing autocorrelation tests. The
high p-values of the AR(2) test support evidence of the absence of second-order serial
correlation in the error term, justifying the validity of the instruments (Arellano & Bond, 1991).
The results of the Hansen tests of over-identifying restrictions are reported to check whether
the instruments satisfy the exclusion restriction. Accordingly, we fail to reject the null of
exogeneity of the instruments, which provides some evidence for the validity of the internal
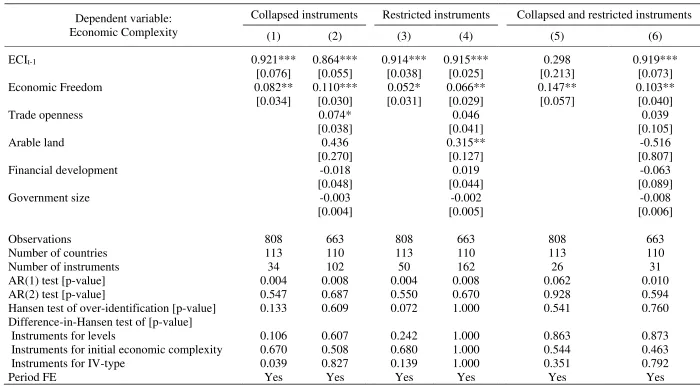
instruments used in both the difference and level equations. I collapse the instrument in column
(1) and (2). The effect of institutions on ECI is positive and statistically significant at the 1%
level. However, the number of instruments, shown in column (2), is very close to the number
of countries, which may bias the results. Next, I restrict the instrument set by using the second-
and the third-order lags.14 The baseline estimates remain unchanged, but the problem of
instrument proliferation remains unresolved (column 2-3). Hence, I restrict the instrument set
by both collapsing and using specific lags in column (5) and (6). Then, the number of
instruments is much smaller than the number of countries.
According to results shown in Table 10, the estimated coefficients of the lagged ECI is
positive and statistically significant at the 1% level, except in column (5). This justifies the use
of a dynamic panel data specification. It also suggests that ECI is path-dependent, implicating
12 See Roodman (2009) for discussions on collapsing the set of instruments. This is done via specifying the suffix
“collapse” and/or the specific number of lags in the STATA command “xtabond2”. All variables in the right-hand
side of Eq. [2] are treated as endogenous regressors, thus need to be instrumented by their lags.
13 Before discussing the system GMM estimates, I estimate Eq. [2] but exclude the lagged dependent variable,
using fixed-effects and pooled OLS regression. Results reported in Table A4 in the online appendix show that institutions have a positive significant effect on economic complexity in all cases. This is consistent with the baseline findings. These results, however, do not necessarily reflect causation due to some concerns about endogeneity bias.
14 Results remain quantitatively unchanged, but the number of instruments keeps growing significantly when
19
that countries with an initial high level of ECI are able to produce more sophisticated products
in the future. This notion is consistent with the findings of Hausmann and Rodrik (2003),
Hausmann et al. (2007), Hidalgo et al. (2007) and Hidalgo and Hausmann (2009). Moreover,
the effect of institutions on the ECI is still precisely estimated at the 5% level of significance.
Hence, pooling data across time does not alter the baseline findings.
The results, however, may be inconsistent if the instruments are weakly correlated with
the endogenous variables even in large samples. Using the internal instruments does not allow
us to perform some conventional diagnostics tests of instrument strength as discussed in the
baseline estimates (Berg et al., 2018).15 Furthermore, the instrument set, albeit being kept
smaller than the number of countries, is still relatively large (e.g., 31 instruments are used in
column 6 of Table 10). Although the system GMM estimates allow us to control for the
unobserved country-specific characteristics, I argue that the cross-sectional estimates, using an
exogenous instrumental variable, are more informative when exploring the long-run
relationship between ECI and institutions. In particular, the system GMM estimator comprises
of a set of regressions in differences and in levels. Taking first-difference removes the
cross-country variation in both ECI and institutions, which is the main interest of this study.
Furthermore, the cross-sectional regression is more informative about the long-run relationship
than the system GMM estimates, given that we have a relatively short time-series dimension.
For these reasons, I maintain the use of the baseline estimates to draw inference on the causal
relationship between institutions and ECI.
5.4. Additional robustness tests
Results of some additional sensitivity tests are reported in the online appendix.
First, I check whether the baseline results are robust to allowing for a potential non-linear
relationship between complexity and institutions. To this end, I perform the Ramsey RESET
test of functional form misspecification, using estimates in column (4) of Table 1. Results
shown in Table A5 indicate that we fail to reject the null of correct functional form specification
of the baseline estimates, which is supportive of a linear relationship. Next, I further check
potential nonlinearities by performing a non-parametric estimation using Kernel-weighted
local polynomial smoothing. As shown in Figure A1, we hardly find any evidence of a
15 Berg et al. (2018) point out that the system GMM estimator has gained popularity in the growth determinants
20
nonlinear correlation between institutions and complexity, except for a few outliers at the upper
and lower bound of economic freedom. I further test for nonlinearity by allowing institutions
to enter the benchmark model in a quadratic form. Results presented in Table A6 do not support
the quadratic relationship between institutions and complexity. Thus, the baseline estimates are
insensitive to checking for nonlinearities.
Second, I investigate the sensitivity of the baseline results to excluding some influential
observations in Table A7. Specifically, I re-estimate column (4) of Table 1 but exclude
countries whose standardized residuals are larger than 1.96 or smaller than -1.96. I also remove
countries with a Cook’s distance bigger than the conventional value calculated by four over the
number of observations. In addition, I conduct robust regressions, following Li (1985). In all
cases, the quantitative aspect of the baseline findings remains largely unchanged.16
6. Transmission channels
This paper hypothesizes that institutions exert a positive influence on ECI via enhancing human
capital accumulation and providing incentives for innovative activities. This section, therefore,
tests these mechanisms by controlling for the measure of human capital and innovation in the
benchmark model. The effect of institutions on ECI may be less precisely estimated or become
statistically insignificant when I account for the mediating channels of influence.17 In
particular, this paper employs the cognitive skills measure of human capital used by Hanushek
and Woessmann (2012a). The reason behind this is that cognitive skills are a stronger predictor
of cross-country differences in economic growth compared to years of schooling (Hanushek &
Woessmann, 2008, 2012a, 2012b).18 Furthermore, I use the percentage of R&D expenditure in
GDP as the proxy for innovative activities.19 Data are taken in 2000 to minimize the
endogeneity bias due to reverse causality.20 I also estimate the effect of institutions on the
transmission channels.
Estimation results are shown in Table 11. They indicate that the quality of institutions
positively affects human capital and innovative activities (column 1 and 3). In particular, the
16 Australia is an interesting outlier with good institutional quality and a low level of the ECI. This requires further
investigation in future research, which will be discussed in Section 7.
17This explains why “proximate” determinants of economic performance (e.g., human capital, physical capital,
and technology) are not included as controls in the fundamental determinants literature (see, e.g., Acemoglu et al., 2001; Acemoglu et al., 2005; Knowles & Owen, 2010; Acemoglu et al., 2014).
18 As Hanushek and Woessmann (2012a) note “a year of schooling in Peru is assumed to create the same increase
in productive human capital as a year of schooling in Japan.”
21
estimated effect of institutions on human capital accumulation and innovation is positive and
statistically significant at the 1% level. This finding is in line with the arguments in Section 2.
As represented in column (2) and (4), the effect of institutions on ECI is less precisely estimated
once I control for human capital and innovation. Furthermore, the size of the effect decreases
considerably, relative to the baseline estimates. In contrast, the effect of human capital and
innovation on ECI is statistically significant at the 1% level (column 2 and 4). These results
suggest that institutions affect ECI via its influence on human capital and innovation, which is
supportive of the main hypotheses discussed in Section 2.
Using the estimates in Table 11, I further conduct the mediation tests of MacKinnon et
al. (1995) to test the transmission channels. Results are shown in Table 12. The null hypothesis
of the mediation tests is that the indirect effect of institutions, working through human capital
and innovation, equals zero. The test results indicate that we can reject the null hypothesis in
all cases at the 5% level of significance (Table 12). This suggests that human capital and
innovation are two important channels through which institutions positively affect ECI.
7. Conclusion
A recent line of research focuses on economic complexity, a measure of a country’s productive
structure, as a strong predictor of comparative prosperity across the globe. However, much less
is known about the root causes of complexity. This paper, therefore, goes beyond the current
literature by examining the extent to which institutions help explain cross-country differences
in economic complexity. For this purpose, I employ the EFW index as the proxy for
institutions. This indicator reflects a cluster of institutions and policies, which offers a more
comprehensive coverage of the institutional environment. I posit that institutions act as a
catalyst for human capital accumulation and innovative activities, thus enhancing complexity.
This study employs cross-sectional data for 108 countries to test the above proposition.
To address endogeneity concerns, I use the ultraviolet radiation (UV-R) index of Andersen et
al. (2016) to isolate the exogenous variation in institutions. Results are consistent with the
findings of Ang et al. (2018) that UV-R is strongly correlated with cross-country differences
in institutions. In addition, I find that the exogenous component of variation in institutions,
generated by UV-R, exerts a strong and positive effect on economic complexity. Using the UCI
method of Conley et al. (2012), I find that this finding is largely insensitive to partially
deviating from the exclusion restriction. The fractionally Anderson-Rubin test results also
22
exogeneity assumption is slightly violated (Berkowitz et al., 2012). Moreover, the baseline
findings are robust to using the conventional settler mortality instrument for institutions of
Acemoglu et al. (2001). To further check the sensitivity of the baseline estimates, I conduct
several robustness tests, including using other measures of institutions and complexity and
controlling for additional covariates. The effect of institutions on ECI remains very precisely
estimated after performing these tests. Furthermore, I estimate a dynamic panel data, using the
system GMM estimator that accounts for unobserved country- and time-specific factors and
the endogeneity bias. The baseline estimates are broadly insensitive to this consideration.
The empirical findings of this paper offer several implications. First, future studies
examining the link between economic complexity and economic performance should take into
consideration the effect of institutions on complexity. Given that the literature on economic
complexity is relatively thin but growing quickly, this paper provides some suggestions about
the choice of control variables for subsequent studies. Second, this paper is the first study that
employs UV-R as an instrumental variable for institutions to overcome the endogeneity bias.
This lends empirical credence to the new institutional theory of sunlight, proposed by Ang et
al. (2018). In particular, countries with high intensity of UV-R will have less motivation to
invest in institutional building, thereby suffering from poor institutions. Future research can
also employ this potential instrument for institutions without limiting the sample size to former
colonies as when using other conventional instruments (e.g., legal origins and the log of settler
mortality).
Third, this study establishes a link between institutions and economic complexity across
countries. However, there are significant variations in the quality of institutions and economic
complexity across regions within a country. Subsequent studies, therefore, may focus on a
single country to explore the link between subnational institutions and the ECI. Besides the
cross-country data on economic complexity, the Observatory of Economic Complexity also
provides the Product Complexity index at a highly disaggregated level. Thus, a potential
avenue for future research is to investigate the link between subnational institutions and firms’
capacity to produce and export sophisticated products. This micro-level approach may provide
promising policy implications. Finally, this study sheds some light on the channels through
which institutions affect economic complexity, including human capital and innovation.
Hence, the effect of institutions on the ECI can be magnified by these mechanisms. This implies
that policies aiming to improve the institutional environment, the quality of human capital, and
23
The final thought of this paper is that exploring the relationship between economic
complexity and institutions in Australia would be an interesting extension to the current
research. As illustrated in Figure 2, Australia experiences an intermediate level of economic
complexity. Part of the reason for this is that natural resources constitute a considerable
proportion of its exports (Hartmann et al., 2017). In addition, Hartmann et al. (2017) argue that
the measure of economic complexity of Hidalgo and Hausmann (2009) may underestimate the
actual level of complexity in Australia. By contrast, Australia managed to establish a good
institutional environment over the past decades, being among the freest economies in the world
today (Figure 3). This can be partially explained by the effect of the massive migration of
Europeans, beginning in the sixteenth century, as found by Acemoglu et al. (2001). For these
24
References
Acemoglu, D., Gallego, F. A., & Robinson, J. A. (2014). Institutions, Human Capital, and Development. Annual Review of Economics, 6(1), 875-912.
Acemoglu, D., & Johnson, S. (2005). Unbundling Institutions. Journal of Political Economy, 113(5), 949-995.
Acemoglu, D., Johnson, S., & Robinson, J. A. (2001). The Colonial Origins of Comparative Development: An Empirical Investigation. American Economic Review, 91(5), 1369-1401.
Acemoglu, D., Johnson, S., & Robinson, J. A. (2005). Institutions as a Fundamental Cause of Long-Run Growth. In P. Aghion & S. N. Durlauf (Eds.), Handbook of Economic Growth (Vol. 1, pp. 385-472): Elsevier.
Albeaik, S., Kaltenberg, M., Alsaleh, M., & Hidalgo, C. A. (2017). Improving the Economic Complexity Index. arXiv preprint arXiv:1707.05826.
Albouy, D. Y. (2012). The Colonial Origins of Comparative Development: An Empirical Investigation: Comment. American Economic Review, 102(6), 3059-3076.
Alesina, A., Devleeschauwer, A., Easterly, W., Kurlat, S., & Wacziarg, R. (2003). Fractionalization. Journal of Economic Growth, 8(2), 155-194.
Andersen, T. B., Dalgaard, C.-J., & Selaya, P. (2016). Climate and the Emergence of Global Income Differences. Review of Economic Studies, 83(4), 1334-1363.
Anderson, T. W., & Rubin, H. (1949). Estimation of the Parameters of a Single Equation in a Complete System of Stochastic Equations. Annals of Mathematical Statistics, 20(1), 46-63.
Ang, J. B. (2013). Institutions and the Long-Run Impact of Early Development. Journal of Development Economics, 105, 1-18.
Ang, J. B., Fredriksson, P. G., Nurhakim, A. L. b., & Tay, E. H. (2018). Sunlight, Disease, and Institutions. Kyklos, 71(3), 374-401.
Arellano, M., & Bond, S. (1991). Some Tests of Specification for Panel Data: Monte Carlo Evidence and an Application to Employment Equations. Review of Economic Studies, 58(2), 277-297.
Ashraf, Q., & Galor, O. (2013). The 'Out of Africa' Hypothesis, Human Genetic Diversity, and Comparative Economic Development. American Economic Review, 103(1), 1-46. Bennett, D. L., Faria, H. J., Gwartney, J. D., & Morales, D. R. (2017). Economic Institutions
and Comparative Economic Development: A Post-Colonial Perspective. World Development, 96, 503-519.
Berg, A., Ostry, J. D., Tsangarides, C. G., & Yakhshilikov, Y. (2018). Redistribution, Inequality, and Growth: New Evidence. Journal of Economic Growth, 23(3), 259-305. Berkowitz, D., Caner, M., & Fang, Y. (2012). The Validity of Instruments Revisited. Journal
of Econometrics, 166(2), 255-266.
Bloom, D. E., Sachs, J. D., Collier, P., & Udry, C. (1998). Geography, Demography, and Economic Growth in Africa. Brookings Papers on Economic Activity, 1998(2), 207-295.
Blundell, R., & Bond, S. (1998). Initial Conditions and Moment Restrictions in Dynamic Panel Data Models. Journal of Econometrics, 87(1), 115-143.
Bockstette, V., Chanda, A., & Putterman, L. (2002). States and Markets: The Advantage of an Early Start. Journal of Economic Growth, 7(4), 347-369.
Borcan, O., Olsson, O., & Putterman, L. (2018). State History and Economic Development: Evidence from Six Millennia. Journal of Economic Growth, 23(1), 1-40.