Munich Personal RePEc Archive
A “citation surplus” should be added to
the h-index
Da Silva, Sergio
2017
Online at
https://mpra.ub.uni-muenchen.de/83176/
A “citation surplus” should be added to
the
h
-index
Sergio Da Silva
aaDepartment of Economics, Federal University of Santa Catarina,
Florianopolis, S.C., 88049-970, Brazil
* Corresponding author. Tel.: +55 48 3721 9901; fax: +55 48 3721 9901. Email address:
[email protected] (S. Da Silva).
Abstract
The h-index is the largest number h such that h publications have at least h citations. The index reflects both the number of publications and the number of citations per publication. One unperceived deficiency of this metric is that it is Pareto-inefficient.A “citation surplus” would be absent and, thus, the h-index would be efficient for a researcher if all his h papers that are equal or above his h-index received exactly h citations.This inefficiency would not be of great concern if those h papers were normally distributed. However, the rank from top to bottom does not decay exponentially. The decay follows the power law known in the literature as Lotka’s law.To remedy this deficiency, I suggest the h-index be supplemented by a researcher’s citation surplus.
Subject area: Scientometrics
T
he h-index (after Hirsch [1]) is the largest number h such that h publications have at least hcitations. The index reflects both the number of publications and the number of citations per publication. One unperceived deficiency of this metric is that it is inefficient, in economic terms. This inefficiency relates to the very articles cited more than their rank. In particular, to those citations above the h-index.
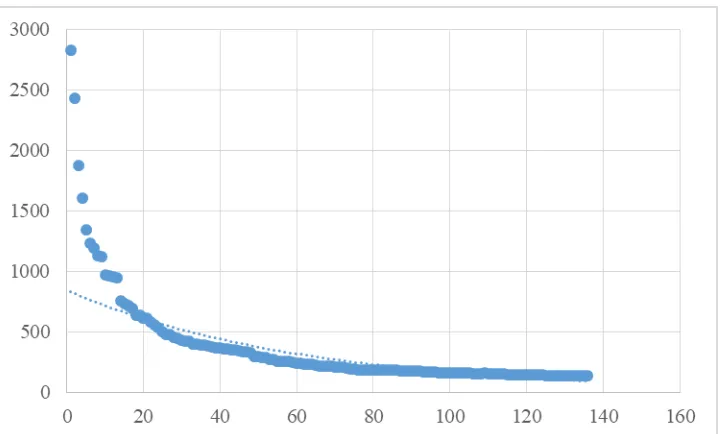
[image:3.612.74.435.237.454.2]To appreciate this, consider a researcher with h-index of 136, as in Figure 1. The citations received by his papers that overshoot 136 citations are left out from the h-index, although they are what economists call the producer surplus. Absence of surplus denotes what is called Pareto efficiency in economics.If the h-index were efficient for this researcher, all of his 136 papers that are equal or above the h-index of 136 would receive exactly 136 citations.
Figure 1. Citations received by Researcher One that fall above his h-index of 136. Vertical axis: number of citations; horizontal axis: rank. A power fit is appropriate, and the dotted line shows an exponential fit is unsatisfactory.
I collected the data in Figure 1 from the website of one prominent physicist called Researcher One. For him, I computed a “citation surplus” of 51,586 by summing all the citations that fall above his h-index of 136. His citation surplus represented 67.19 percent of his total citation of 76,778, which is a figure I collected from Thomson ISI Web of Science. His most cited paper received 2,832 citations, a figure hugely larger than his h-index of 136. The dataset is available at Figshare (https://doi.org/10.6084/m9.figshare.5404798.v1).
Figure 2. Log of rank versus log of citations received by Researcher One that fall above his h-index of 136. A power law describes well the tail of his citation distribution.
I further collected data from two other researchers working on the same subject as that of Researcher One. The data was taken from ResearcherID of Thomson Reuters and is available at Figshare as well (https://doi.org/10.6084/m9.figshare.5404798.v1).
[image:4.612.82.435.449.664.2]Researcher Two had an h-index of 27, as of September 2017. For him, I computed a citation surplus of 3,541, which makes up 95.55 percent of his total citation of 3,868. His most cited paper received 731 citations, which is 27 times greater than his h-index of 27. Figure 3 shows the inadequacy of an exponential fit (dotted line) for the tail of the citation distribution of Researcher Two. Actually, the tail decays as a power law (Figure 4).
Figure 4. Log of rank versus log of citations received by Researcher Two that fall above his h-index of 27. A power law describes well the tail of his citation distribution.
In turn, Researcher Three had an h-index of 8 (as of September 2017). I computed his citation surplus as 95, which makes up 57.23 percent of the 166 citations he received from all of his papers. A pattern similar to those for Researchers One and Two is seen (Figures 5 and 6).
[image:5.612.73.434.379.596.2]Figure 6. Log-log plot of rank versus citations received by Researcher Three that fall above his h-index of 8. The tail decay follows a power law.
[image:6.612.73.541.437.497.2]Table 1 sums up the three cases. The degree of inefficiency of the h-index looms larger as one considers a researcher with more citations, as evidenced by growing citation surpluses. Because the tails of the citation distributions do not decay exponentially, the problem of the inefficiency of the h-index is consequential. The most cited paper impacts a discipline disproportionally more – a fact that cannot be captured by the h-index metric alone. Therefore, it has to be supplemented by the citation surplus, as suggested here.
Table 1. Summary of the illustrations employed.
h-index citation surplus citations received by the most cited paper
Researcher One 136 51,586 2,832
Researcher Two 27 3,541 731
Researcher Three 8 95 21
My suggestion echoes what statisticians do when supplementing averages with measures of variance. For example, the median indicates only the value in the middle but ignores how much larger the larger numbers are and how much smaller the smaller numbers are. In our terms, the median is Pareto-inefficient. One could supplement the h-index by similar measures of variation
– for example, by counting the total number of citations beyond h of all papers with more than h
citations, as suggested here. Computing this citation surplus is equivalent to determining the value of the cumulative distribution function beyond the mean, which might differ from 50 percent for nonsymmetric distributions.
many times the papers with more than h citations have been cited. It is a variance to supplement an average for statisticians, and it is a citation surplus for economists.
References
[1] Hirsch JE (2005) An index to quantify an individual’s scientific research output, PNAS 102 (46), 16569-16572.