University of Warwick institutional repository: http://go.warwick.ac.uk/wrap
This paper is made available online in accordance with publisher policies. Please scroll down to view the document itself. Please refer to the repository record for this item and our policy information available from the repository home page for further information.
To see the final version of this paper please visit the publisher’s website. Access to the published version may require a subscription.
Author(s): J. Liu, R.J. Chater, B. Hagenhoff, R.J.H. Morris and S.J. Skinner,
Article Title: Surface enhancement of oxygen exchange and diffusion in the ionic conductor La2Mo2O9
Year of publication: 2010
Surface Enhancement of Oxygen Exchange and Diffusion in the
Ionic Conductor La
2Mo
2O
9J. Liu
a, R. J. Chater
a, B. Hagenhoff
b, R. J. H. Morris
c, S. J. Skinner
a, *a Department of Materials, Imperial College London, Prince Consort Road, London SW7 2BP, UK b TASCON GmbH, Heisenbergstr.15, D-48149 Münster, Germany
c Department of Physics, University of Warwick, Gibbet Hill Road, Coventry, CV4 7AL, UK
___________________________________________________________________________ Abstract
Isotopic surface oxygen exchange and its subsequent diffusion has been measured using secondary ion mass spectrometry in the fast ionic conductor La2Mo2O9. A silver coating was
applied to the sample surface to enhance the surface exchange process for dry oxygen. Contrary to previous studies performed using a wet atmosphere, no grain boundary diffusion tail was observed under these optimized dry exchange conditions. The activation energy for oxygen diffusion was found to be 0.66(±0.09) eV at high temperature (>570˚C), and 1.25(±0.01) eV at low temperature (<570˚C). Time-of-Flight secondary ion mass spectrometry was employed to investigate the correlation between the silver coating and the
18
O concentration on the sample surface. A close correlation between the presence of silver and oxygen incorporation on the surface was observed.
Keywords: La2Mo2O9; Oxygen diffusion; Surface exchange; Silver
___________________________________________________________________________
——————
* Corresponding author. Stephen J. Skinner, Department of Materials, Imperial College London, Prince Consort
1. Introduction
Fast oxide-ion conductors have been attracting considerable attention because of their wide range of applications, some of which include the electrolyte for solid oxide fuel cells (SOFCs) and oxygen sensors [1, 2]. Being a fast oxide ion conductor, La2Mo2O9 has attracted much
interest since its introduction by Lacorre in 2000 [3]. The main advantage of this material is the excellent ionic conductivity for temperatures above 570˚C which is comparable to those
of the commercialized yttria stabilized zirconia (YSZ) and gadolinium doped ceria (CGO). Although the phase transition (β-phase to α-phase) upon cooling to ~570˚C causes a number
of negative effects, e.g. the unit cell volume change, the significant drawback is a reduction in its ionic conductivity by almost two orders of magnitude [3]. Many studies have now effectively proved that substituting the La site with Gd [4], Er, Dy, [5] and others [6] can suppress the phase transition and stabilize the conducting β phase. Moreover, substitution of the Mo site with W can also improved the material by increasing its resistance to the reducibility of Mo [7]. These substituted derivatives are referred to as the LAMOX family (the substituted La2Mo2O9 materials). Apart from the improvements of the electrical
properties, understanding the crystal structure and the oxygen transport mechanism is an essential guide to optimizing these materials and promoting their application [8, 9].
Measurement of the oxygen surface exchange and diffusion coefficients is an excellent method by which the oxygen mobility within a material can be directly determined. From the diffusion coefficient, the number of mobile charge carriers can be calculated and correlated with the measured conductivity. To date the oxygen isotope diffusion measurement has been applied to many electroceramics, such as La2-xSrxNiO4-δ [10], YSZ [11] and CGO [12].
number of available electrons restricts the charge transfer in the oxygen dissociation on the surface, as shown in the reaction O2+4e-→2O2- [14]. To overcome this limitation, one
solution is to perform the isotope exchange in a humidified atmosphere. It is suggested that the adsorbed water on the surface plays an important role in the oxygen isotope exchange reaction [15, 16] with dissociation of H2O being more favourable than that of O2 (g). The only
previous report [13] of oxygen ion diffusion in LAMOX, which was undertaken in a wet atmosphere, reveals the diffusion profiles at different temperatures and also gives the diffusion coefficients of oxygen ions. This report did, however, raise questions about the nature of the oxygen transport in LAMOX. To date there have not been, to our knowledge, any reports regarding the oxygen exchange and diffusion using a dry atmosphere for La2Mo2O9.
In this paper, we report on the characterization of the oxygen transport in La2Mo2O9 under dry
conditions using an isotopic labelling technique previously described elsewhere [21]. These studies further demonstrate the fast oxygen ion transport of La2Mo2O9 whilst also highlighting
the important role a catalyst has, in this particular case silver.
2. Experimental
2.1 Sample preparation
La2Mo2O9 powder was prepared by conventional solid state synthesis [4, 7]. The starting
materials, La2O3 (99.9%, Aldrich) and MoO3 (99.5%, Aldrich) were mixed stoichiometrically
and ball-milled under acetone with stabilized zirconia milling media for 24 hours (La2O3
powder was pre-heated at 1000˚C for 6 hours before mixing). After being dried, the mixture was heated to 500˚C for 12 hours and then to 900˚C for a further 24 hours. La2Mo2O9 pellets
were made by uni-axial pressing followed by iso-static pressing at 300 MPa, and then sintering at 1000˚C for 2 hours. The sample density was determined using the Archimedes
technique, with all specimens found to be greater (taking account of a standard deviation of 0.2%) than 95% of their theoretical density.
In order to obtain high-quality results using secondary ion mass spectrometry (SIMS), sample preparation followed the method which has been used in previous studies [22, 23]. The dense pellets were polished with diamond slurry down to a finish of 0.25μm. The polished surface
2.2 Oxygen isotope exchange and diffusion measurement
Oxygen diffusion was studied using the isotope exchange technique followed by secondary ion mass spectrometry, as discussed in previous studies [24, 25]. The details of the oxygen exchange apparatus has been described previously [21]. Samples were pre-annealed in dry research grade oxygen (BOC 99.996%) of natural isotopic abundance for a duration of 10 times that of the isotopic exchange time [26] to ensure oxygen equilibration. The equilibrated sample was then annealed in 18O enriched gas at a pressure of 200 mbar for 30 minutes before being rapidly quenched to room temperature. Previously reported [13] „wet‟ exchange samples had been exposed to an atmosphere of H218O at the anneal temperature and
subsequently slow cooled to 100oC, leading to a key experimental difference between the data reported here and that of George et al.
After the exchange, the diffusion profile was obtained by SIMS. Generally, two different approaches were applied. Starting at the exposed sample surface, depth profiles, measuring the 16O and 18O intensities as a function of sputter time (corresponding to increasing depth) were taken. In cases where the penetration depth of the diffusing species was larger than 100 µm, SIMS images or line scans [27] were taken from polished cross sections (polishing down to a finish of 0.25 µm). In order to avoid polishing residues influencing the data, a sputter cleaning of the area of analysis was performed prior to analysis.
with an ion current of 60nA for the Atomika 6500, while the Ar+ beam was 2.5 keV and 75nA for the Atomika 4500. The obtained diffusion profiles were analyzed using Crank‟s solution to Fick‟s second law of diffusion. The solution is given as [28]:
)} ( ) 2 {( ) 2 ( ) ( * * ) * ( * 1 2 t D h t D x erfc e t D x erfc x
C hxhDt (1)
where C1(x) is the normalised isotopic fraction at a depth x and is normalized to the gas
concentration, Cg, as shown in Equation 2. D* is the self-diffusion coefficient, t is the isotopic
exchange time and h is the ratio of surface exchange coefficient k to D*.
bg g bg C C C x C x C ( ) ) (
1 (2)
where C(x) is the ratio of 18O- intensity to the total intensity of (18O- + 16O-), Cbg is the
background isotopic fraction in the material, and Cg is the isotopic fraction of the exchange
gas which is assumed to remain constant throughout the exchange experiment. The length 2(D*t)0.5 is commonly called “the diffusion length” and represents the decay of the diffusion concentration with depth.
The TOF-SIMS instrument was operated using Bi1+ primary ions at 25 keV energy.
Sputtering, either for depth profiles or for surface cleaning, was performed using Cs+ at 2 keV energy. In contrast to the Atomika instruments depth profiles in the ION-TOF instrument were obtained in the dual beam mode with one primary ion gun (Cs) eroding the surface and a second ion gun (Bi) addressing the respective crater bottom. This approach allows the optimisation of the sputter and analysis conditions independently. Therefore it is possible to achieve information on the lateral and depth distribution of elements with both high lateral and high depth resolution [29].
X-ray diffraction (XRD) data (30 s/step, 2θ=20˚~80˚, ∆(2θ)=0.02˚) were obtained to check the phase purity of the as-prepared materials and also to check if there was any reaction between the sample and the surface coating after the exchange process. A Philips PW 1700 series instrument with CuKα radiation operating at 40 kV/40mA was used in this study.
Scanning electron microscopy (SEM) (JEOL JSM 5610 LV, Japan) and a focused ion beam (FIB) (FEI FIB200) were used to image the silver coated surface after the isotopic exchange and the section of a silver droplet located at grain boundaries.
3. Results and Discussion
3.1 Diffusion profiles and analysis
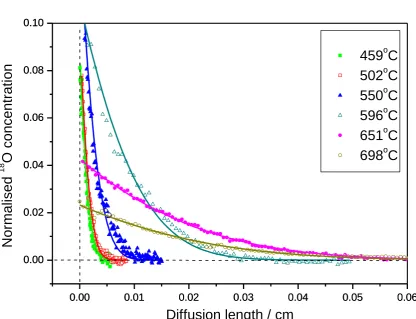
The diffusion profiles of the samples that were isotope exchanged at their intended temperatures of 450, 500, 550, 600, 650 and 700˚C are shown in Fig. 1. The measured
temperatures obtained from a thermocouple located beside the sample are also listed in Table 1. It is apparent that the oxygen diffusion length increases with increasing isotopic exchange temperature, especially above 600˚C where the expansion of the La2Mo2O9 unit cell releases
more space for oxygen transport [30]. Moreover, it is clear that the Ag coating has enhanced the surface exchange and thus helped to obtain the oxygen diffusion profiles even at low temperature [13].
The difference in the diffusion behaviour of La2Mo2O9 implies that the previously reported
tailing behaviour could be an experimental artefact as a result of the slow cooling procedure used in the wet exchange process, while in the current study sample quenching was applied to minimize the effect of diffusion during cooling. The intrinsic diffusion coefficient at the anneal temperature will not be affected by this difference in exchange procedure, but with a slow cooling process the intrinsic kinetic parameters are not obtained, as discussed by Vannier et al [23]. The previously reported „wet‟ exchange diffusion coefficients may
therefore be a summation of diffusion coefficients at a number of temperatures, resulting in tailing behaviour. We also note that the synthesis and processing method detailed by Georges
et al. [13] in a previous publication and ourselves is nominally the same and therefore the
possibility of the effects of microstructure on the diffusion can be eliminated. However, these potential differences between the dry and wet exchanges e.g. the existence of the grain boundary diffusion in the wet exchange, requires further work. It is clear that under dry conditions, no tailing was observed in this series of samples.
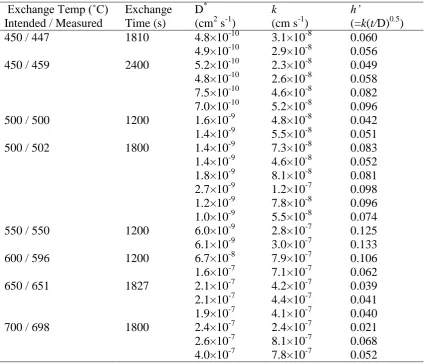
The measured diffusion and surface exchange coefficients are listed in Table 1. Because of
the surface modification introduced by the silver coating, the obtained surface exchange coefficient, k, deduced from the fitting of the diffusion profile using the non-linear least square equation, is not characteristic of the La2Mo2O9 surface. A dimensionless parameter
h’=k(t/D)0.5
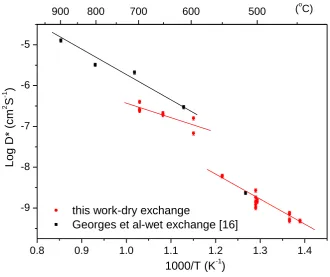
[25]. The diffusion coefficients are also plotted in Fig. 2 along with the previously reported diffusion coefficients as a comparison. There is an obvious jump of about one order of magnitude in the diffusion coefficient values when the exchange temperature was increased from 550˚C to 600˚C which coincides with the temperature range for the α-β phase transition.
The previously reported diffusion coefficients are higher than those obtained in this work, which might be a result of chemical differences between the materials. However, the data trend suggests a significant difference between the activation energy for the two data sets. For the data points within the temperature range 600-700˚C, the activation energy is found to be 0.66(±0.09) eV, while for the low temperature range (450-550˚C) it is 1.25(±0.01) eV. The activation energy reported in the literature [13] for the high temperature data was 1.11(±0.16)eV significantly larger than the value found here. No other literature data are available for a comparison of the activation energies in the low temperature regime. This difference in the activation energy may reflect the differences between the two exchange methods. As the silver coating is not expected to have any effect on the bulk diffusion coefficient, it is more likely that the wet exchange method has led to a variation in the diffusion coefficient measurement leading to the higher activation energy reported for oxygen diffusion, possibly due to the effect of slow cooling of the labelled samples prior to analysis. Moreover, the lower activation energy at high temperature indicates a lower energy barrier for oxygen transport, which is consistent with the increase of the conductivity due to the open crystal structure of β-La2Mo2O9 after the phase transition [30].
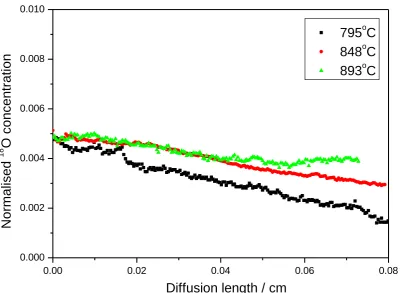
because of the difficulty of charge transfer in ceramics [21]. The silver film applied acts as a catalyst for the oxygen dissociation and also increases the number of triple phase boundaries (TPBs) that facilitate charge transfer. However, in the samples which were exchanged at higher temperatures, 795, 848 and 893˚C, the surface isotopic concentration was so low that we could not obtain the diffusion coefficients by fitting to the experimental profiles, as shown in Fig. 3. We believe that the 18O exchange at these elevated temperatures was surface limited, suggesting that the silver coating on the surface might have degraded in some way, thus reducing the surface exchange kinetics.
3.2 Stability of the silver coating
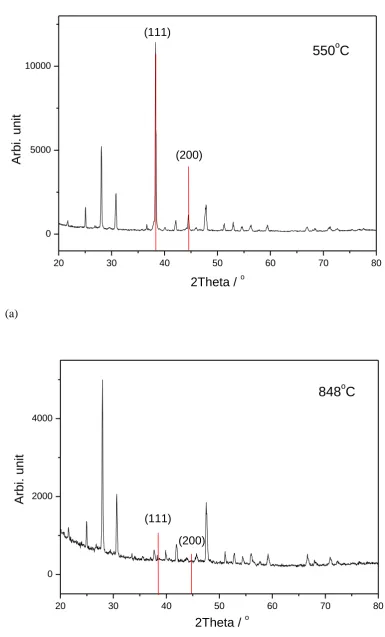
As mentioned previously, we believe that for the high exchange temperatures used here, the catalyst coating was deactivated through the loss of silver (e.g. evaporation) or a chemical reaction of the Ag coating with La2Mo2O9. XRD patterns were obtained to investigate the
surface of the samples (Fig. 4). From the XRD it is clear that at low temperature, the surface silver coating remained intact (Fig. 4 (a)), while there was little silver left after the sample was exchange annealed at the higher temperature (≥800˚C) (Fig. 4 (b)). This corresponds well with the diffusion profiles found for the low (≤700˚C) and high temperatures (≥800˚C). There
were no impurity peaks found in both XRD diffraction patterns, indicating that the silver was chemically stable on La2Mo2O9 despite the relatively high anneal temperature of about 800˚C.
However, taking into consideration the resolution of the XRD technique, we have to leave the question open as to whether there is any amalgam i.e. Ag/(La or Mo), reactivity between Ag and La2Mo2O9 or amorphous silver on the surface.
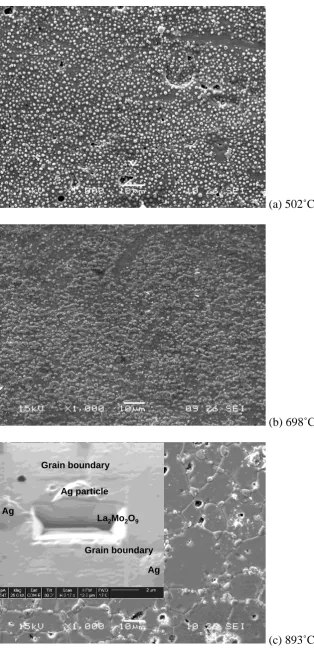
temperature. For increasing temperatures, especially under low pressure, the silver film goes through a series of changes, such as evaporation, or even sublimation [34]. To observe the silver morphology on the exchanged samples, SEM was used to image the surfaces.
In Fig. 5 (a) and (b), we see that after the sample was heat-treated at about 500˚C and 700˚C, the silver formed a network of “islands” on the surface. A possible reason for this is to minimize the surface energy of the ceramics [35] because of its non-wetting behaviour. This type of silver network will have played a positive role in the oxygen surface exchange due to the enlarged TPB area where electrolyte, oxygen gas and silver regions contact. However, for high temperatures such as 893˚C, Fig. 5 (c), the island coverage became smaller and the distribution changed into a regular pattern along the grain boundaries. This decreased coverage would explain the low surface concentration of 18O observed in the samples annealed at higher temperatures. The FIB technique [36] was applied to investigate a section of a silver particle at the grain boundary. The result (inset of Fig. 5) appears to exclude the possibility of the silver particles diffusing into the grain boundaries, which means the loss of silver at elevated temperature is likely to be a result of silver evaporating from the surface.
3.3 Oxygen isotope tracer surface distribution
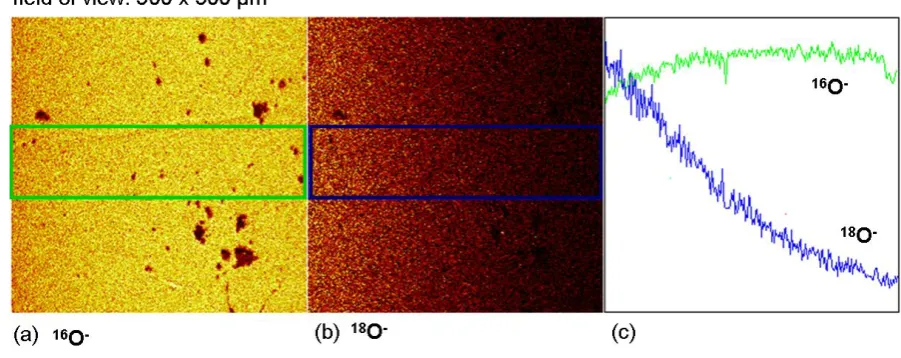
For the sample exchanged at 698˚C, 3D TOF-SIMS depth profiles were acquired in order to investigate the influence of silver on the oxygen exchange and its distribution in the near surface layers.
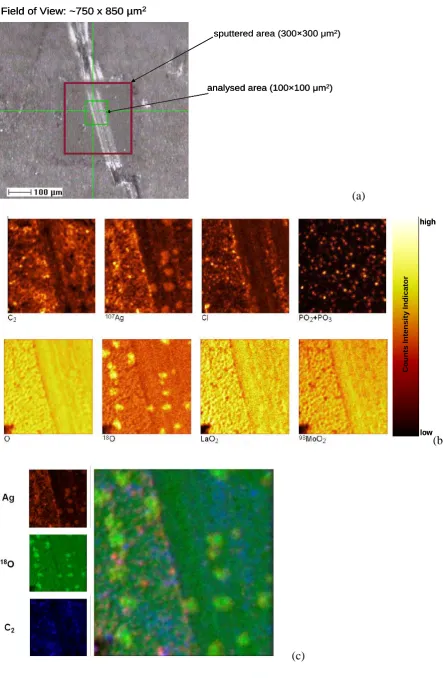
Sputtering was performed over an area of 300×300 μm2 using a current of 120 nA. Imaging of the crater center (100×100 μm2) was performed using a Bi1+ beam at a current of 0.05 pA in
in Fig. 6. The track within the selected area (Fig. 6(a)) is believed to be a scratch on the surface, and the reason for choosing this area is that the silver coating was damaged during the sample preparation after the exchange, therefore the silver islands are more likely to remain untouched within the track, making this a useful region for studying the relationship between oxygen and the silver coating.
In Fig. 6(b), the LaO2+ and MoO2+ images show a uniform lateral surface element distribution
and thus confirm the homogeneity of the prepared La2Mo2O9 sample. Carbon, chlorine, and
phosphorus contamination are evident from these maps the origin of which is currently being sought. Of significance is the strong relationship between 18O and Ag. Despite the damage to the silver coating during polishing, the positions of the silver particles left in the track are consistent with the 18O enriched area. This phenomenon was confirmed by correlation analysis (3-colour-overlay) of three TOF-SIMS maps representing the Ag, 18O and C distribution. Carbon is mostly located in the open pores on the surface.
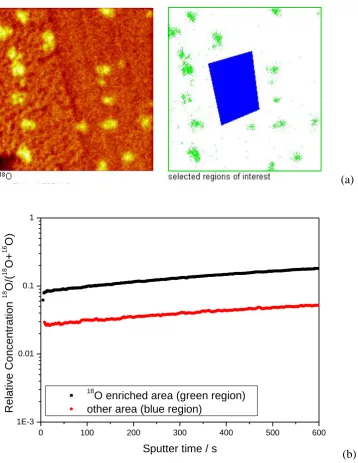
From the 3D data stream the depth profiles of 18O and 16O can be retrieved for both the 18O enriched and the less enriched areas (Fig. 7). The depth profiles show that in the 18O enriched area (the area with Ag), the 18O concentration is twice as high as that where less Ag was present. This relatively high concentration could be associated with dissolved oxygen in the silver [37], but it could also be related to the improved oxygen exchange on the ceramic surface.
3D depth profiling has therefore identified some issues regarding the isotopic exchange of La2Mo2O9 in the near surface layers. On a larger scale, however, the element mapping results
satisfactory uniform oxygen diffusion along the depth direction, as shown in Fig. 8. From these data, the obtained diffusion coefficient was determined to be 4.7×10⁻⁷ cm²·s-1, which agrees well with the value already determined from the line scan technique on other instruments as listed in Table 1 and therefore reaffirms the validity of the obtained diffusion coefficients. This also indicates that the surface oxygen incorporation enhancement involving the Ag catalysis did not have a significant effect on the diffusion profile.
4. Conclusion
We have shown that a silver coating has a significant influence on the surface oxygen exchange properties of La2Mo2O9. It was shown that a thin silver film enhances the surface
oxygen dissociation and thus improves the surface exchange coefficient. Therefore, diffusion profiles can be obtained for ionic conductors enabling the diffusion coefficient for such electrolyte materials to be obtained. However, because of the silver layer instability at high temperature (>700˚C), all attempts to obtain the diffusion profiles at these high temperatures were unsuccessful. The diffusion profiles obtained for the temperatures lower than 700˚C did show some differences compared with those previously published [13] which involved a grain boundary diffusion effect, suggesting that in dry conditions there is no significant grain boundary diffusion for the La2Mo2O9 material. The difference in the activation energy
between our work and the previous report [13] might suggest the isotopic exchange atmosphere has some effects on the oxygen diffusion in La2Mo2O9.
“islands” at low temperature (≤700˚C) to a severely damaged silver coating at high
temperatures (>700˚C). Surface analysis using TOF-SIMS indicated that the oxygen dissociation and exchange were not uniform while there was a correlation found between the formed silver islands and where the sample was 18O enhanced. Although the diffusion profile extracted from the element mapping showed silver distribution and the un-uniform oxygen incorporation on the surface did not appear to have a significant effect on the diffusion profile, the mechanism behind the surface reaction during exchange still requires further investigation.
Based on these results, further work regarding the silver coating on the diffusion and surface exchange of the La2Mo2O9 ionic conductor are under way.
5. Acknowledgements
References
1. Skinner S. J., Kilner J. A., Materials Today, 2003, 3: 30-37.
2. Marques F. M. B., Kharton V. V., Naumovich E. N., Solid State Ionics, 2006, 177(19-25): 1697-1703
3. Lacorre P., Goutenoire F., Bohnke O., Nature, 2000, 404: 856-858.
4. Georges S., Goutenoire F., Altorfer F., Sheptyakov D., Fauth F., Suard E., Lacorre P., Solid State Ionics, 2003, 161(3-4): 231-241.
5. Tsai D. S., Hsieh M. J., Tseng J. C., Lee H. Y., J. Eur. Ceram. Soc., 2005, 25(4): 481-487.
6. Marrero-Lopez D., Perez-Coll D., Ruiz-Morales J. C., Canales-Vazquez J., Martin-Sedeno M. C., Nunez P., Electrochim. Acta, 2007, 52: 5219-5231.
7. Georges S., Bohnke O., Goutenoire F., Laligant Y., Fouletier J., Lacorre P., Solid State Ionics, 2006, 177: 1715-1720.
8. Goutenoire F., Isnard O., Retoux R., Lacorre P., Chem. Mater., 2000, 12(9): 2575-2580.
9. Evans I. R., Howard J. A. K., Evans J. S. O., Chem. Mater., 2005, 17(16): 4074-4077. 10. Skinner S. J., Kilner J. A., Solid State Ionics, 2000, 135: 709-712.
11. De Souza R. A., Pietrowski M. J., Anselmi-Tamburini U., Kim S., Munir Z. A., Martin M., Phys. Chem. Chem. Phys., 2008(10): 2067-2072.
12. Lane J. A., Kilner J. A., Solid State Ionics, 2000, 136-137: 927-932.
13. Georges S., Skinner S. J., Lacorre P., Steil M. C., Dalton Trans., 2004(19): 3101-3105. 14. Boukamp B. A., Van Hassel B. A., Vinke I. C., De Vries K. J., Burggruf A. J.,
Electrochim. Acta, 1993, 38(14): 1817-1825.
16. Sakai N., Yamaji K., Negishi H., Horita T., Yokokawa H., Xiong Y. P., Phillipps M. B., Electrochemistry, 2000, 68(6): 499-503.
17. Wang J. H., Liu M. L., C. L. M., Solid State Ionics, 2006, 177: 939-947. 18. Van Herle J., McEvoy A. J., J. Phys. Chem. Solids, 1994, 55(4): 339-347.
19. Raj E. S., Atkinson A., Kilner J. A. 8th European Solid Oxide Fuel Cell Forum. Lucerne, Switzerland.2008 : A0714.
20. Ji Y., Kilner J. A., Carolan M. F., Solid State Ionics, 2005, 176: 937-943. 21. Manning P. S., Sirman J. D., Kilner J. A., Solid State Ionics, 1997, 93: 125-132. 22. Kilner J. A., Steele B. C. H., Solid State Ionics, 1984, 12: 89-97.
23. Vannier R. N., Skinner S. J., Chater R. J., Kilner J. A., Mairesse G., Solid State Ionics, 2003, 160: 85-92.
24. Kilner J. A., De Souza R. A., International Symposium on Materials Science: high temperature electrochemistry-ceramics and metals, Denmark, 1996 : 41-54
25. Atkinson A., Chater R. J., Rudkin R., Solid State Ionics, 2001, 139: 233-240. 26. De Souza R. A., Kilner J. A., Solid State Ionics, 1998, 106: 175-187.
27. Chater R. J., Carter S., Kilner J. A., Steele B. C. H., Solid State Ionics, 1992, 53-56: 859-867.
28. Crank J., The mathematics of diffusion. 1975, Oxford: Oxford University Press.
29.
http://www.ion-tof.com/technique-sims-IONTOF-TOF-SIMS-TIME-OF-FLIGHT-SURFACE-ANALYSIS.htm. (accessed: 20/09/2009)
30. Tealdi C., Malavasi L., Ritter C., Flor G., Costa G., J. Solid State Chem., 2008, 181: 603-610.
31. Harries I. R., Jones I. P., Grain Boundaries: Their Character, Characterisation and
Influence on Properties. 2001: Maney Publishing.
33. Alford T. L., Chen L. H., Gadre K. S., Thin Solid Films, 2003, 429(1-2): 248-254. 34. Dushman S., Lafferty J. M., Scientific Foundations of Vacuum Technique. 1966: John
Wiley & Sons Inc.
35. Simrick N. J., Kilner J. A., Atkinson A., 8th European Solid Oxide Fuel Cell Forum Lucerne, Switzerland.2008 : A0608.
List of Table Captions
Table 1. Experimental details and kinetic parameters determined from La2Mo2O9 samples as a
Table List
Table 1
Exchange Temp (˚C) Intended / Measured
Exchange Time (s)
D* (cm2 s-1)
k
(cm s-1)
h’
(=k(t/D)0.5) 450 / 447
450 / 459
1810 2400 4.8×10⁻¹⁰ 4.9×10⁻¹⁰ 5.2×10⁻¹⁰ 4.8×10⁻¹⁰ 7.5×10⁻¹⁰ 7.0×10⁻¹⁰ 3.1×10⁻⁸ 2.9×10⁻⁸ 2.3×10⁻⁸ 2.6×10⁻⁸ 4.6×10⁻⁸ 5.2×10⁻⁸ 0.060 0.056 0.049 0.058 0.082 0.096 500 / 500
500 / 502
1200 1800 1.6×10⁻⁹ 1.4×10⁻⁹ 1.4×10⁻⁹ 1.4×10⁻⁹ 1.8×10⁻⁹ 2.7×10⁻⁹ 1.2×10⁻⁹ 1.0×10⁻⁹ 4.8×10⁻⁸ 5.5×10⁻⁸ 7.3×10⁻⁸ 4.6×10⁻⁸ 8.1×10⁻⁸ 1.2×10⁻⁷ 7.8×10⁻⁸ 5.5×10⁻⁸ 0.042 0.051 0.083 0.052 0.081 0.098 0.096 0.074
550 / 550 1200 6.0×10⁻⁹
6.1×10⁻⁹
2.8×10⁻⁷ 3.0×10⁻⁷
0.125 0.133
600 / 596 1200 6.7×10⁻⁸
1.6×10⁻⁷
7.9×10⁻⁷ 7.1×10⁻⁷
0.106 0.062
650 / 651 1827 2.1×10⁻⁷
2.1×10⁻⁷ 1.9×10⁻⁷ 4.2×10⁻⁷ 4.4×10⁻⁷ 4.1×10⁻⁷ 0.039 0.041 0.040
700 / 698 1800 2.4×10⁻⁷
2.6×10⁻⁷ 4.0×10⁻⁷ 2.4×10⁻⁷ 8.1×10⁻⁷ 7.8×10⁻⁷ 0.021 0.068 0.052
* Note: k is the surface exchange coefficient for the La2Mo2O9 surface modified by the silver
List of Figure Captions
Fig. 1. The diffusion profiles recorded at different exchange temperatures with the fitting results displayed as solid lines.
Fig. 2 Arrhenius plot of the diffusion coefficients for the prepared La2Mo2O9, with the
previously reported values as a comparison [16]. 10% error bar was added to reflect the accuracy in the determination of D* in each line scan [24].
Fig. 3 The diffusion profiles of La2Mo2O9 recorded after exchange at 795, 848 and 893˚C
Fig. 4 XRD pattern of the isotopic exchanged samples with silver coating, with the silver XRD diffraction lines indicated in red. (a) sample exchanged at 550˚C; (b) sample exchanged at 848˚C
Fig. 5 The images (125×95 μm2) of the silver-coated surface after the exchange at (a) 502 (b) 698 and (c) 893˚C (the inset is the section image of a silver particle along the grain boundary using FIB).
Fig. 7 Depth (sputter time) profiles of the oxygen isotope ratio in 18O enriched areas compared with the ratio in the poorly enriched areas (data taken from the raw data stream of the experiment of Fig. 6)
Figure List
Fig. 1
0.00 0.01 0.02 0.03 0.04 0.05 0.06
0.00 0.02 0.04 0.06 0.08 0.10
0.00 0.01 0.02 0.03 0.04 0.05 0.06
0.00 0.02 0.04 0.06 0.08 0.10
459
oC
502
oC
550
oC
596
oC
651
oC
698
oC
N
or
m
al
ised
18
O
conce
nt
rat
ion
Fig. 2
0.8 0.9 1.0 1.1 1.2 1.3 1.4
-9 -8 -7 -6 -5
900 800 700 600 500
this work-dry exchange
Georges et al-wet exchange [16]
Lo
g D
*
(cm
2 S -1 )
1000/T (K-1)
Fig. 3
0.00 0.02 0.04 0.06 0.08
0.000 0.002 0.004 0.006 0.008 0.010
N
orm
al
ised
18
O
con
cen
tr
ati
on
Diffusion length / cm
795
oC
848
oC
Fig. 4
20 30 40 50 60 70 80
0 5000 10000
A
rbi
.
uni
t
2Theta / o
(111)
(200)
550
oC
(a)
20 30 40 50 60 70 80
0 2000 4000
A
rbi
.
uni
t
2Theta / o (200)
(111)
848
oC
Fig. 5
(a) 502˚C
(b) 698˚C
(c) 893˚C
Grain boundary
Grain boundary Ag
Ag Ag particle
Fig. 6
sputtered area (300×300 μm2)
Field of View: ~750 x 850 µm2
analysed area (100×100 μm2) sputtered area (300×300 μm2)
Field of View: ~750 x 850 µm2
analysed area (100×100 μm2)
Field of View: ~750 x 850 µm2
analysed area (100×100 μm2)
Fig. 7
(a)
0 100 200 300 400 500 600
1E-3 0.01 0.1 1
18
O enriched area (green region) other area (blue region)
R
el
at
ive
C
once
nt
rat
ion
18
O
/(
18
O+
16
O)
Sputter time / s
Fig. 8