University of Warwick institutional repository: http://go.warwick.ac.uk/wrap
This paper is made available online in accordance with
publisher policies. Please scroll down to view the document
itself. Please refer to the repository record for this item and our
policy information available from the repository home page for
further information.
To see the final version of this paper please visit the publisher’s website.
Access to the published version may require a subscription.
Author(s): Carl Edward Rasmussen, Bernard J. de la Cruz, Zoubin
Ghahramani, and David L. Wild
Article Title: Modeling and Visualizing Uncertainty in
Gene Expression Clusters Using Dirichlet Process Mixtures
Year of publication: 2009
Link to published version:
http://dx.doi.org/10.1109/TCBB.2007.70269
Modeling and Visualizing Uncertainty in
Gene Expression Clusters Using
Dirichlet Process Mixtures
Carl Edward Rasmussen, Bernard J. de la Cruz, Zoubin Ghahramani, and David L. Wild
Abstract—Although the use of clustering methods has rapidly become one of the standard computational approaches in the literature of microarray gene expression data, little attention has been paid to uncertainty in the results obtained. Dirichlet process mixture (DPM) models provide a nonparametric Bayesian alternative to the bootstrap approach to modeling uncertainty in gene expression clustering. Most previously published applications of Bayesian model-based clustering methods have been to short time series data. In this paper, we present a case study of the application of nonparametric Bayesian clustering methods to the clustering of high-dimensional nontime series gene expression data using full Gaussian covariances. We use the probability that two genes belong to the same cluster in a DPM model as a measure of the similarity of these gene expression profiles. Conversely, this probability can be used to define a dissimilarity measure, which, for the purposes of visualization, can be input to one of the standard linkage algorithms used for hierarchical clustering. Biologically plausible results are obtained from the Rosetta compendium of expression profiles which extend previously published cluster analyses of this data.
Index Terms—Clustering, classification, and association rules, biology and genetics, bioinformatics (genome or protein) databases, statistical computing, stochastic processes, Monte Carlo.
Ç
1
I
NTRODUCTIONT
HEuse of clustering methods has rapidly become one of the standard computational approaches to understand-ing microarray gene expression data [1], [2], [3]. In clustering, the patterns of expression of different genes across time, treatments, and tissues are grouped into distinct clusters (perhaps organized hierarchically) in which genes in the same cluster are assumed to be potentially functionally related or to be influenced by a common upstream factor. Such cluster structure can be used to aid the elucidation of regulatory networks. For example, a compendium of gene expression profiles corresponding to mutants and chemical treatments can be used as a systematic tool to identify gene functions because mutants or drug targets that display similar profiles are likely to share cellular functions [4]. It would also be expected that gene knockouts/mutations or treatments that have impact on the same signaling or metabolic pathway or affect the same organelle would exhibit some overlap in altered gene expression profiles.Agglomerative hierarchical clustering [1] is one of the most frequently used methods for clustering gene expression
profiles. However, commonly used methods for agglomera-tive hierarchical clustering rely on the setting of some score threshold to distinguish members of a particular cluster from nonmembers, making the determination of the number of clusters arbitrary and subjective. The algorithm provides no guide to choosing the “correct” number of clusters or the level at which to prune the tree. It is often difficult to know which distance metric to choose, especially for structured data such as gene expression profiles. Moreover, these approaches do not provide a measure of uncertainty about the clustering, making it difficult to compute the predictive quality of the clustering and to make comparisons between clusterings based on different model assumptions (e.g., numbers of clusters and shapes of clusters). In this paper, we use statistical inference to overcome these limitations. An important issue that must be addressed in any clustering method is the question of how many clusters to use. Bayesian statistics and model-based approaches can provide elegant solutions to model selection questions of this kind. With these approaches, there is no need to make arbitrary choices about how many clusters there are in the data; nevertheless, after modeling, one can still ask questions such as “how probable is it that two genes belong to the same cluster?”
Within a Bayesian framework, all assumptions are presented in terms of priors and the choice of likelihood function. Since it seems unreasonable to assume that complex gene expression data have been generated by some small finite number of causes, an elegant nonpara-metric approach is to assume that the data was in fact generated from aninfinite number of Gaussian clusters. In a Gaussian clustering model, each gene expression profile represents a multidimensional vector of measurements and the probability distribution for each cluster is assumed to be . C.E. Rasmussen and Z. Ghahramani are with the Department of
Engineering, University of Cambridge, Trumpington Street, Cambridge, CB2 1PZ, UK. E-mail: [email protected], [email protected].
. B.J. de la Cruz is with the Beckman Research Institute, City of Hope National Medical Center, 1500 E. Duarte Road, Duarte, CA 91010. E-mail: [email protected].
. D.L. Wild is with the Warwick Systems Biology Centre, University of Warwick, Coventry House, Coventry, CV4 7AL, UK.
E-mail: [email protected].
Manuscript received 8 June 2007; revised 8 Oct. 2007; accepted 25 Oct. 2007; published online 30 Nov. 2007.
a multivariate Gaussian. We describe an approach to the problem of automatically clustering microarray gene ex-pression profiles based on the theory of infinite Gaussian mixtures (or Dirichlet process mixtures, DPM) [5], [6]. This theory is based on the observation that the mathematical limit of an infinite number of components in an ordinary finite mixture model (i.e., clustering model) corresponds to a Dirichlet process prior [5], [6], [7]. In an infinite Gaussian mixture model, there is no need to make arbitrary choices about how many clusters there are in the data. Although in theory, the infinite mixture model has an infinite number of parameters, surprisingly, it is possible to do exact inference in these infinite mixture models efficiently using Markov chain Monte Carlo (MCMC) methodology, since only the parameters of a finite number of the mixture components need to be represented explicitly. The theory of DPM models has a long history, going back to [7], [8], and [9], and has recently become popular with the availability of fast MCMC inference, see [6] and [10] for early examples. We first proposed and implemented the application of DPMs to clustering gene expression profiles in an extended con-ference abstract in 2002 [11]. Although this work is not widely known and cited, many groups have subsequently independently rediscovered the value of a fully Bayesian analysis based on DPMs to this problem [12], [13], [14], [15], [16]. We have also subsequently applied the approach to the clustering of protein sequences [17].
In this paper, we illustrate our methods in detail, with a practical application to a well-studied data set: the Rosetta compendium of expression profiles corresponding to 300 diverse mutations and chemical treatments in
S. cerevisiaie [4]. We describe a simple but novel method of visualizing the results which facilitates comparison with the dendrograms obtained by the usual hierarchical cluster-ing approach to this type of data. While our results confirm many of the previously published clusters identified in this data set, they also provide new biological insights by revealing a finer level of granularity in the clustering. These results are consistent with recent literature which suggests that distinct functions may share proteins and have over-lapping regulatory mechanisms.
2
M
ETHODS2.1 Dirichlet Process Mixture Models
Although hierarchical clustering is the most widely used method for clustering gene expression data, model-based nonhierarchical methods have also been explored. One commonly used computational method of nonhierarchical clustering based on measuring euclidean distance between gene expression profiles is given by the k-means algorithm [18], [19]. However, the k-means algorithm is inadequate for describing clusters of unequal size or shape [20]. A generalization of k-means can be derived from the theory of maximum likelihood estimation of Gaussian mixture models [21], [22]. In a Gaussian mixture model, the data (e.g., gene expression profiles, which can be arranged into
p-dimensionalvectorsy) is assumed to have been generated from a finite number (k) of Gaussians:
PðyÞ ¼X
k
j¼1
jPjðyÞ; ð1Þ
wherejis the mixing proportion for clusterj(fraction of
population belonging to cluster j; Pjj¼1; j0), and PjðyÞis a multivariate Gaussian distribution with meanj
and covariance matrix j. The clusters can be found by
fitting the maximum likelihood Gaussian mixture model as a function of the set of parameters¼ fj; j;jgkj¼1 using
the EM algorithm [21]. Euclidean distance corresponds to assuming that thejare all equal multiples of the identity
matrix.
Starting from a finite mixture model (1), we define a prior over the mixing proportion parameters. The natural conjugate prior for mixing proportions is the symmetric Dirichlet distribution, with concentration parameter=k:
PðjÞ ¼ ðÞ
ð=kÞk
Yk
j¼1
=kj 1; ð2Þ
where controls the distribution of the prior weight assigned to each cluster, andis the gamma function.
We then explicitly include indicator variablesci for each
data point (i.e., gene expression profile) which can take on integer values ci¼j, j2 f1;. . .; kg, corresponding to the
hypothesis that data pointibelongs to clusterj. Under the mixture model, by definition, the prior probability is proportional to the mixing proportion:Pðci¼jjÞ ¼j. A
key observation is that we can compute the conditional probability of one indicator variable given the setting of all the other indicator variables after integrating over all possible settings of the mixing proportion parameters:
Pðci¼jjci; Þ ¼
Z
Pðci¼jjci; ÞPðjci; Þd
¼ni;jþ=k
n1þ ;
ð3Þ
whereciis the setting of all indicator variables except the ith, n is the total number of data points, and ni;j is the
number of data points belonging to clusterjnot includingi. By Bayes rule
Pðjci; Þ ¼PðjÞ=PðcijÞ
Y
‘6¼i
Pðc‘jÞ; ð4Þ
which is also a Dirichlet distribution, making it possible to perform the above integral analytically. We can now take the limit of k going to infinity, obtaining a Dirichlet process with differing conditional probabilities for clusters with and without data: For clusters where ni;j>0: pðci ¼jjci; Þ ¼nn1þi;j. For all other clusters combined: pðci 6¼ci0for alli06¼ijci; Þ ¼
n1þ. This shows that the
probabilities are proportional to the occupation numbers,
ni;j. Using these conditional probabilities, one can Gibbs
2.2 Data Preprocessing
All gene expression profile data were obtained from the web site http://www.rii.com/tech/pubs/cell_hughes.htm. Data from the treatment and mutant experiments were concatenated with the control (“wild-type”) experiments. To facilitate direct comparison of our results with pre-viously published work, profiles were selected from the raw data to include only experiments with two or more genes up or down-regulated by more than threefold, and significant at p0:01 under a gene-specific error model, as described by Hughes et al. [4]; and to include only genes that were up or down-regulated more than threefold, significant atp0:01in two or more experiments. Follow-ing Hughes et al. [4], missFollow-ing data were replaced by row (column) means.1 The final data set comprised 636 genes and 194 experiments (including controls).
2.3 Computational Experiments
For all data sets, the dimensionality of the data was first reduced by projecting the data onto the 10 leading eigen-directions of the correlation coefficient matrix. These 10 directions captured most of the variance in the data. This 10-dimensional projection of the data, y, was then modeled with the DPM model. A fully Bayesian approach to choosing the number of dimensions of the low-dimen-sional projection is beyond the scope of this paper; however, one possibility would be based on defining a DPM of factor analyzers, which combines clustering with dimensionality reduction [23]. We have experimented with using 5 and 15 directions in the projection; in both cases, the inference algorithm discovers fewer represented mixture components.
The parameters of the model were assigned prior distributions following [6]. The priors on the parameters of the Gaussian mixtures were conditionally conjugate, specifically Gaussian for the means and Wishart for the covariances (with top-level parameters set to the moments of the data, such that the entire procedure is insensitive to translation, rotation, and rescaling of the data). The prior on the concentration parameter was chosen to be vague, identical with [6].
The mixture model was initialized with all data belonging to a single Gaussian, and a large number of Gibbs sampling sweeps are performed, updating all variables and parameters, i.e., ffj;jg;fcig; g, in turn
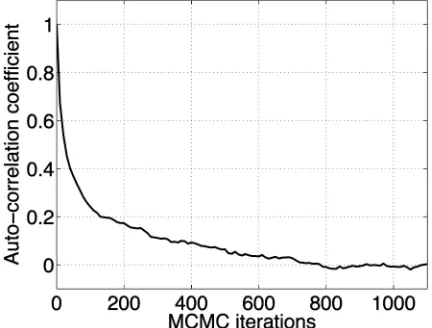
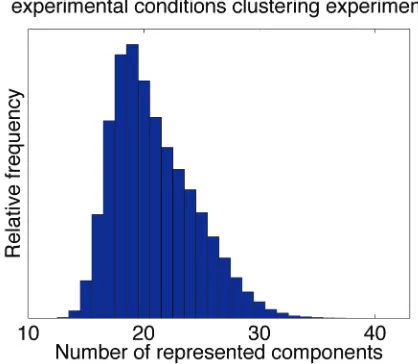
by sampling from the conditional distributions derived in the previous sections and described in more detail in [6]. To assess the mixing time, we examined the autocorrela-tion coefficients for the number of represented compo-nents (see Fig. 1). We chose the number of represented components as a diagnostic, as this is one of the properties of the state which changes most slowly. We estimated the mixing time as the sum of the autocorrelation coefficients from a large negative lag to large positive lag. For the transcript response clustering experiment, shown in Fig. 1, the mixing time is about 200. We then ran the final MCMC to generate 100 roughly independent samples, by using a burn-in of 10,000 samples, and then saving every
1,000th sample for the next 100,000 samples. This took 34 minutes on a desktop computer. For the clustering of experimental conditions, a similar strategy reveals a somewhat slower mixing time of 60,000. We thus ran the chain initially for 100,000 iterations for burn-in, and then for 11,000,000 samples, keeping every 100,000th to get 100 roughly independent samples. This takes about 11 hours on a desktop, but the results of a 100 times shorter run (6 minutes) are virtually indistinguishable.
2.4 Visualization of Results
We wish to determine the probability that two genes belong to the same cluster, i.e., have similar functional roles or are influenced by a common upstream factor. Unlike methods based on a single clustering of the data, the approach described in this paper computes this probability while taking into account all sources of model uncertainty (including number of clusters and location of clusters). Specifically, we use the probabilitypijthat two genesiandj
belong to the same cluster in the DPM model as a measure of the similarity of these gene expression profiles. Con-versely,1pij defines adissimilarity measure, which for the
purposes of visualization, can be input to one of the standard linkage algorithms used for hierarchical clustering (Fig. 6). We can easily compare the dendrograms thus obtained to the usual hierarchical clustering approach, which computes distance metrics directly on the gene expression profiles or correlation coefficients between profiles [1]. Clustering is done in both directions: both by gene transcripts and by experimental profiles.
2.5 Annotation of Clusters by Gene Ontology An important first step toward obtaining a functional profile of a gene list is to cluster the genes in terms of a comprehensive, well-structured set of functional categories such as that defined by the Gene Ontology (GO) Database. GO provides three structured ontologies of defined terms to describe gene product attributes: biological process, mole-cular function, and cell component. Groups annotated at the highest level in the GO hierarchy (biological process) are likely to contain genes involved in related pathways. In
[image:4.612.307.523.72.236.2]1. We note that a full Bayesian treatment of missing data would involve integrating over the missing values.
order to find statistically significant GO annotations related to a given cluster of genes, we looked for annotation terms that are overrepresented in this cluster. The probability that this overrepresentation is not found by chance can be calculated by the use of a hypergeometric test. Because of the effects of multiple testing, a subsequent correction of the
p-valuesis necessary, and we used the SGD GO Term Finder http://db.yeastgenome.org/cgi-bin/GO/goTermFinder [24], which applies a Bonferroni correction.
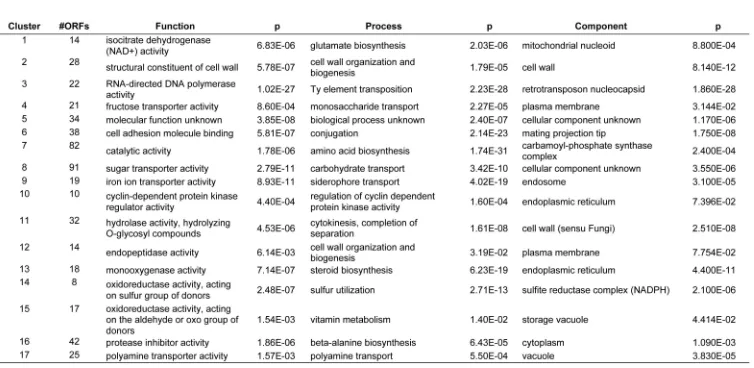
After identifying clusters and their members, the SGD GO Term Finder was used to determine whether clusters were overrepresented by particular cellular localization, molecular function, or molecular process GO terms. Absolute p-value depends on size of clusters and the size of the reference list, in this case, all yeast ORFs with an assigned GO term. The set of experimental clusters shrinks when we exclude double mutants, chemical treatments, and wild type profiles. It should also be noted that SGD GO Term Finder does not calculate underrepresented GO terms and this has not been considered here. It can be seen for some clusters that the assigned GO term may be either too specific or too general. For example, cluster 15 of the clustering of experiments has as its top molecular process GO term “physiological process,” a high-level ontology but not insightful. For the same cluster, the best molecular function GO term is given as “hydrolase activity, acting on carbon-nitrogen (but not peptide) bonds, in linear ami-des”—this is a low-level, highly specific function yet also not immediately insightful. Rather than focusing on the best hit alone, all significant GO terms are used to provide insight (see supplemental material, Tables 1, 2, 3, 4, 5, and 6, which can be found on the Computer Society Digital Library at http://doi.ieeecomputersociety.org/10.1109/ TCBB.2007.70269).
3
R
ESULTS ANDD
ISCUSSION3.1 Clustering by Transcript Response
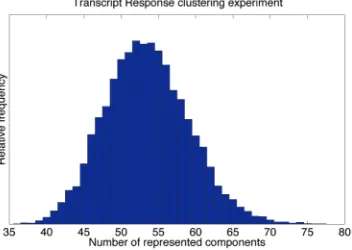
In all, 636 transcripts were found to meet the prefiltering criteria described in Section 2. That is, these genes are those most affected by the gene knockouts/treatments which constitute the experimental conditions. In Fig. 2, we show the relative frequency of the number of represented components over the MCMC samples. It shows that
between 40 and 70 components are likely. This wide range of number of clusters underlines our premise that the individual clusterings found are associated with substantial uncertainties. Rather than picking one particular clustering, in the following, we always visualize properties averaged over all states sampled by MCMC.
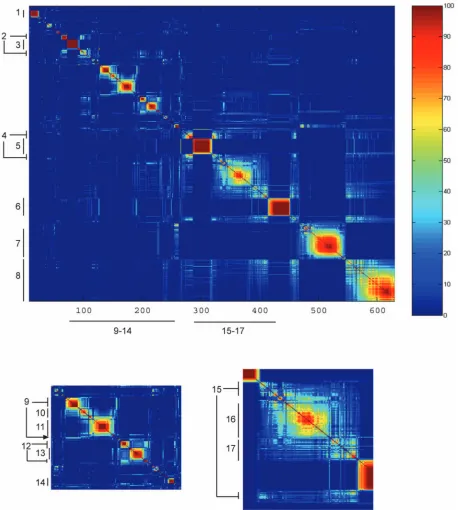
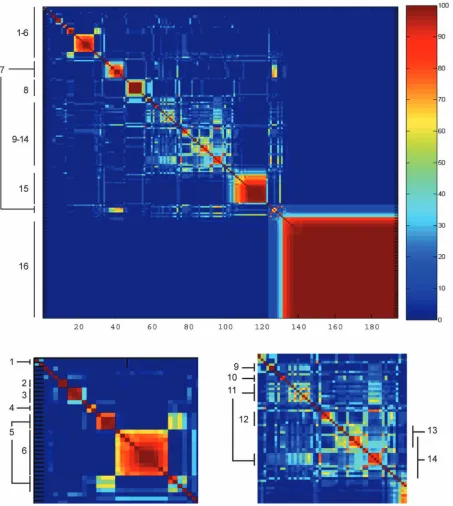
In Fig. 3, we show the number of times, out of 100 samples, that theindicator variablesfor two genes were equal. As described in Section 2, this may be interpreted as the probabilitypijthat two genesiandjbelong to the same
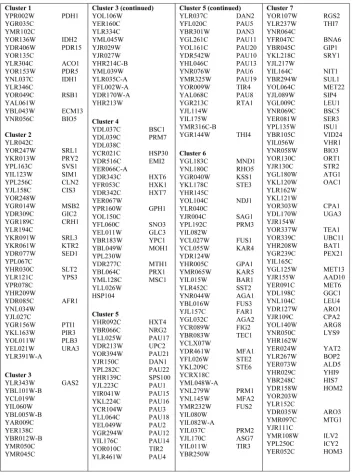
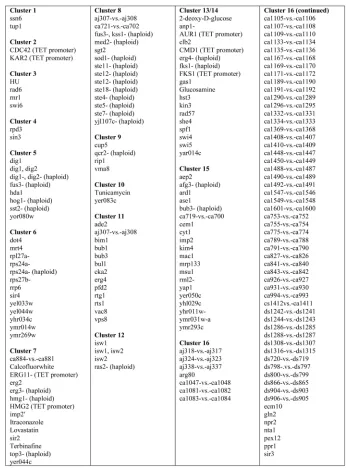
cluster, and the different colors represent this probability. We refer topij as theco-occurrence probabilityof genesiand j. The granularity of this clustering is determined by the data and not by some user-defined threshold. Large solid blocks of color along the diagonal correspond to homo-geneous clusters. Note that in our method, sequences may partially belong to more than one cluster; off-diagonal elements indicate such “cross-clustering” or overlapping clusters. These off-diagonal blocks (such as cluster 2 or 4 in Fig. 3) may indicate one of two possibilities: It may mean that there isuncertaintyin whether a set of genes should be assigned to one of the two clusters, or it may indicate a set of genes which should really belong simultaneously to two clusters. In this latter case, the fundamental assumption that a gene belongs to only one cluster does not apply, and suggests the existence of overlapping regulatory pathways. We focus on 17 transcript response clusters (TCs) repre-sented as blocks of color along the diagonal (cluster members are given in Tables 1 and 2). Of these, 11 clusters form a single group along the diagonal; while in five cases, the clusters are broken into subclusters (clusters 2, 4, 9, 12, and 15). These are seen as mirrored bands above the background color (dark blue) and off the diagonal. The subclusters indicate that, while their members are most closely linked, there is also simultaneously a weaker affinity for other clusters. Using the SGD GO Term Finder, we determined overrepresented GO terms for each of the 17 TCs. The top GO term and the p-value for each TC is given in Tables 3, 4, and 5. Significance is defined as
p <102.
[image:5.612.65.241.72.197.2]Hughes et al. [4] applied agglomerative hierarchical clustering using a correlation coefficient-based distance metric [1]. They identified eight main transcript response clusters: PAU, RNR2,3,4, ergosterol, amino acid biosynth-esis, calcineurin/PKC, mitochondrial function, mating, and S/C (general stress response and carbohydrate metabo-lism). The PAU cluster includes a family of genes noted only for their lack of serine residues, and for being induced during anaerobic growth, but which otherwise do not have a known function [25], [26]. The RNR cluster represents genes that respond to DNA damage. The following TCs in Fig. 3 appear to match with the following groups found by Hughes et al.: PAU (TC 5), RNR (TC 3), ergosterol (TC 13), mitochondrial function (TC 1), and mating (TC 6). The other clusters described by Hughes et al., in particular, the S/C cluster and amino acid biosynthesis cluster, are distributed over several TC clusters. In particular, TC 4 (monosacchar-ide transport), TC 7 (general amino acid biosynthesis), TC 8 (carbohydrate transport), TC 14 (sulfur metabolism), TC 15 (vitamin metabolism), TC 16 (beta-alanine biosynthesis),
and TC 17 (polyamine transport). As such, the DPM method was able to distribute the general S/C and amino acid biosynthesis groups into more specific clusters.
TC 2, TC 11, and TC 12 all exhibit significance for “cell wall,” “plasma membrane,” and “cytokinesis” GO terms. Examination of the cluster members suggests that TC 2 is involved in the formation of the mating bud. The best process GO term associated with TC 11 is “cytokinesis, completion of separation.” TC 12 is associated with process GO term “cell
[image:6.612.56.514.69.579.2]wall organization and biogenesis.” We note that for TC 5, the best hit for all three GO categories is “unknown.” Cluster 5 is a large group (32 transcripts) and contains 20 out of 21 PAU genes (PAU 7 appears in TC 8). TC 5 also contains five DAN/ TIR mannoprotein genes, which are typically part of the cell wall. This is in agreement with work indicating the importance of these sets of ORFs in cell wall integrity [27], suggesting that TC 5 is yet another “cell wall” cluster. This identification of a new cluster of “cell wall” transcripts
makes sense in light of the clustering of experimental conditions described below. While Hughes et al. identified a group of profiles collectively related to “cell wall,” the DPM clustering suggests that this large group forms smaller, distinctly regulated subclusters. Recent literature looking at cell wall proteins suggests that distinct functions—for example, controlling osmotic pressure, responding to phy-sical stress, maintaining cell wall integrity, and providing a protein scaffold—may share proteins and have overlapping regulatory mechanisms [27]. Furthermore, the signaling pathways involve cross talk among MAPK kinase pathways [28]. For example, sets of cell wall proteins, such as the PAU family, are activated by pheromone signaling, by global
stress signaling, as well as the calcineurin-mediated signal-ing, suggesting multiple modes of regulation.
[image:7.612.108.461.99.574.2]Likewise, rather than finding a single large group of transcripts specific to the PKC/calcineurin cluster as in [4], we find this group split among other TCs. Hughes et al. identified this group as comprising genes activated when yeast are treated with FK506 or cyclosporin-A. Both compounds affect calcineurin, a serine/threonine phospha-tase implicated in intracellular ion homeostasis, adaptation to mating pheromone treatment, and mitosis. However, the two compounds are thought to act through different path-ways. Hughes et al. list 42 transcripts as part of this PKC/ calcineurin gene cluster. Of these, we find 31 in five different TCs. Ten transcripts are found in TC 2 (cell wall), 11 in TC 12 (cell wall), eight in TC 16 (beta-alanine biosynthesis), and
one each in TC 4 (monosaccharide transport) and TC 5. It is known that PKC is part of a MAPK cascade involved in cell wall integrity. It has cross talk with other MAPK cascades including pheromone response, osmolarity, and filamentous growth. All told, five of the 17 TCs are associated with the cell wall. Recent work indicates that beyond providing structural support, components of the cell wall are involved in diverse functions from uptake of nutrients/metabolism to energy generation [28]. Likewise, formation of the shmoo during mating involves not only signal transduction by mating factor but also rearrangement of the cytoskeleton and cell wall.
Finally, we identified a cluster (TC 9) that does not appear to be covered by those defined by Hughes et al. The best GO term matches are “siderophore transport” (process
GO), “iron ion transporter activity” (function GO), and “endosome” (component GO).
3.2 Clustering by Experimental Conditions
Clustering of the expression profiles by experimental conditions identifies those yeast mutants or compounds that have similar effects on all transcripts. In Fig. 4, we show that a minimum of about 15 components is necessary, and the data supports up to about 30.
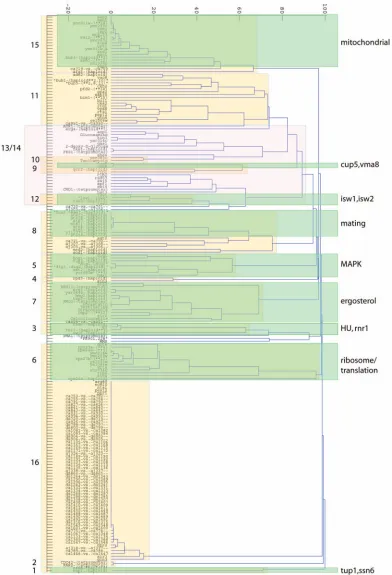
[image:8.612.108.454.96.564.2]Fig. 5 shows the clustering of the experimental condi-tions, which has an interpretation similar to that of Fig. 3. After prefiltering the 300 compendium experiments, 194 ex-pression profiles including 60 “wild types” remained. “Wild types” represent control experiments testing neither chemical treatment nor gene knockout, but yet had at least one ORF whose expression changed more than twofold.
TABLE 2
TABLE 3
[image:9.612.96.473.93.528.2]Summary of SGD GO Annotations for TCs
TABLE 4
[image:9.612.100.466.558.752.2]Summary of SGD GO Annotations for ECs
TABLE 5
(These were explicitly excluded from the cluster analysis of Hughes et al.)
From Fig. 5, 16 experiment clusters (ECs) are apparent. This is in contrast to the 13 identified by Hughes et al. [4]. As with the transcript response clustering, it can be seen that some clusters are bipartite (e.g., ECs 5, 7, and 11), and there is a region of diffuse clusters (ECs 9-14). Closer examination suggests there may be smaller clusters within this region. Also, two clusters (ECs 13 and 14) may be considered to be overlapping. In addition, a dendrogram using the dissimilarity measure defined above is shown in Fig. 6, which may be compared to the supplementary material of [4, Fig. 3B].
Apart from EC 1, other ECs correspond closely, although not exactly, to those identified by Hughes et al. For example, the Hughes et al. cluster rnr1/HU overlaps with our EC 3 with the exception of MMS. We both find a histone deacetylase group (EC 4), an ergosterol biosynthesis group (EC 7), a mating group (EC 8), a V-ATPase/iron regulation group (EC 9), and a mitochondrial group (EC 15). The “ribosome/translation” group identified by Hughes et al. overlaps with EC 6, which is associated with the molecular process GO term of “rRNA processing.”
A major difference between Hughes et al. and our DPM results involves profiles identified as “cell wall.” Hughes et al. identified 13 expression profiles as part of a “cell wall” group. However, we find three distinct clusters within this group. Knockouts for two tetracycline-driven genes, tet-KAR2 and tet-CDC42, cluster together as EC 2 with a co-occurrence probability close to 100 percent; this cluster does not overlap with any other. In addition, tunicamycin and yer083 form a cluster (identified as EC 10) with a co-occurrence probability around 85 percent, clearly apart from other profiles. Tunicamycin is thought to disrupt protein glycosylation in yeast [29], while yer083c has recently been identified as localized to the ER and involved in trafficking cell wall proteins [30], [31]. The remaining members appear in EC 13 which is associated with “incipient bud site” as its best component GO term. Thus, while all 13 members do
involve proteins associated with the cell wall, it may be seen that multiple processes or functions are being affected. Recent work has indicated the cell wall stress influences many genes through diverse signaling pathways and different transcription factors [27], [32].
Hughes et al. identify a single cluster containing the
sir mutants. Sir proteins are involved in global gene regulation through chromatin restructuring. However, by DPM clustering, we find each sir knockout in a different cluster: sir2 in EC 7 (ergosterol), sir3 in EC 16 (wild type), andsir4in EC 6 (rRNA processing). We note that association of sir2 with EC 7 is at a co-occurrence probability of 60 percent, and association of sir4 with EC 6 is at 30 percent. This suggests that while the SIR proteins are not strongly affiliated with any other group or each other globally, there may be a subset of specific transcripts that are strongly affected. It is possible that while there are few coregulated transcripts, their regulation may be highly similar. The expression profile of the
sir2mutant is most similar to that of imp2’ (YIL154C) at a co-occurrence probability close to 80 percent. Sir2p is involved in chromatin silencing; disruption causes pro-blems with DNA repair while slight overexpression in-creases the life span of yeast andC. elegans[33], [34]. It is known that caloric restriction increases Sir2p activity. Imp2p is a transcription factor that activates galactose, maltose, and raffinose utilization [35] as well as mediating oxidative damage to DNA [36]. Similarity in the expression profiles of these two mutants might be because the set of genes derepressed by thesir2mutant overlap somewhat with those regulated by Imp2p. Alternately, both mutants might exhibit similar global effects.
The isw1, isw2 group found by Hughes et al. contains four expression profiles (isw1, isw2, isw1/2, and hst3). We identify EC 12 containingisw1,isw1/isw2,isw2, andras2but instead puthst3 as part of the larger ECs 13/14. The ISW proteins are ATPases and are likely part of a protein complex involved in chromatin remodeling [37]. Ras2p is a GTP-binding protein involved in nitrogen starvation re-sponse, sporulation, and filamentous growth [38]. Hst3p is part of the Sir protein family of histone deacetylases and thought to be involved multiple functions including telomeric silencing [39]. As noted above, while Hughes et al. placed the Sir proteins into a single cluster, we find them distributed thought several clusters. However, exam-ination of the dendrogram (Fig. 6) indicates that EC 12 may be considered a “subcluster” within the larger ECs 13/14 and is joined to the subcluster containinghst3.
3.3 Discussion
Although the use of clustering methods (in particular, agglomerative hierarchical clustering) has rapidly become one of the standard computational approaches in the literature of microarray gene expression data, little attention has been paid touncertaintyin the results obtained.
[image:10.612.45.254.72.254.2]Kerr and Churchill [40] have proposed the use of a bootstrap method to assess the results of clustering in a statistically quantifiable manner. However, their approach requires the fitting of a linear statistical (ANOVA) model to the microarray data to obtain least squares estimates of the differential expression of a given gene, which are then used
as inputs to the bootstrap process. An alternative para-metric bootstrap approach has been described by Zhang and Zhao [41] which uses estimates of the standard errors in gene expression measurements to simulate data from a lognormal distribution. Hughes et al. [4] describe a permutation procedure to calculate p-values for the sig-nificance of branching in a dendrogram produced by agglomerative hierarchical clustering, under the null hypothesis that the branching was not significant. However, hierarchical clustering is a bottom-up algorithm. It starts
[image:11.612.60.513.69.575.2]with each data point assigned to its own cluster and iteratively merges the two closest clusters together until all the data belongs to a single cluster. Consequently, the results presented by Hughes et al. (supplementary informa-tion to [4, Fig. 3B]) only appear to show strong confidence for the branches at the lowest level of the dendrogram. In contrast, the dendrogram produced from the DPM proce-dure (Fig. 6) represents a full probabilistic measure of the (dis)similarity of two gene expression profiles.
DPM models provide a nonparametric Bayesian alter-native to the bootstrap approach to modeling uncertainty in gene expression clustering. Medvedovic et al. have applied infinite Gaussian mixture (or DPM) models to the clustering
[image:12.612.88.480.69.644.2]of time series gene expression data using spherical Gaus-sians with diagonal covariances [12], [13]. Similar ap-proaches have also recently been described in [16]. However, these approaches do not explicitly model the
correlations between subsequent time points which would be expected to occur in time series data, and the use of diagonal covariances may result in more clusters than necessary to model such correlations. Lui et al. have recently extended their previous work to use full-covariance models for time series [14]. Since these authors are clustering short time series, inference in the space of the original data is feasible. In contrast, in the complementary approach we describe here, we apply the DPM method to high-dimen-sional nontime series data. Inference is carried out in a low-dimensional projection of this space after low-dimensionality reduction by principal component analysis, which makes it possible to use Gaussians with full-covariance matrices, which would be very computationally expensive in the original high-dimensional space as each sampling step has a cubic computational dependency on the dimensionality.
Bayesian approaches to clustering gene expression data have recently received much attention. Heard et al. [42] propose an agglomerative clustering procedure for gene expression time series curves based on a Bayesian merging score, but unrelated to DPMs. Heller and Ghahramani [43] proposed a different Bayesian hierarchical clustering (BHC) procedure which implements a non-MCMC inference procedure for DPMs. This BHC algorithm can be used to scale DPM learning and inference to very large data sets at the cost of only partially representing the uncertainty in the cluster assignments. The MCMC procedure we present in this paper is more computationally demanding but captures more completely the sources of uncertainty. In [44], model-based clustering procedures model-based on loss functions are derived. An integer program is identified for finding a single clustering that best matches the posterior co-occur-rence probabilities.
Recently, Bidaut et al. [45] have reanalyzed the data of Hughes et al. using “Bayesian decomposition” to place the experimental profiles into patterns (clusters). The highest scoring (high persistence) genes in the patterns were annotated using the MIPS database [46] to assign the pattern to a cellular pathway. Fifteen patterns were discovered, six of which are assigned to MIPS pathways. Bidaut et al. find that ssn6 and tup1 appear in many of their patterns, albeit at low persistence. In contrast, with DPM modeling, we find that ssn6 and tup1 cluster together although weakly (EC 1—co-occurrence probability of 30 percent) and apart from other experimental profiles. This is reinforced by the dendrogram (Fig. 6) which shows while thetup1and
ssn6profiles cluster away from the others, they are yet on very long branches from each other. Clustering of these two knockouts is supported by the fact that Tup1p and Ssn6p are thought to form a protein complex. As previously men-tioned, both proteins are transcription factors involved in glucose/catabolic repression although with different but overlapping sets of targets [39].
Patterns 13 and 15 identified by Bidaut et al. [45] are given significance as distinguishing between those genes involved in MAPK signaling mating versus those involved in filamentous growth. While these are two distinct cellular functions, they share signaling components. Bidaut et al. suggest that these groups can be distinguished by whether the genes are regulated by Ste12p or the Ste12p-Tec1p complex. In our clustering of experimental conditions, all of the ste deletion mutants plus the fus3, kss1 double
mutant cluster together (EC 8—component GO term: mating projection). The fus3 single mutant appears in EC 8, together with other genes annotated by the GO molecular function term indicating MAPK activity. However, when we look at the top genes associated with the Bidaut patterns, six of the top 10 genes in pattern 13 are part of TC 6 (component GO: mating projection tip), while seven of the top 10 genes in pattern 15 are part of our TC 3 (component GO: retrotransposon nucleocapsid).
4
C
ONCLUSIONDPM models provide a nonparametric Bayesian alternative to the bootstrap approach to modeling uncertainty in gene expression clustering. Unlike methods based on a single clustering of the data, the approach computes the prob-ability that two genes belong to the same cluster while taking into account the main sources of model uncertainty, including the number of clusters and the location of clusters. Biologically plausible results are obtained from the Rosetta compendium of expression profiles which extend previously published cluster analyses of this data. Our results not only confirm many of the previously published clusters identified in this data set but also provide new biological insights by revealing a finer level of granularity in the clustering. In particular, our method was able to distribute general stress response and carbohy-drate metabolism and amino acid biosynthesis groups into more specific clusters. While previous analyses have identified a group of profiles collectively related to cell wall functions, our results also suggest that this large group forms smaller, distinctly regulated subclusters. These results are consistent with recent literature on cell wall proteins which suggests that distinct functions—for exam-ple, controlling osmotic pressure, responding to physical stress, maintaining cell wall integrity, and providing a protein scaffold—may share proteins and have overlapping regulatory mechanisms.
A
PPENDIX Additional files,. File 1—Tab-delimited file of Component GO terms for Transcript Response Clusters: Supp_ Table_1.txt,
. File 2—Tab-delimited file of Functional GO terms for Transcript Response Clusters : Supp_ Table_2.txt,
. File 3—Tab-delimited file of Process GO terms for Transcript Response Clusters: Supp_ Table_3.txt,
. File 4—Tab-delimited file of Component GO terms for Experimental Clusters: Supp_Table_4.txt,
. File 5—Tab-delimited file of Functional GO terms for Experimental Clusters: Supp_Table_5.txt,
. File 6—Tab-delimited file of Process GO terms for Experimental Clusters: Supp_Table_6.txt,
. File 7—Large version of Figure 3: Fig03-largeNew.tif,
. File 8—Large version of Figure 5: Fig05-largeNew.tif, and
R
EFERENCES[1] M. Eisen, P. Spellman, P. Brown, and D. Botstein, “Cluster Analysis and Display of Genome-Wide Expression,”Proc. Nat’l Academy of Sciences USA,vol. 95, pp. 14863-14868, 1998.
[2] U. Alon, N. Barkai, D. Notterman, K. Gish, S. Ybarra, D. Mack, and A. Levine, “Broad Patterns of Gene Expression Revealed by Clustering Analysis of Tumor and Normal Colon Tissues Probed by Oligonucleotide Arrays,”Proc. Nat’l Academy of Sciences USA,
vol. 96, pp. 6745-6750, 1999.
[3] G. McLachlan, R. Bean, and D. Peel, “A Mixture Model-Based Approach to the Clustering of Microarray Expression Data,”
Bioinformatics,vol. 18, no. 3, pp. 413-422, 2002.
[4] T. Hughes, M. Marton, A. Jones, C. Roberts, R. Stoughton, C. Armour, H. Bennett, E. Coffey, H. Dai, Y. He, M. Kidd, A. King, M. Meyer, D. Slade, P. Lum, S. Stepaniants, D. Shoemaker, D. Gachotte, K. Chakraburtty, J. Simon, M. Bard, and S. Friend, “Functional Discovery via a Compendium of Expression Profiles,”
Cell,vol. 102, pp. 109-126, July 2000.
[5] R.M. Neal, “Markov Chain Sampling Methods for Dirichlet Process Mixture Models,”J. Computational and Graphical Statistics,
vol. 9, pp. 249-265, 2000.
[6] C.E. Rasmussen, “The Infinite Gaussian Mixture Model,”Advances in Neural Information Processing Systems 12,S.A. Solla, T.K. Leen, and K.-R. Mu¨ller, eds., pp. 554-560, MIT Press, 2000.
[7] C. Antoniak, “Mixtures of Dirichlet Processes with Applications to Bayesian Nonparametric Problems,” Annals of Statistics, vol. 2, pp. 1152-1174, 1974.
[8] T. Ferguson, “A Bayesian Analysis of Some Nonparametric Problems,”Annals of Statistics,vol. 1, pp. 209-230, 1973.
[9] A.Y. Lo, “On a Class of Bayesian Nonparametric Estimates: I. Density Estimates,”Annals of Statistics,vol. 12, pp. 351-357, 1984. [10] M.D. Escobar and M. West, “Bayesian Density Estimation and
Inference Using Mixtures,”J. Am. Statistical Assoc.,vol. 90, no. 430, pp. 577-588, 1995.
[11] D.L. Wild, C.E. Rasmussen, Z. Ghahramani, J. Cregg, B.J. de la Cruz, C.-C. Kan, and K.A. Scanlon, “A Bayesian Approach to Modelling Uncertainty in Gene Expression Clusters,”Proc. Third Int’l Conf. Systems Biology (ICSB),2002.
[12] M. Medvedovic and S. Sivaganesan, “Bayesian Infinite Mixture Model Based Clustering of Gene Expression Profiles,” Bioinfor-matics,vol. 18, no. 9, pp. 1194-1206, 2002.
[13] M. Medvedovic, K.Y. Yeung, and R.E. Bumgarner, “Bayesian Mixture Model Based Clustering of Replicated Microarray Data,”
Bioinformatics,vol. 20, no. 8, pp. 1222-1232, 2004.
[14] X. Liu, S. Sivaganesan, K.Y. Yeung, J. Guo, R.E. Bumgarner, and M. Medvedovic, “Context-Specific Infinite Mixtures for Clustering Gene Expression Profiles across Diverse Microarray Dataset,”
Bioinformatics,vol. 22, no. 14, pp. 1737-1744, 2006.
[15] D. Dahl, “Model-Based Clustering for Expression Data via a Dirichlet Process Mixture Model,” Bayesian Inference for Gene Expression and Proteomics, K.-A. Do, P. Mu¨ller, and M. Vannucci, eds., Cambridge Univ. Press, 2006.
[16] Z.S. Qin, “Clustering Microarray Gene Expression Data Using Weighted Chinese Restaurant Process,” Bioinformatics, vol. 22, no. 16, pp. 1988-1997, 2006.
[17] A. Dubey, S. Hwang, C. Rangel, C. Rasmussen, Z. Ghahramani, and D.L. Wild, “Clustering Protein Sequence and Structure Space with Infinite Gaussian Mixture Models,” Proc. Pacific Symp. Biocomputing (PSB ’04), R.B. Altman, A.K. Dunker, L. Hunter, and T.E. Klein, eds., pp. 399-410, 2004.
[18] J. Hartigan,Clustering Algorithms.Wiley, 1975.
[19] K. Yeung, D. Haynor, and W. Ruzzo, “Validating Clustering for Gene Expression Data,”Bioinformatics,vol. 17, pp. 309-318, 2001. [20] D.J. Mackay,Information Theory, Inference and Learning Algorithms.
Cambridge Univ. Press, 2003.
[21] G. McLachlan and D. Peel,Finite Mixture Models.Wiley, 2000. [22] K. Yeung, C. Fraley, A. Murua, A. Raftery, and W. Ruzzo, “Model
Based Clustering and Data Transformations for Gene Expression Data,”Bioinformatics,vol. 17, pp. 977-987, 2001.
[23] D. Go¨ru¨r, “Nonparametric Bayesian Discrete Latent Variable Models for Unsupervised Learning,” PhD dissertation, Max Planck Inst. for Biological Cybernetics, 2007.
[24] E. Boyle, S. Weng, J. Gollub, H. Jin, D. Botstein, J. Cherry, and G. Sherlock, “Go::Termfinder-Open Source Software for Accessing Gene Ontology Information and Finding Significantly Enriched Gene Ontology Terms Associated with a List of Genes,”
Bioinformatics,vol. 20, no. 18, pp. 3710-3715, 2004.
[25] M. Viswanathan, G. Muthukumar, Y.S. Cong, and J. Lenard, “Seripauperins of Saccharomyces Cerevisiae: A New Multigene Family Encoding Serine-Poor Relatives of Serine-Rich Proteins,”
Gene,vol. 148, no. 1, pp. 149-153, 1994.
[26] N. Rachidi, M.J. Martinez, P. Barre, and B. Blondin, “Sacchar-omyces Cerevisiae PAU Genes Are Induced by Anaerobiosis,”
Molecular Microbiology,vol. 35, no. 6, pp. 1421-1430, 2000. [27] F. Klis, A. Boorsma, and P.D. Groot, “Cell Wall Construction in
Saccharomyces Cerevisiae,”Yeast,vol. 23, no. 185-202, 2006. [28] U. Jung and D. Levin, “Genome-Wide Analysis of Gene
Expression Regulated by the Yeast Cell Wall Integrity Signalling Pathway,”Molecular Microbiology,vol. 34, pp. 1049-1057, 1999. [29] W. McDowell and R. Schwarz, “Dissecting Glycoprotein
Biosynth-esis by Use of Specific Inhibitors,”Biochimie,vol. 70, pp. 1535-1549, 1998.
[30] A. Enyenihi and W. Saunders, “Large-Scale Functional Genomic Analysis of Sporulation and Meiosis in Saccharomyces Cerevi-siae,”Genetics,vol. 163, no. 1, pp. 47-54, 2003.
[31] M. Schuldiner et al., “Exploration of the Function and Organiza-tion of the Yeast Early Secretory Pathway through an Epistatic Miniarray Profile,”Cell,vol. 123, no. 3, pp. 507-519, 2005. [32] A. Boorsma, H. de Nobel, B. ter Riet, B. Bargmann, S. Brul, K.
Hellingwerf, and F. Klis, “Characterization of the Transcriptional Response to Cell Wall Stress in Saccharomyces Cerevisiae,”Yeast,
vol. 21, pp. 413-427, 2004.
[33] M. Kaeberlein, M. McVey, and L. Guarente, “The sir2/3/4 Complex and sir2 Alone Promote Longevity in Saccharomyces Cerevisiae by Two Different Mechanisms,”Genes and Development,
vol. 13, pp. 2570-2580, 1999.
[34] G. Blander and L. Guarente, “The sir2 Family of Protein Deacetylases,”Ann. Rev. Biochemistry,vol. 73, pp. 417-435, 2004. [35] J. Masson and D. Ramotar, “The Saccharomyces Cerevisiae imp2
Gene Encodes a Transcriptional Activator that Mediates Protec-tion against DNA Damage Caused by Bleomycin and Other Oxidants,”Molecular and Cellular Biology,vol. 16, no. 5, pp. 2091-2100, 1996.
[36] C. Donnini et al., “Imp2, a Nuclear Gene Controlling the Mitochondrial Dependence of Galactose, Maltose and Raffinose Utilization in Saccharomyces Cerevisiae,” Yeast, vol. 8, no. 2, pp. 83-93, 1992.
[37] J. Mellor and A. Morillon, “Iswi Complexes in Saccharomyces Cerevisiae,” Biochimica et Biophysica Acta, vol. 1677, nos. 1-3, pp. 100-112, 2004.
[38] T. Kataoka et al., “Genetic Analysis of Yeast ras1 and ras2 Genes,”
Cell,vol. 37, no. 2, pp. 437-445, 1984.
[39] R.L. Smith and A.D. Johnson, “Turning Genes Off by ssn6-tup1: A Conserved System of Transcriptional Repression in Eukaryotes,”
Trends in Biochemical Sciences,vol. 25, no. 325-330, 2000.
[40] M.K. Kerr and G.A. Churchill, “Bootstrapping Cluster Analysis: Assessing the Reliability of Conclusions from Microarray Experi-ments,” Proc. Nat’l Academy of Sciences USA, vol. 98, no. 16, pp. 8961-8965, 2001.
[41] K. Zhang and H. Zhao, “Assessing Reliability of Gene Clusters from Gene Expression Data,” Functional & Integrative Genomics,
vol. 1, pp. 156-173, 2000.
[42] N.A. Heard, C.C. Holmes, and D.A. Stephens, “A Quantitative Study of Gene Regulation Involved in the Immune Response of Anopheline Mosquitoes: An Application of Bayesian Hierarchical Clustering of Curves,”J. Am. Statistical Assoc.,vol. 101, no. 473, pp. 18-29, 2006.
[43] K.A. Heller and Z. Ghahramani, “Bayesian Hierarchical Cluster-ing,”Proc. 22nd Int’l Conf. Machine Learning (ICML),2005. [44] J.W. Lau and P.J. Green, “Bayesian Model Based Clustering
Procedures,”J. Computational and Graphical Statistics,vol. 16, no. 3, pp. 526-558, 2007.
[45] G. Bidaut, K. Suhre, J.-M. Claverie, and M. Ochs, “Determination of Strongly Overlapping Signaling Activity from Microarray Data,”BMC Bioinformatics,vol. 7, pp. 99-111, 2006.
Carl Edward Rasmussenreceived the master’s degree in engineering from the Technical Uni-versity of Denmark and the PhD degree in computer science from the University of Tor-onto, Canada, in 1996. Since then, he has been a postdoctoral researcher at the Technical University of Denmark, a senior research fellow in the Gatsby Computational Neuroscience Unit, University College London from 2000 to 2002, and a junior research group leader at the Max Planck Institute for Biological Cybernetics, Tu¨bingen, Germany, from 2002 to 2007. He is a lecturer in the Computational and Biological Learning Lab, Department of Engineering, University of Cambridge, and an adjunct research scientist at the Max Planck Institute for Biological Cybernetics, Tu¨bingen. His main research interests include Bayesian inference and machine learning.
Bernard J. de la Cruz received the BA
degree in biology from the University of California, Santa Cruz, and the PhD degree in biology from the University of California, San Diego. He was a postdoctoral research fellow at the Keck Graduate Institute, studying the metabolism and genome of the yeast Pichia pastoris. His research interests include metabolic regulation of genes and analysis of microarray data. He is currently in the Beck-man Research Institute at the City of Hope.
Zoubin Ghahramanireceived the BA and BSE degrees from the University of Pennsylvania and the PhD degree from MIT, in 1995, working with Professor Mike Jordan. He is a professor of information engineering at the University of Cambridge, Cambridge, United Kingdom, and is also an associate research professor of machine learning at Carnegie Mellon University, Pittsburgh. He did his postdoctoral work in computer science at the University of Toronto, working with Professor Geoff Hinton. He was a faculty member in the Gatsby Unit, University College London from 1998 to 2005. His work has included research on human sensorimotor control, cognitive science, statistics, and machine learning. His current interests include Bayesian approaches to statistical machine learning, nonparametric methods, graphical models, and approximate inference. He is also actively working on applications of machine learning to bioinformatics and information retrieval. He has published more than 100 peer-reviewed papers. He serves on the editorial boards of several leading journals in the field, including theJournal of Machine Learning Research,Annals of Statistics, the Journal of Artificial Intelligence Research, Machine Learning,Foundations and Trends in Machine Learning, andBayesian Analysis. He is an associate editor-in-chief of theIEEE Transactions on Pattern Analysis and Machine Intelligence, serves on the board of the International Machine Learning Society, and was the program chair of the 2007 International Conference on Machine Learning.
David L. Wild received the BA degree in physics from the University of York and the DPhil degree in molecular biophysics from the University of Oxford. He has extensive experi-ence in structural and computational molecular biology. He has worked in the European Molecular Biology Laboratory, the Salk Institute, and in industry with Allelix Biopharmaceuticals, Oxford Molecular, and GlaxoWellcome. He is currently a professor of bioinformatics at the University of Warwick Systems Biology Centre and an adjunct research professor at the Keck Graduate Institute of Applied Life Sciences. His research interests include bioinformatics, systems, and structural biology.