MASTER THESIS
IMPROVING TRANSPORT
OF ELDERLY AND PEOPLE
WITH DISABILITIES IN
DRENTHE
Koen Sonnenberg
INDUSTRIAL ENGINEERING AND BUSINESS INFORMATION SYSTEMS
EXAMINATION COMMITTEE
Dr. Ir. J.M.J. Schutten
Dr. Ir. M.R.K. Mes
EXTERNAL ADVISOR
Ing. André Oldenburger
Summary
This thesis is centred on the transportation system for elderly and people with disabilities in the southeast area Drenthe, The Netherlands. Since the beginning of 2014, the municipalities of Borger-Odoorn, Coevorden and Emmen (BOCE) have been joining forces to put effort into improving the transportation system of elderly and people with disabilities. To allow for these frail groups of society to equally engage in social environments, demand-responsive transportation (DRT) systems have been tailored to service specific user requests. One such DRT system is subsidized by several municipalities in the southeast region of Drenthe, The Netherlands. This system is meant to serve people who are not self-reliant enough to use conventional public transport. These people are eligible for WMO support, named after the Dutch law.
To improve the efficiency of WMO transport in the area under study, we need to address several research problems. We know that a few destinations are visited frequently by elderly and people with disabilities. Organizations at these destinations can arrange for groups to visit their locations together by shifting transportation requests from the passengers to the organizations that these passengers visit. In order to establish for which organizations this is possible, we need to overcome the geocoding problem, i.e., various notations refer to similar addresses. Furthermore, some organizations are more suited for a shift of transportation requests than others. Once we have an idea of potential organizations, we want to know the yield of shifting transportation requests from the passengers to these organizations, in comparison to the current situation. To test our hypothesis of improved transport efficiency, we have formulated the following research problem:
- In which way and to what degree can the efficiency of transport of elderly and people with disabilities be improved, by shifting transportation requests from the passengers to the organizations that these passengers visit?
To solve this problem, we have formulated the following research questions:
1. How is transport of elderly and people with disabilities organized in the current situation? 2. How can literature help to solve our research problem?
3. For which kind of organizations is a shift of transportation requests from the passengers to the organizations that these passengers visit possible?
4. To what degree can the efficiency of transport of elderly and people with disabilities be improved, by shifting transportation requests from the passengers to these organizations? The current system provides around 6,000 elderly and people with disabilities with door-to-door service whenever they need it, but only half of them request a trip more than once a month. In total, more than 200,000 trips are driven each year, which adds up to 1.8 million kilometres. An average trip spans a distance of 8.5 kilometres and lasts 23 minutes between pick-up at one location and drop-off at another location. The price of each trip starts at €5.60 and another €1.40 is charged for every kilometre. This adds up to €17.50 for an average trip, which is almost completely charged to
the respective municipality. We conclude that the occupation of a typical WMO taxi bus rarely exceeds 2 passengers during busy hours.
longest common substring algorithm. Our method is unique with respect to the preparation procedure, splitting common prefixes and suffixes from street entries, enabling us to compare only the differentiating middle part of a street entry. The structure of our method can easily be adapted to fit data from other geographic areas. The adjustments that the method makes can be verified and corrected if needed.
Based on a list of unique address notations, we construct a top 50 of organizations in the transport of elderly and people with disabilities in Drenthe, The Netherlands. Remarkably, this small selection of organizations turns out to be responsible for roughly 50% of all transport in terms of trips, distance and travel time. Some of these organizations are more suitable for a shift of transportation requests than others. Therefore, we introduced a set of criteria on which to evaluate each
organization in our top 50. Based on these evaluations, we classified various types of organizations that show potential to engage in the transportation process. Most types of organizations can be found in every transportation system for elderly and people with disabilities across the globe. The types of organizations that have the highest potential are day care centres, community centres and other facilities for day care activities. Requests for transport to these organizations often share the same purpose and schedule, and both passenger and organization share a common interest. To asses to what degree the efficiency of transport can be improved by shifting transportation requests from the passengers to the organizations that these passengers visit, we identify the case of 5 community centres in Klazienaveen, each hosting a game of bingo between 7 and 9 pm on different days of the week. Based on the idea that communities can play an important role in the transport of elderly and people with disabilities, we introduce the concept of a bingo bus. For each day of the week, we design efficient routes along which regular customers of the respective
community centre are to be picked up and dropped off again at the end of the evening. These routes take into account the capacity of a typical WMO taxi bus and the total time that passengers spend both inside and outside the vehicle. In the present system, multiple different vehicles are deployed, each serving a single passenger. The bingo bus can potentially serve more than 90% of all current transport requests on its own, giving this alternative means of transport an overall advantage. To
break even, the bingo bus service is allowed to cost €1.79 per driven kilometre. Through analysis of similar cases in this or in other geographic areas, efficient transport schemes can be developed and implemented gradually to accommodate the transport of elderly and people with disabilities. Demand-responsive systems have largely proven to be sustainable in terms of the environment and social needs requirements. However, economic viability is still a big issue. Given that a large
Preface
For the period of a year, I’ve been allowed to conduct my thesis at Infostructure B.V., Rijswijk. My
supervisors at the University of Twente introduced me there to André Oldenburger, who familiarized me with a network of colleagues and clients. Soon, I benefitted from the cooperation with members of the BOCE municipalities, who assigned me the subject of this thesis. Additionally, I spent some time at Geon B.V., Groningen, to get acquainted with the SQL database language and GIS
Content
Summary ... Preface ...
1 Introduction ... 1
1.1 Research motivation ... 1
1.2 Problem definition ... 2
1.3 Research Design ... 3
1.3.1 Research objective and research questions ... 4
1.3.2 Research scope... 4
1.3.3 Research approach ... 5
1.4 Summary and thesis outline ... 6
2 Context Analysis ... 7
2.1 Current situation ... 8
2.2 Current system performance ... 8
2.2.1 Summary of data ... 8
2.2.2 WMO trip frequency ... 10
2.2.3 Vehicle Occupancy ... 13
2.3 Conclusion ... 16
3 Literature ... 17
3.1 Background of DRT... 17
3.2 Network design ... 18
3.2.1 Strategic decisions ... 18
3.2.2 Tactical decisions ... 20
3.3 Dial-a-ride Problem ... 23
3.4 Geocoding Problem ... 26
3.5 Summary and Conclusions ... 28
4 Method ... 29
4.1 Solving the geocoding problem ... 29
4.1.1 Choice of string similarity measure ... 30
4.1.2 Preparation phase ... 31
4.1.3 Method ... 34
4.1.4 Results ... 36
4.2 Classification method of organizations ... 38
4.3 Summary and conclusions... 44
5 Solution & Implementation... 45
5.2 Case analysis ... 48
5.3 Business case: Bingo bus ... 51
5.4 Summary and conclusions... 60
Summary and conclusions ... 61
Recommendations ... 63
References ... 64
Appendix 1.1: Longest common substring algorithm ... 70
Appendix 1.2: Preparation Procedure ... 71
Appendix 1.3: Method to sort cities based on similarity... 74
Appendix 1.4: Method to change street names ... 75
Appendix 2: Visitor patterns of organizations ... 76
Appendix 3: Analyses of community centres ... 86
1
1 Introduction
This thesis is centred around the transportation system for elderly and people with disabilities in Drenthe, The Netherlands. Since the beginning of 2014, the municipalities of Borger-Odoorn, Coevorden and Emmen (BOCE) have been joining forces to put effort into improving the
transportation system of elderly and people with disabilities. This chapter is subdivided into four sections. Section 1.1 outlines the research motivation. Section 1.2 discusses the problem definition. Section 1.3 explains the research design. Section 1.4 gives a summary and provides the outline of this thesis.
1.1
Research motivation
In the context of an ageing population globally, Al-Shaqi, Mourshed, and Rezgui (2016) stress the importance of “easy access to the social environments (e.g. healthcare facilities, care support, supermarkets, cultural centers and places to socialize)”. Access to these environments proves to be a growing concern among elderly and people with disabilities, as research in several countries
indicates (Higgins et al., 2015) (Mulumba et al., 2014). The restricted mobility of these people constitutes a considerable barrier to effectively use a transportation system (Sundling et al., 2014). The needs of elderly and people with disabilities should be taken seriously in order to give these people the same level of access to services as others. Even though legislation over the past decades has focussed on the non-discrimination of these frail groups of society, discrimination remains widely perceived by elderly and people with disabilities (Rogers et al., 2015). In particular, difficulties of enduring the discomforts of travel and securing a means of transportation are especially affecting vulnerable people (Reif, DesHarnais, & Bernard, 1999). See Figure 1 for an illustration of special transport requirements of elderly and people with disabilities.
2 other travel purposes. To facilitate in this need, flexible transport services (FTS) have emerged that bridge the flexibility gap between conventional fixed-route buses and taxis. More specifically, demand responsive transport services (DRT), which are based on specific user requests, have been introduced to address the special transport requirements of elderly and people with disabilities. One such DRT system is subsidized by several municipalities in the southeast region of Drenthe, The Netherlands. This system is meant to serve people who are not self-reliant enough to use
conventional public transport. These people are eligible to use this so called WMO transport, named after the Dutch law that provides support for elderly and handicapped people. Every person that is eligible for WMO support is free to use the WMO transport system at any time. Whenever the user needs to go somewhere, he or she simply calls for an appointment. A taxi or taxi-bus driver will then pick up the person at a designated time and place, providing assistance from door to door. The user pays a small contribution while the rest is paid for by the municipality.
Since the beginning of 2014, the municipalities of Borger-Odoorn, Coevorden and Emmen (BOCE) have been joining forces to put effort into improving the WMO system. In this regard, a
representative of BOCE has challenged us to come up with a solution to make the DRT system for elderly and people with disabilities more cost-effective. We know that some destinations are visited more often than others, particularly service facilities such as hospitals and day care institutions. Some of these locations are visited throughout the entire day and for many different reasons. On the other hand, several locations might be visited on specific times of the day, enabling a more efficient deployment of vehicles to that location. For example, if ten people visit a physiotherapist on a Monday morning for a group session, it makes sense to dispatch two buses instead of ten different taxis. The physiotherapist could encourage this by making group arrangements for transport. Within BOCE, there is a need to explore the potential of involving service facilities, such as the one in the example, in the planning and execution of WMO transport. This way, the BOCE communities aim to improve the quality of service for elderly and people with disabilities, while at the same time making the transport system more efficient.
1.2
Problem definition
Before we continue to elaborate on the research design, we first define the problem we want to solve. As the reason for improvement of the DRT system for elderly and people with disabilities stems from a continuous drive to improve the overall quality of the service system, demarcation of the core problem is not evident. First of all, the quality of a DRT system is related to many different aspects, from the perceived quality of users to the occupancy rates of vehicles. In the DRT system under study, the taxi company that provides the WMO service is restricted to a number of rules to assure a certain quality level. For example, time-windows at pick-ups serve as upper bounds to the waiting times of customers. Furthermore, the extra ride-time of a passenger, related to the pick-up of another passenger during a trip, is also restricted. Other factors that affect the perceived quality of users include comfort and flexibility of transport, such as the possibility to bring a wheel chair or an accompanying person. Early studies have shown how the mere design of vehicles can enhance these quality factors (Petzäll, 1993).
3 constraints is, for example, studied by Diana, Dessouky, and Xia (2006). The efficient deployment of vehicles and drivers is directly linked to various cost aspects of the DRT system. It is therefore in the interest of both the BOCE community and the taxi company to efficiently deploy vehicles. One way to look at this problem is to examine the information about transport requests we know
beforehand. For example, if we knew that a number of people had to visit a day care facility at a certain time of the day, the day care facility could arrange for daily group transports. Furthermore, within that same day care facility, people from a similar area could be grouped on the same day. This form of clustering is also applied in Dutch high school classes to ensure that children can travel to school together. This way, the transport requests of WMO users could be directed towards a certain time or location. In effect, this would mean a shift in demand for transport from a single user to an organization that arranges transport for an entire group of WMO users. Interviews with
representatives of both the BOCE municipalities and the taxi company indicate there is currently no active pursuit of such opportunities. This leaves us to question whether the deployment of vehicles for WMO transport is optimal, or perhaps, far from it.
A preliminary literature study, together with an initial analysis of WMO data that have been provided by the BOCE communities, revealed the following:
- Registration of transport is based on single customer requests for WMO transport from one location to another. The shortest distance from one location to another, rather than actual distances, is used to calculate prices.
- Roughly, only 70% of departure addresses and only 70% of arrival addresses can be linked to BAG coordinates (Dutch database for administration of buildings), which we refer to as the geocoding problem. This means there are many variations in zip codes and addresses within the data provided.
- Looking at geographic destination coordinates from the first four months of 2013, the 14 most frequently visited of 5000 different destinations in total account for 20% of all requests for transport. The 92 most frequently visited destinations account for 40%.
- In 2012/2013, only about 900 requests for transport of 200,000 in total have the same group ID, which means the transport of these passengers is carried out at the same time in the same vehicle. Such a group ID cannot be found in data of 2014/2015. This makes it difficult to accurately assess the occupancy of vehicles used for WMO transport, although the 2012/2013 numbers suggest combinations of customer requests are rare.
- Literature presents several models to enhance the cost-effectiveness of DRT systems and to make services more accessible for elderly and people with disabilities. However, no theory suggests an active role of organizations in the deployment of WMO transport, such as mentioned in our examples.
These preliminary results strengthen the idea that the deployment of WMO vehicles in the southeast region of Drenthe is not optimal. Although most of the WMO transport requests are linked to a small number of destinations, no effort is currently being made to involve the organizations at these destinations in the pursuit of efficient vehicle deployment. This observed discrepancy leads to the research design of this thesis.
1.3
Research Design
4
1.3.1
Research objective and research questions
To improve the efficiency of WMO transport in the southeast region of Drenthe, The Netherlands, we need to address several research problems. Our findings in Section 1.2 suggest that only a few destinations are visited frequently by elderly and people with disabilities. We discussed several examples of how transportation requests can be shifted from the passenger to the organizations at these destinations, in order to improve transport efficiency. However, we still need to establish which destinations, and therefore which kind of organizations, are visited frequently. In the process, we need to overcome the observed geocoding problem. Furthermore, some organizations are more suited for a shift of transportation requests than others. Once we have an idea of potential
organizations, we want to know the yield of shifting transportation requests from the passenger to these organizations, in comparison to the current situation. To test our hypothesis of improved transport efficiency, we have formulated the following research problem:
- In which way and to what degree can the efficiency of transport of elderly and people with disabilities be improved, by shifting transportation requests from the passengers to the organizations that these passengers visit?
To solve this problem, we have formulated the following research questions:
1. How is transport of elderly and people with disabilities organized in the current situation? 2. How can literature help to solve our research problem?
3. For which kind of organizations is a shift of transportation requests from the passengers to the organizations that these passengers visit possible?
4. To what degree can the efficiency of transport of elderly and people with disabilities be improved, by shifting transportation requests from the passengers to these organizations? Efficiency of transport can be perceived differently by passengers, organizations, municipalities or the taxi company. It very much depends on the type and perspective of implementation. For example, if actual distances driven decrease, but the origin and destination pairs on which reported distances are based remain the same, then the taxi company is driving more efficiently, even though the municipality and the passengers pay the same. If on the other hand, taxi services are partly substituted by voluntary services, then it is a whole other story. To compare efficiency of transport, we look at various key performance indicators such as the number of passengers per vehicle and the cost against which a service can be provided.
1.3.2
Research scope
- Our research focusses on the southeast region of Drenthe, The Netherlands, comprising the WMO transport financed by the municipalities of Borger-Odoorn, Coevorden and Emmen (BOCE). We are convinced that a region as comprehensive as this, comprising both urban as well as rural areas, is representative for at least most regions in the Netherlands.
5
1.3.3
Research approach
To achieve our research objective, the research questions are answered one by one. As each of the research questions aims to find particular knowledge, we need to address them separately:
1. How is transport of elderly and people with disabilities organized in the current situation? By answering this question, we want to get a broad understanding of the current system. First, we perform queries on the WMO database to extract the necessary information needed for zero-measurement purposes. Second, we look into relational patterns between passengers and the destinations they visit. We also describe the problem of geocoding these destinations. To better understand the data, we conduct informal interviews with
representatives of BOCE and the taxi company. For the information that we cannot retrieve from the data or from interviews, we make some assumptions.
2. How can literature help to solve our research problem?
We perform a literature study to study various aspects related to our research problem. First, we look at strategic and tactical aspects involved in transportation network design. Second, we study literature related to a DRT system, but we also examine the vehicle routing problem that is used to solve such a system to optimality. Finally, we look into algorithms to overcome the observed geocoding problem. This enables us to determine which kinds of organizations are visited frequently by elderly and people with disabilities.
3. For which kind of organizations is a shift of transportation requests from the passengers to the organizations that these passengers visit possible?
We construct a classification method of organizations to determine which kinds of
organizations are suitable for a shift of transportation requests from the passengers to the organizations. First, we apply a method to overcome the observed geocoding problem. Based on the output of this method, we establish which kind of organizations are visited frequently in the transport of elderly and people with disabilities. These organizations are then compared on the basis of several criteria to determine which kinds of organizations are potentially suited for a shift of transportation requests, and which are not.
4. To what degree can the efficiency of transport of elderly and people with disabilities be improved, by shifting transportation requests from the passengers to the organizations? By answering this last research question, we examine whether a more efficient deployment of vehicles is attainable for organizations labelled as potential candidate. First, we select a case based on our classification method. Second, we construct a business case to
6
1.4 Summary and thesis outline
7
2 Context Analysis
[image:13.595.71.482.194.736.2]In the previous chapter, we discussed the relevance of our research and we explained the research design of this thesis. To improve the efficiency of transport of elderly and people with disabilities, several research questions have been formulated. The first of those questions is answered in this chapter. To determine how and to what degree transport efficiency can be improved, we first look at the current situation in the area under study. Section 2.1 explains how the transport of elderly and people with disabilities is currently organized in Drenthe, The Netherlands. Section 2.2 discusses how the current system performs. In Section 2.3 we present a short summary and conclusions.
8
2.1 Current situation
Given the scope of this thesis, we examine the transport of elderly and handicapped people in the southeast region of Drenthe, The Netherlands. This area is demarcated in Figure 2.
From the first of August 2010, Taxi Dorenbos B.V. is (by tender) granted exclusive rights in Borger-Odoorn and from the first of January 2011 also in Coevorden and Emmen. Originally, this contract would end in December of 2014. However, because of pressuring changes in budgets and
requirements, the transport agreement has been extended multiple times to mid-2017. This means that, at the moment of writing, Taxi Dorenbos B.V. is still the sole provider of WMO transport in these regions.
The Dutch WMO law provides support to elderly and handicapped people who lack the ability to be fully self-reliant. One of the WMO rights is to apply for a WMO transport ID, which in this particular area, allows for unlimited access to the taxi service of Taxi Dorenbos. This works as follows.
Whenever a person needs to go somewhere, he or she calls at least 1 hour in advance to make an appointment for a pick-up time and location. The place of destination is also communicated for planning purposes. A time window of 30 minutes ensures that the pick-up will occur at most 15 minutes early or 15 minutes late. The taxi company is rewarded financially for the percentage of trips starting on time. At pick-up, the taxi driver accompanies the passenger to his or her seat in the taxi bus. A typical WMO taxi bus offers six normal seats and two places for wheelchairs and such alike. During a trip, the driver is allowed to make a detour of at most thirty minutes to pick up other passengers. At drop-off, the driver again accompanies the passenger from seat to front door. Travelled distances are measured based on the fastest route on public roads. The commercial price for a trip begins at a pick-up fee of €5.60. Per kilometre, a price of €1.40 is added to this price. All prices include taxes. With a WMO ID card however, the starting fee is reduced to a mere €0.88 and a kilometre price of only €0.16. The difference is paid for by the municipality.
2.2 Current system performance
In this section, we determine the current efficiency of the transport of elderly and people with disabilities in Drenthe, The Netherlands. Section 2.2.1 gives a summary of the data. Section 2.2.2 analyses trip frequency and Section 2.2.3 estimates current system performance in terms of vehicle occupancy.
2.2.1 Summary of data
The subject of analysis consists of transport data gathered over the period from January 1, 2014 until May 31, 2015. Access to the data was provided to us in January 2016. As stated before, the
registration of transport is based on single customer requests for WMO transport. From here on, we define each request for transport from one location to another as a trip. Each trip is described in over 100 different columns of data. A trip basically consists of a passenger ID, departure and arrival information such as time and location, distance travelled and related costs. Furthermore, a
standardized set of zeros and ones denotes whether certain conditions apply. For example, 15% of all trips reports the presence of a walker and 10% a(n) (electric) wheelchair. Other conditions are rare. For some trips, additional information is provided, such as a destination synonym such as
9 data only describe trips until the end of May, just as the data of 2015 do. Therefore, for the purpose of comparison, totals have been provided for these periods only. For completeness, the differences between 2014 and 2015 as a whole are shown as well, albeit artificial, since the 2015 numbers are simply extrapolated based on the differences between the first five months and the total of 2014.
Period Trips Distance (km) Time (h) Travel Time (h)
2013 until May 31 98,528 834,119 37,754 30,717
2014 until May 31 94,584 800,914 36,172 29,617
2015 until May 31 92,912 753,235 35,781 28,923
2014 219,680 1,882,847 84,680 69,365
2015 (forecast) 215,797 1,770,761 83,765 67,740
Table 1: Trips, distances and times compared over different years
Table 2 encompasses the same periods, only here we see averages, rather than summations. This gives us insight into an average WMO trip in the southeast region of Drenthe, The Netherlands. The total time is the sum of travel time and transfer time.
Period Average
Distance (km)
Average Total Time (min)
Average Travel Time (min)
Average Transfer Time (min)
2013 until May 31 8.5 23.0 18.7 4.3
2014 until May 31 8.5 23.0 18.8 4.1
2015 until May 31 8.1 23.1 18.7 4.4
2014 8.6 23.1 18.9 4.2
2015 (forecast) 8.2 23.3 18.8 4.5
Table 2: An average WMO trip
Looking at Table 2, we see no clear difference over time in trip efficiency. Therefore, it is easy to infer from Table 1, that the drop in total time and travel distance over the past few years can only be explained by the decline in the number of trips over these years.
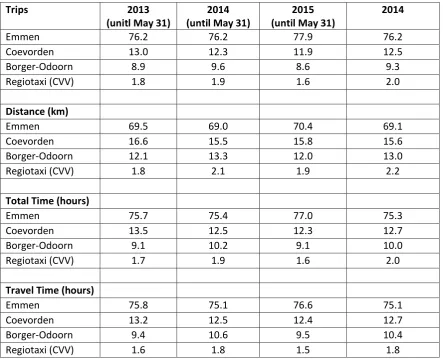
In Table 3, we split the numbers by municipality that pays for the transport in question. This is based on the home address of the passenger that requests the transport. For clarity, the numbers have
been translated into percentages. For the reader’s information, Regiotaxi (CVV) is transport not specifically used for the transport of elderly and people with disabilities. One example is the transport of asylum seekers. Every municipality uses a separate WMO ID to register trips for such purposes. Therefore, these trips are included in the WMO data. However, because it is less relevant for our research, in Table 3, we merely show the sum of Regiotaxi (CVV) over the three
10
Trips 2013
(unitl May 31)
2014 (until May 31)
2015 (until May 31)
2014
Emmen 76.2 76.2 77.9 76.2
Coevorden 13.0 12.3 11.9 12.5
Borger-Odoorn 8.9 9.6 8.6 9.3
Regiotaxi (CVV) 1.8 1.9 1.6 2.0
Distance (km)
Emmen 69.5 69.0 70.4 69.1
Coevorden 16.6 15.5 15.8 15.6
Borger-Odoorn 12.1 13.3 12.0 13.0
Regiotaxi (CVV) 1.8 2.1 1.9 2.2
Total Time (hours)
Emmen 75.7 75.4 77.0 75.3
Coevorden 13.5 12.5 12.3 12.7
Borger-Odoorn 9.1 10.2 9.1 10.0
Regiotaxi (CVV) 1.7 1.9 1.6 2.0
Travel Time (hours)
Emmen 75.8 75.1 76.6 75.1
Coevorden 13.2 12.5 12.4 12.7
Borger-Odoorn 9.4 10.6 9.5 10.4
[image:16.595.72.516.70.429.2]Regiotaxi (CVV) 1.6 1.8 1.5 1.8
Table 3: Division of trips, distances and times among BOCE
Although the information presented in Table 3 is comprehensive, the underlying pattern is clear. More than 75% of all trips can be attributed to Emmen. Furthermore, the share of Emmen is steadily growing as where the share of Coevorden is declining. Indirectly, comparing trips and distances, we can also deduct that distances travelled by WMO clients in Coevorden and Borger-Odoorn are greater than the distances travelled by WMO clients in Emmen. This might of course be due to the fact that Emmen, as the biggest city, houses a lot more services, where WMO clients, also from outside of Emmen, make use of.
2.2.2 WMO trip frequency
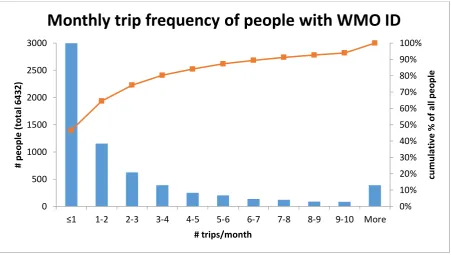
About 10,000 people are currently in the possession of a WMO ID, however, only about 6,000 have been registered to have made at least 1 taxi trip within the period of analysis. See Figure 3 for more details. On the horizontal axis we find the amount of trips people make in a month. The left vertical axis corresponds to the bars of the histogram. The right vertical axis corresponds to the cumulative line in the graph. In the analysis of each graph in this section, we relate frequencies in the group
11 Figure 3: Monthly trip frequency of people with a WMO ID
We see that 3000 people make at most 1 trip every month. Furthermore, 94% of all people with a WMO ID makes at most 10 trips a month. As some of the people in the group ‘More’ make over 50 trips a month, these top 6% WMO users account for approximately 35% of all trips registered, not even counting the trips on WMO IDs used for Regiotaxi (CVV). To give an idea, limiting those people to a yearly maximum of 2500 or 2000 kilometres, would already result in a 3.4% or 5.6% reduction in total distance registered.
Another perspective would be to look at the destinations people visit. In Figure 4 we again looked at monthly trip frequency, but now by destination.
Figure 4: Frequency by which destinations are visited
0% 10% 20% 30% 40% 50% 60% 70% 80% 90% 100% 0 500 1000 1500 2000 2500 3000
≤1 1-2 2-3 3-4 4-5 5-6 6-7 7-8 8-9 9-10 More
cu m u la ti ve % of a ll p e op le # p e op le ( tot al 6 4 3 2) # trips/month
Monthly trip frequency of people with WMO ID
0% 10% 20% 30% 40% 50% 60% 70% 80% 90% 100% 0 1000 2000 3000 4000 5000 6000 7000 8000 9000
≤0.5 0.5-1 1-1.5 1.5-2 2-2.5 2.5-3 3-3.5 3.5-4 4-4.5 4.5-5 More
cu m u la ti ve % of a ll d e st in at ion s # d e st in at ion s (1 2 0 9 3 t ot al ) # trips/month
[image:17.595.71.527.480.729.2]12 Similar to Figure 3, from which we learned that most people hardly ever make a trip, here, we see that most destinations are hardly ever visited. Most people travel from and to their home address. This means that their destination on the way back is often their home address. Since most people hardly ever make a trip, these home addresses are also hardly ever visited. Therefore, the results in Figure 4 can partly be explained by the results in Figure 3. The destinations at the far right however, which are visited more than 5 times a month, are not likely to be home addresses, at least not the addresses of private homes. These top 4% destinations account for 57% of all trips registered. To be even more specific, the top 40 destinations already account for 25% of all trips registered.
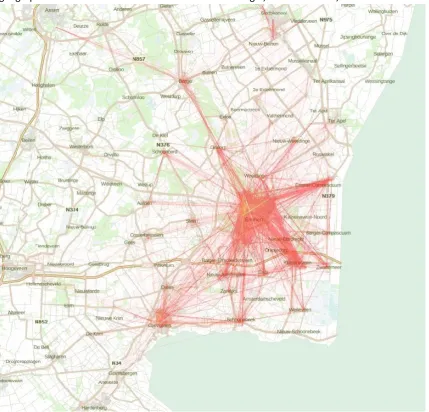
The destinations in Figure 4 are actually coordinates on a map. As explained briefly in Section 1.2, only 70% of all addresses in the data can be linked to coordinates in the BAG (Dutch database for administration of buildings). Looking closely at the addresses without BAG coordinates revealed that many variations in address notations and zip codes occur in the data. For example, the word straat is often abbreviated to str. Also, type errors occur and multiple different zip codes appear for one address. We refer to this as the geocoding problem. In effect, a lot of trips are not accounted for in the analysis, because no geographic coordinates could be found for their destinations. This
[image:18.595.73.503.337.749.2]geocoding problem becomes even more troublesome when we plot lines between origin/destination pairs, as can be seen in Figure 5. Here, only 67% of all trips registered are accounted for, because no geographic coordinates could be found for either the origin, the destination, or both.
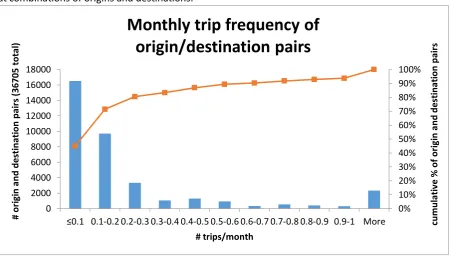
13 Figure 6 gives an idea of trip frequency of each distinct origin/destination pair in Figure 5. The
direction of a pair matters here. To clarify, in Figure 4 we only looked at destinations. Here, we look at combinations of origins and destinations.
Figure 6: Frequency by which trips occur between distinct orgins and destinations
Almost 94% of all the origin/destination pairs occurs less than once a month. The 2313
origin/destination pairs (top 6%) that occur more than once a month account for 57% of all trips registered. However, it would be a cumbersome task to look at each of these pairs individually. Looking only at the top 100, these origin/destination pairs account for less than 10% of all trips registered.
With regard to the geocoding problem, it is plausible to assume that some frequently as well as some less frequently visited locations are absent in our analysis. Therefore, the pattern we see throughout Figure 3, Figure 4, Figure 5 and Figure 6 would not likely be any different if there was no geocoding problem. However, the results clearly show that a small group of locations is visited significantly more than others. Since we want to determine which kind of locations are visited frequently, we should find a way to overcome this geocoding problem.
2.2.3 Vehicle Occupancy
As stated before, trips are registered based on single customer requests for WMO transport. This means that each trip is linked to only one WMO identity number, even though multiple people might be travelling together. Furthermore, the only reported distance is the shortest distance from origin to destination. We cannot see if other passengers are picked up along the way. This makes it
especially difficult to assess the occupancy of a vehicle at a certain point in time. In the data of 2013, a group identity number keeps track of trips occurring together within the same vehicle. Such a group consists of at most six trips with the same pick-up and drop-off locations and times. In a period of more than a year, only 420 different groups are registered, consisting of 908 trips. In the data of 2014 and 2015, such a group number cannot be found. For these years, we can only rely on two numbers when it comes to vehicle occupancy. The first is the number of fellow
0% 10% 20% 30% 40% 50% 60% 70% 80% 90% 100% 0 2000 4000 6000 8000 10000 12000 14000 16000 18000
≤0.1 0.1-0.2 0.2-0.3 0.3-0.4 0.4-0.5 0.5-0.6 0.6-0.7 0.7-0.8 0.8-0.9 0.9-1 More cum
u la ti ve % of or ig in a n d d e st in at ion p ai rs # or ig in a n d d e st in at ion p ai rs (3 6 7 0 5 t ot al ) # trips/month
14 travellers, registered within the same trip. Every WMO client is allowed to bring along one
accompanying person, who travels under the same conditions. In 2014 and 2015, 6.8% and 5.9% of all trips respectively carried an accompanying person.
A second number we can calculate is the amount of WMO clients travelling at a discount. Whenever two WMO clients decide to travel together from the same pick-up to the same drop-off, one of these clients travels at a 50% discount. From this information, it can be derived that 6.2% and 5.3% of trips in 2014 and 2015 respectively were carried out simultaneously with another trip. To clarify, these numbers are different from the prior mentioned numbers in the sense that the latter combinations consist of people all in the possession of a WMO identity card.
Both of the aspects discussed here give some information pertaining to the occupancy of WMO vehicles. However, both aspects relate to a situation where both pick-up and drop-off locations and times are the same. This gives us a part of the story, but in many cases, people might be picked up at a similar location and might be dropped off at a different location, for example their home address. In these cases, we cannot derive from the data whether these people were driven by the same driver. Furthermore, people might be picked up during another person’s trip. These people might be travelling together for a long time. Besides, even in the case where pick-up and drop-off locations and times are exactly the same, a person might not receive a discount, because it was not discussed in advance.
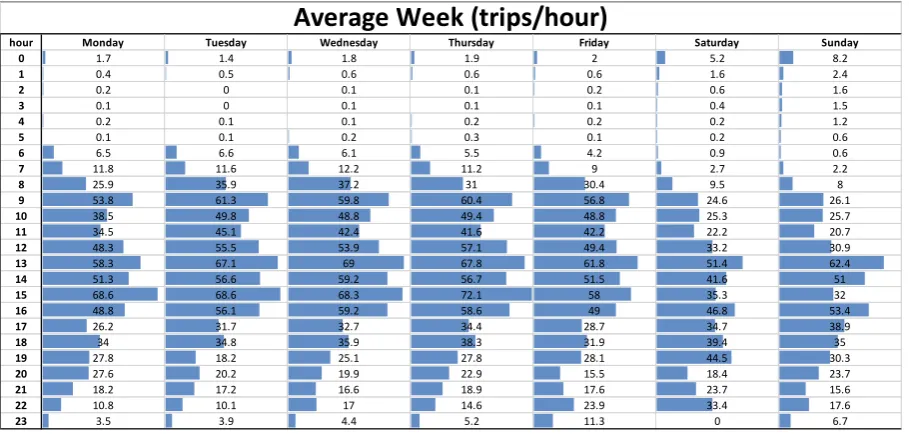
[image:20.595.72.527.414.631.2]In the absence of a group tracking number, we have to make some assumptions about the current occupancy of WMO vehicles in the southeast region of Drenthe, The Netherlands. Figure 7 shows the average amount of WMO trips during each hour of the week. To clarify, on average, 3.5 trips are carried out on Monday between 23:00 and midnight.
Figure 7: Trips/hour during an average week
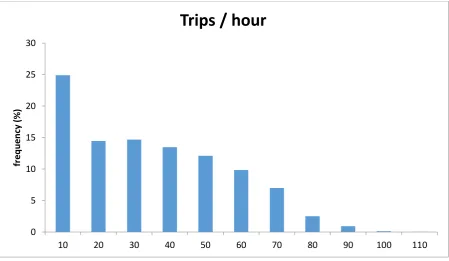
Thursday between 15 pm and 16 pm is the busiest hour of the week, with, on average, 72 trips per hour. However, Figure 8 shows that in some hours, peaks of more than 100 trips have been
registered. Although the occurrence of this happening is very rare, the WMO system should at least be prepared for peaks up to 80 trips an hour. These 80 trips can be dispersed across the entire southeast area of Drenthe. To start every trip on time, the taxi company will therefore have to dispatch her fleet across the entire region.
hour Monday Tuesday Wednesday Thursday Friday Saturday Sunday
0 1.7 1.4 1.8 1.9 2 5.2 8.2
1 0.4 0.5 0.6 0.6 0.6 1.6 2.4
2 0.2 0 0.1 0.1 0.2 0.6 1.6
3 0.1 0 0.1 0.1 0.1 0.4 1.5
4 0.2 0.1 0.1 0.2 0.2 0.2 1.2
5 0.1 0.1 0.2 0.3 0.1 0.2 0.6
6 6.5 6.6 6.1 5.5 4.2 0.9 0.6
7 11.8 11.6 12.2 11.2 9 2.7 2.2
8 25.9 35.9 37.2 31 30.4 9.5 8
9 53.8 61.3 59.8 60.4 56.8 24.6 26.1
10 38.5 49.8 48.8 49.4 48.8 25.3 25.7
11 34.5 45.1 42.4 41.6 42.2 22.2 20.7
12 48.3 55.5 53.9 57.1 49.4 33.2 30.9
13 58.3 67.1 69 67.8 61.8 51.4 62.4
14 51.3 56.6 59.2 56.7 51.5 41.6 51
15 68.6 68.6 68.3 72.1 58 35.3 32
16 48.8 56.1 59.2 58.6 49 46.8 53.4
17 26.2 31.7 32.7 34.4 28.7 34.7 38.9
18 34 34.8 35.9 38.3 31.9 39.4 35
19 27.8 18.2 25.1 27.8 28.1 44.5 30.3
20 27.6 20.2 19.9 22.9 15.5 18.4 23.7
21 18.2 17.2 16.6 18.9 17.6 23.7 15.6
22 10.8 10.1 17 14.6 23.9 33.4 17.6
23 3.5 3.9 4.4 5.2 11.3 0 6.7
15 Figure 8: Frequency of trips per hour
The diagram in Figure 9 shows that almost 75% of the trips is driven within the Emmen region, i.e., from an address in area 78 to another address in area 78 on the map. So, on busy days, 75% of 80 trips per hour are driven within this particular area, in other words 60 trips per hour.
Figure 9: Daily movements in number of trips between the zip code areas depicted on the map
The taxi company claims to dispatch 40 taxi buses every day for the purpose of WMO transport in the area. Looking at the diagram in Figure 9, we could assume that 75% of the entire fleet of vehicles is allocated to the Emmen region. However, it is likely that taxi buses in the urban area of Emmen are able to drive more efficiently than buses in the surrounding areas. To be on the safe side, we assume that at least 50% of the fleet is dispatched to the Emmen region. In other words, at least 20 buses are used to serve a peak of 60 trips per hour. This comes down to at most 3 trips per vehicle in
0 5 10 15 20 25 30
10 20 30 40 50 60 70 80 90 100 110
fr
e
q
u
e
n
cy
(
%
)
[image:21.595.83.526.408.650.2]16 busy hours. Taken into account 6% fellow travellers, this adds up to little more than 3 passengers per vehicle per hour. Given an average trip duration of 23 minutes, see Table 2, it is likely that more than one trip is executed in an hour, which means these 3 passengers are not likely to be in the same vehicle at the same time. Therefore, we can say with great certainty that there are rarely more than 2 passengers in a taxi bus at the same time. A typical bus used for WMO transport offers room for 6 normal seats and 2 wheelchairs. In conclusion, the occupancy of WMO vehicles in the southeast region of Drenthe, The Netherlands, is very low.
2.3 Conclusion
In the southeast area of Drenthe, The Netherlands, a single taxi company provides WMO transport for elderly and handicapped people in Borger-Odoorn, Coevorden and Emmen. A fleet of 40 buses, suited to special needs, is dispatched daily to execute about 200 thousand trips a year. Analysis of trip data shows that only 40 frequently visited destinations account for 25% of all trips registered. As most trips are requested by a relatively small group of frequent travellers, group arrangements for transport might be possible at some of these locations. It depends on the type of organization at these locations whether this is really an option. In order to determine which kinds of organizations are located at the frequently visited destinations, we need to overcome the observed geocoding problem. This problem revealed that a lot of variations in address notations occur in the data. Therefore, many trips are linked to false or non-existent locations, i.e., locations of which no geographic coordinates could be found. Finally, to assess current performance of the WMO transport system, we looked into the occupancy of WMO vehicles. Based on a number of
17
3 Literature
In this chapter, a literature study provides insight into strategic, tactical and operational aspects of the design of a DRT system for elderly and people with disabilities. Furthermore, we look at ways to overcome the observed geocoding problem. This enables us to determine which kinds of
organizations are visited frequently. Section 3.1 summarizes the background of DRT systems. In Section 3.2, we look at strategic and tactical aspects of network design. Section 3.3 discusses the Dial-a-ride problem. In Section 3.4, we look into algorithms to solve the geocoding problem. Section 3.5 presents a short summary and conclusions.
3.1 Background of DRT
As we outlined in the introduction of this thesis, elderly and people with disabilities are especially vulnerable. Their restricted mobility discourages them from using regular public transport, making it difficult to access social environments. To enable these frail groups of society to participate,
significant progress has been made in the development of more personalized demand-responsive transportation (DRT) services (Bruni, Guerriero, & Beraldi, 2014). Demand responsive transport ranges from a conventional bus route with flexible operating modes, to a shared taxi service (Nelson et al., 2010). However, a more strict definition is used by Parragh, Doerner, and Hartl (2010), who declare that both vehicle routes and schedules in a DRT system must be generated on the basis of user requests. DRT systems are usually operated by smaller vehicles (small buses, minibuses) and maxi-taxis (large taxis, often seating up to 10 passengers) (Mulley et al., 2012). DRT is mostly coined with so called dial-a-ride services, which were predominantly used for highly dispersed trips and to provide transportation in suburban areas for non-working purposes (Mageean & Nelson, 2003). Over the past decades, demand-responsive services have gained popularity because of a need for more flexible transportation than regular buses can provide. Early studies have shown high demand for door-to-door services by elderly and people with disabilities (Stern, 1993). Stern shows that older people need to make a certain limited number of trips, regardless of price or mode availability. These findings are also supported in more recent studies (Nguyen-Hoang & Yeung, 2010).
Governments all over the world recognise the central role of transport in providing accessibility and have included flexible transport services, as a means to enhance social participation, in their political agendas (Mulley et al., 2012). Furthermore, anti-discrimination legislation has forced transit
agencies and local governments to provide vulnerable people with comparable means of transportation (Nelson et al., 2010). Take the USA for example. “Since the enactment of the
18 increased public transport income and reallocation of fixed-route resources. Nevertheless,
improvements in routing and scheduling software, along with the development of smartphone-based applications continuously make DRT services more effective (Davison et al., 2014).
3.2 Network design
In the planning of transportation systems, we can distinguish three levels of decisions to be made, namely strategic, tactical and operational (Crainic & Laporte, 1997). Decisions that pertain to the strategic level and the tactical level are discussed in Sections 3.2.1 and Section 3.2.2 respectively. We elaborate on operational aspects in Section 3.3.
3.2.1 Strategic decisions
At the strategic level, upper management has to set out policies and decide on available resources such as locations of facilities and hardware. To determine these locations and their service coverage, first, we look at several location models. Second, we elaborate on the resource requirements of a transportation system. As these requirements depend on policy, technology and quality of the service, these aspects are discussed in the remainder of this section.
As discussed in Section 3.1, DRT services are designed for different purposes, but the common denominator of DRT and public transport in general is to improve access to a network of services. Access to services in an area can be assessed using different spatial accessibility models. The location set covering problem (LSCP) introduced by Toregas et al. (1971), aims to find as few facilities as possible, to ensure full coverage of all the demand areas. The more popular maximal covering location problem (MCLP), introduced by Church and ReVelle (1974), maximizes the population covered by a limited number of locations. On the basis of these models, (new) facility locations can be determined, as well as caveats in the current transportation network. The first location models lack accuracy because of outdated distance measures (Apparicio et al., 2008). In the presence of geographic information systems (GIS), new methods have been exploited to incorporate more realistic network attributes. A network covering location problem (net-CLP) has been introduced by Ye and Kim (2016), to capture actual road distances and travel times. Besides accuracy, another advantage of using existing transportation networks, is to account for various modes of transport and different traffic conditions (Ye & Kim, 2016). Using different thresholds of travel time, the authors demonstrate that a more accessible transportation system could help to increase service coverage in the area (Ye & Kim, 2016). An issue that all location models need to deal with is their spatial resolution and the aggregation errors it entails (Murray & O'Kelly, 2002; Murray, O’Kelly, &
Church, 2008). To minimize these errors, Benenson et al. (2017) discuss the potential of analyzing transit accessibility at the resolution of individual buildings.
19 calculated for the transport system. For example, more flexibility of users in time-windows allows for more efficient schedules. The results of the Flanders study show that the base scenario of 100% coverage by subsidized adapted transport would not be attainable by the Flemish government, because of disproportional costs. A 50% coverage would reduce the required resources by almost 50%, but this would also ask for a complex framework to distinguish which request for transport would be eligible for subsidy and which would not. According to the authors, the context-sensitive input parameters can easily be modified to fit other countries, perhaps also incorporating social benefits of different policies, related to quality of service (Neven et al., 2015).
Resource requirements of a transportation system depend on the type of service and the technology used. In the light of technological advancements, the US Department of Transportation presented a study, estimating expected benefits of several advanced public transportation systems (APTS), such as Fleet Management Systems (Goeddel, 2000). Several other intelligent transportation systems (ITS) used to improve the performance and attractiveness of public transport are discussed by Blythe et al. (2000). To establish the actual impact of advanced technologies on the performance of DRT providers, a nationwide study has been executed, comparing 62 paratransit companies in the USA (Palmer et al., 2004). The results show that the adoption of computer aided dispatching (CAD) technology, using automated scheduling and dispatching functions, is beneficial in terms of
passenger miles per vehicle, but not in terms of operating costs. The opposite revealed to be true for the implementation of advanced communications technology, which showed no productivity
benefits, but did reduce operating expenses. The authors conclude that the implementation of CAD systems might entail extra training of personnel and additional functions associated with the software. Furthermore, the adoption of advanced communications technology probably reduced supervisory and dispatch labour costs, rather than fuel costs (Palmer et al., 2004). It must be noted that the study examines National Transit Database (NTD) data from 1997 to 1999. This might pose a
discrepancy in the interpretation of the word ‘advanced’ in advanced technologies.
In the trend of growing social networks, smartphone-based applications have enabled ride-sharing services as an alternative to expensive taxi services (Simonin, 2014). These applications match riders to drivers who travel along their route, taking into account time-windows of the participants and vehicle capacity. Similar to ride-sharing services for the public, a location-based dial-a-ride service for elderly and people with disabilities in Taiwan has been proposed by Cheng (2011). A server processes requests based on the availabity of vehicles in the neighbourhood and their current route. One of the vehicles is then assigned to the request and rerouted, based on an ant colony algorithm (Cheng, 2011). The downside of such a service is that it requires investment in a system architecture. Furthermore, it requires elderly and people with disabilities to use smartphones to submit a request for transportation. Finally, last minute modifications of current routes might not always be feasible in terms of additional travel times of passengers on board of a vehicle, especially when the fleet is dispersed over a large area of service. One step further in the future is the use of automated vehicles for door-to-door services, such as the cybercars discussed by Parent (2007). Although currently only implemented in protected environments, large improvements have been made in obstacle
avoidence and fleet management techniques to support the use of automated vehicles (Parent, 2007).
Last but not least, the quality of the proposed transportation system has to be considered. Quality of service in public transport in general has been widely studied. Waiting times, cleanliness and
comfort have been found to be the most important factors valued by users of public transport
(dell’Olio, Ibeas, & Cecin, 2011). However, the subjective users’ perception should be evaluated
20 Mazzulla, 2011). A broad review of literature on quality of service of dial-a-ride (DAR) systems in particular can be found in work of Paquette, Cordeau, and Laporte (2009). The authors recognize the gap in literature between customer-based perceptions of quality, covered in the marketing
literature, on the one hand, and the technical-based specifications of quality, defined in the
operations research literature, on the other hand. The specifications used in OR models usually tend to focus on the more quantifiable aspects of quality, such as time-windows and ride times (Paquette et al., 2009). Their work also addresses the need for an improved measurement scale of quality that is internally consistent and valid, something earlier research lacked evidence of. This need is met in later research by Paquette et al. (2012). Several of the results in this research prove relevant for management practice. First of all, the most important quality criterion for improving service turns out to be the ability to make last-minute changes to reservations. To allow for this level of flexibility, DRT services should incorporate dynamic planning tools. The second most important criterion for improvement is that of always having the same driver. The consistent vehicle routing problem could be extended to the context of dial-a-ride operations to facilitate in this requirement (Groër, Golden, & Wasil, 2009). Other important factors are related to time and punctuality, easily modifiable constraints in OR models. However, the authors themselves recognize that importance of a service attribute may depend on the current quality level (Paquette et al., 2012). Furthermore, this study indicates that user perceptions of quality vary for different subgroups of society, which is also supported by other research (dell’Olio et al., 2011). Therefore, efforts to improve quality of service for elderly and disabled, should be tailored to their specific needs.
3.2.2 Tactical decisions
Once decisions about the type of service, service policy and system requirements have been made at the strategic level, design of the service network has to be determined at the tactical level. Decisions at the tactical level are medium-term decisions concerned with the allocation of resources that are determined at higher levels. Tactical planning in the transport of people involves decisions about the design of routes along a sequence of stops, the frequency at which vehicles operate along a route and their associated timetables. We find different terminology in literature regarding the transport of freight and the transport of people. To avoid mixing, we briefly summarize the tactical decisions involved in freight operations, before we continue to elaborate on the tactical decisions involved in the transport of people. The design of demand responsive networks will be discussed towards the end of this section.
The service network design problem is usually associated with the tactical planning of intermodal freight operations (Crainic & Laporte, 1997). Consolidation and trans-docking at terminals are important cost aspects of these operations that determine the optimal allocation of available resources. The service network design problem (SNDP) focuses on generating a transportation plan that minimizes costs while satisfying transportation demand (Ng & Lo, 2016). However, an SNDP may also be used to maximize the level of service, for example in the redistribution of bikes across stations in a bike-sharing service (Neumann-Saavedra et al., 2016). An SNDP is usually modelled using network design formulations, such as path formulations, node-arc formulations and tree formulations (Wieberneit, 2008). Pick-up and delivery operations within a local service area of a hub or terminal are generally not considered in a service network design problem (Guastaroba, Speranza, & Vigo, 2016).
21 routes, (ii) frequencies setting, (iii) timetabling, (iv) vehicle scheduling and (v) crew scheduling and rostering (Asadi Bagloee & Ceder, 2011). Early studies focussed primarily on vehicle and crew scheduling activities because of the potential cost reduction of more efficient schedules. However, with automated scheduling methods being widely accepted, it became feasible to focus on higher level decisions of the transit planning process, such as network design and frequency setting (Ceder & Wilson, 1986).
[image:27.595.74.409.275.488.2]The first step in the transit planning process is the network design problem. Based on origin and destinations matrices with the expected amount of passengers between possible stops and transfers, a number of routes and stops has to be set in this step, such that demand of a particular area is covered (Guihaire & Hao, 2008). In a case study of Singapore, researchers have designed new bus routes, based on clusters of taxi rides (Chuah et al., 2016). These clusters are presented in Figure 10 as origin/destination pairs, encircled with red dots. The blue arrows represent newly designed bus routes.
Figure 10: Clustering of frequent taxi rides in Singapore (Chuah et al., 2016)
Consider route B: The bus starts at the origin of two clusters of taxi rides (O). Following segment 𝑒0,
the bus picks up passengers from a second cluster with a similar destination. Segment 𝑒1 takes the
bus to its first destination, alighting most of the passengers, after which only segment 𝑒2 has to be
traversed to get to the final destination of the remaining passengers (D). This way, three different taxi routes can be coverd by only 1 bus line with only small deviations from the shortest path. In this case, segment 𝑒3 needs to be added as a connection to complete the route. Since this is a segment
without transport of any passengers, this segment is represented as a dashed arrow. Preferably, we want as few emtpy segments as possible without deviations from the shortest path between origins and destinations. Therefore, alternative C in Figure 10 is preferred over alternative A.
A lot of aspects have to be taken into consideration in the first step of the transit planning process, as the network of routes will have great impact on all the next steps. For example, an existing network infrastructure might already be in place, meaning investments would have to be made to adept to a new situation. Conflicting interests between users and operators make the network design problem even more complex. Users want a network with great accessibility and directness, meaning the routes almost entirely follow their shortest path from origin to destination. The
22 locating and relocating bus stops along routes to maximize service coverage can be solved by the accessibility models discussed in Section 3.2.1. The route selection of the transit network design problem is modelled in various ways, as discussed by Guihaire and Hao (2008).
After routes and sequences of stops have been determined, the next step in the transit planning process is frequencies setting. To optimize frequencies along each route, demand information has to be known for different days of the week and times of the day, as well as vehicle capacities. From a
user’s perspective, headways, i.e., the times between each line run, cannot be short enough. Operators on the other hand, want to minimize the amount of drivers and buses needed to perform the service, without excessive waiting times. The network frequencies setting problem is modelled in various ways, discussed by Guihaire and Hao (2008).
The third step in the transit planning process is the development of timetables for trips. This is especially important for the timing of transfers in the network. Especially when headways are large, such as is the case in rural areas, coordination of transfers becomes useful. One of the models that weighs transfers in timetabling is discussed by Wu, Tang, and Zhang (2013). A model for efficient vehicle scheduling while at the same time balancing timetables from a passenger’s point of view has
been explored by Schmid and Ehmke (2015). The last steps in the transit planning process concern operational decisions rather than strategic and tactical decisions. These are further discussed in Section 3.3.
For the transportation of elderly and people with disabilities, demand-responsive transportation is the designated type of service. The design of demand-responsive systems is fundamentally different from the design of public transit systems with respect to the first steps in the transit planning process. In demand-responsive transportation, the routes and departures are usually subject to
users’ demands, which puts an entirely different perspective on network design. The most
commonly known demand-responsive system is a taxi-service, in which people are transported from door to door along the shortest path. In this case, network design is confined to questions such as the number of vehicles and (re)positioning strategies. Another common DRT system is one in which people are still transported from door to door, however the route depends on a sequence of
passengers picked up along the way. Such a system is currently used for the transportation of elderly and people with disabilities in Drenthe, The Netherlands. Common practice in these systems is to construct a set of a priori routes once the majority of bookings is known. These routes may later be modified to accommodate late requests (Bruni et al., 2014). The design of such practices is driven by two conflicting criteria. On the one hand, incorporating late requests in the design of routes
increases occupancy of the vehicle. On the other hand, allowing for too many different deviations from existing routes may increase the travel time of passengers to an undesirable level (Bruni et al., 2014). This is where hybrid systems come into play (Aldaihani et al., 2004). The idea behind such systems is to integrate one or more fixed lines with a flexible demand-responsive system for the first
23 Figure 11: Hybrid grid structure (Aldaihani et al., 2004)
Within each zone, the number of on-demand vehicles is based on the demand rate in the service area and the probability that a passenger has to travel within the same zone, to a zone along the same fixed bus line, or to a zone which is diagonally positioned, meaning two fixed lines have to be traversed (Aldaihani et al., 2004). The total cost of the system varies with the cost of on-demand vehicles and buses and the travel times of passengers, which depend on the zone structure.
(Aldaihani et al., 2004). More and smaller zones result in less expensive on-demand miles, but at the same time, the probability of one or two transfers is increased, along with waiting times.
3.3 Dial-a-ride Problem
In the previous section, we covered strategic and tactical aspects involved in the design of a transportation service. Operational aspects are considered in several vehicle and crew scheduling models in literature (Bunte & Kliewer, 2009; Mesquita, Paias, & Respício, 2009). However, these considerations turn out to be very different for different systems. The dial-a-ride system that is currently used in Drenthe, The Netherlands, requires a particular approach. The routes of the door-to-door service for elderly and people with disabilities depend on a sequence of passengers picked up along the way. Some of the requests are known in advance and some may be accommodated later. The operational aspects involved in the planning of such dial-a-ride systems are covered in the Dial-A-Ride problem (DARP), which we discuss in this section. First, we outline the background on dial-a-ride problems. Second, we look into exact algorithms to solve the DARP. Finally, we discuss the development of heuristics that have been introduced to solve realistic sized instances of dial-a-ride problems.
Progress in dial-a-ride systems has largely evolved around the implementation of automated dispatching and scheduling systems. Depending on algorithmic solutions, these systems have developed over the years, with advancements in operations research. The Dial-a-Ride Problem (DARP) is initially based on the vehicle routing and scheduling problem, of which many variants are discussed by Sbihi and Eglese (2007). These models were extended to include pick-ups and
24 In terms of exact algorithms for the DARP, early work has focussed on dynamic programming
algorithms to solve the single vehicle many-to-many DARP to optimality (Psaraftis, 1980) (Psaraftis, 1983). The multiple vehicle many-to-many DARP has been solved by Desrosiers, Dumas, and Soumis (1988), using a cluster first and route second procedure. First, nearby customers with similar
requests are grouped together into mini-clusters. These mini-clusters are then optimally assigned to vehicles during the routing phase (Desrosiers et al., 1988). Branch-and-cut algorithms, which employ new valid inequalities and inequalities developed for the pick-up and delivery problem, are
presented by Cordeau (2006). In other work, Ropke, Cordeau, and Laporte (2007) introduce a more efficient 2-index formulation model, as opposed to a 3-index formulation mixed integer program (MIP). The model introduced by Parragh (2011) incorporates heterogeneous modes of
transportation into a new branch-and-cut algorithm and also penalizes waiting time of passengers on board of the vehicle. A variable neighbourhood search heuristic, proposed by Mladenović and
Hansen (1997), is adapted and used to compute an initial upper bound to the DARP solution (Parragh, 2011).
Heuristics for the dial-a-ride problem have been developed alongside exact algorithms to solve real-size problems. The situation where transportation requests are received well before the time of vehicle dispatching is considered by Jaw et al. (1986). Their ADARTW (Advanced Dial-A-Ride with Time Windows) heuristic is used to tackle the time-constrained version of the multi-vehicle many-to-many DARP. Each customer is inserted sequentially into the work schedule of one of the available vehicles. The REBUS solution algorithm introduced by Madsen, Ravn, and Rygaard (1995) is an improved and generalized version of ADARTW. Along with other developments such as reduced computation time and sorting of jobs based on complexity of insertion, REBUS allows for more flexibility. Furthermore, it is designed to solve dynamic route problems, meaning a job, i.e., customer request, may enter the system at a random time or may be cancelled at any time (Madsen et al., 1995).
In the light of anti-discrimination legislation in the USA and the increased burden of DRT services on the budgets of transit agencies that accompanies this, a hybrid heuristic is proposed by Aldaihani and Dessouky (2003). The idea of their solution approach is based on a hybrid system in which DRT services are combined with conventional fixed-route services. A trip from start to destination can
now be cut into a maximum of three legs, having at most two transitions. “Clearly, a curb-to-curb system as opposed to a hybrid system minimizes the travel time for the passenger. However, shifting some of the demand to fixed routes may alleviate some of the demand pressure for the on-demand vehicles caused by ADA (Americans with Disabilities Act) requirements” (Aldaihani & Dessouky, 2003). Their model minimizes total vehicle distance of on-demand vehicles (TVD) and the total trip time of passengers (TTT), following the insertion and improvement procedure in Figure 12. The input of the insertion procedure is a set of candidate paths for each request, based on a number of
25 vehicle can adhere to the time-windows of the request, another vehicle is added. Based on the schedule of the first leg of a hybrid request, the pick-up time and point of the final leg can be determined. This request is resorted into the set 𝑁 to repeat the procedure until 𝑁 is empty. The initial solution does not consider the total trip time of the passengers, which includes waiting time at bus stops and travel time on buses. During the improvement phase, depicted on the right of Figure 12, the hybrid request with the earliest pick-up time is selected. All the alternative paths for this request are evaluated in terms of both TVD and TTT. A swap is made if a proposed alternative improves the objective function.
Figure 12: Insertion procedure (left) and improvement procedure (right) (Aldaihani & Dessouky, 2003)
After the improvement steps, Tabu Search is applied for re-sequencing requests and re-assigning them to a different vehicle. Results of running the complete method showed that almost 20% of DRT requests could be shifted to a hybrid system, reducing DRT vehicle distance by almost the same amount (Aldaihani & Dessouky, 2003). However, the introduction of Tabu procedures increased computation time considerably, while solution quality did not.