1
Validation of a Datafication Canvas
W.J.M. Willems
University of Twente PO Box 217, 7500 AE Enschedethe Netherlands
ABSTRACT
Given the rise of data analytics and big data, the ethical implications of the data become more important. The development of new frameworks for the understanding of these ethical concerns is desired. Alberts-De Gier developed a canvas, but this has not been validated yet. This paper provides a validation of the datafication canvas of Alberts-De Gier. Firstly, the canvas is compared to other existing frameworks. Secondly, the canvas is validated by applying it to two literature cases concerning biased algorithms. Thirdly, the canvas is applied to business cases from Asito and a large Dutch bank. The research shows that there is a need for such a canvas and that it identifies vicious feedback loops, but it also shows shortcomings in the identification of ethical concerns such as the identification of biased variables.
Keywords
Datafication, Canvas, Bias, Data, Framework.
1.
INTRODUCTION
Nowadays, due to the rapid development of the web, IoT devices and another array of sources, it is possible to collect more data than ever about both groups and individuals. Big data was once considered the domain of the rocket scientists among us, but nowadays data has gone mainstream and companies are better able to apply it to their own business processes. Companies are increasingly dependent on these sources of data to stay ahead of the competition, provide better service to customers, or to place products more effectively and efficiently in the market [13].
Much of the data collected from sensors, for example, has not undergone processing and, therefore, many of us classify it as raw. However, as Bowker suggests, data is always processed or “cooked” and, therefore, raw data can be clearly considered an oxymoron [5]. The initial collection of the data, namely, already involves assumptions and decisions made by humans. As Manovich also explains, “data does not just exist – it has to be generated” [14].
With the concession to consider data as biased, ethical issues concerning this data present oneself. On her website, The Data Justice Lab describes a variety of cases in which there arises a discrepancy between this datafication and social justice. In 2015, for example, it was discovered that the prices for the Princeton Review’s online SAT tutoring packages for
high school students depended on the living area of the customer. It turned out that this location-based pricing was a proxy for the race because the highest prices were charged to ZIP codes with a large Asian population [17].
The word datafication just mentioned is more a buzzword than a real term, but it describes the data explosion of the last years excellent. Cukier and Mayer-Schoenberger were the first to introduce the word and described it as the “ability to render into data many aspects of the world that have never been quantified before” [7]. A fitting example of datafication is the customer acceptation profiles created by banks. These profiles use indicators such as income, the value of the property, and credit registration (BKR in the Netherlands) to determine if they will provide customers with a loan.
Datafication has a large impact on people as just described and the development of new frameworks for understanding the consequences and ethical concerns becomes increasingly important. This paper will describe validation research for a datafication canvas designed by Alberts-De Gier [2]. This will offer a contribution to both the understanding of the canvas and the development of the field of data ethics.
The evaluation of the canvas is done in a subsequent way. In Section 2 of this paper, the canvas is introduced. This is followed by the introduction of the research question and sub-questions in Section 3. In Section 4, the methodology is discussed by explaining the literature search, and case applications. Section 5 describes the results of the literature research and the validation of the different cases. Finally, the paper discusses recommendations for the canvas to be improved upon and a final conclusion is given.
2.
BACKGROUND
The canvas of Alberts-De Gier is part of transdisciplinary research. This is a research strategy in which different disciplines are combined to create an innovation that moves beyond discipline-specific approaches to address a common problem [1]. The canvas combines the disciplines of Information Systems, Data Science, and Philosophy.
The framework of Alberts-De Gier is specified as a canvas because it is supposed to be a template that can be easily filled in by companies and individuals implementing data practices. The canvas consists of three different steps as shown in Figure 2.1.
The first step is the actual datafication and helps to explicate that data does not simply exist, but has to be created [2]. The second step is focussed on interventions based on the data. This means looking at the domain via data and acting based upon that. Due to their use of new technology, users give a new meaning to the technology and this will consequently change the domain.
Permission to make digital or hard copies of all or part of this work for personal or classroom use is granted without fee provided that copies are not made or distributed for profit or commercial advantage and that copies bear this notice and the full citation on the first page. To copy otherwise, or republish, to post on servers or to redistribute to lists, requires prior specific permission and/or a fee.
31thTwente Student Conference on IT, May. 5th, 2019, Enschede, The Netherlands.
2
Figure 2.1: Overview of the Datafication Canvas [3]
[image:2.595.71.264.70.175.2]The third step describes this appropriation to new technology and explains the need for re-evaluation of the domain. The Design step and Use step are elaborated on, while the Historicism step is still in development. Therefore, the latter is left out of this validation research. The former steps are each consisting of four steps that form a loop.
Figure 2.2: Design Step of the Canvas [3]
As can be seen in Figure 2.2, the design cycle consists of four different steps and it resembles the design theory of Wieringa [20]. In the first step, there is an evaluation of the current domain to identify the needs for a new data practice. The second step, the domain model, identifies the theoretical theory that forms the reason for implementing the new technology. In design theory, this step is implicitly included. The third step describes how the system will work and look, and finally, the technology is implemented. Returning to the domain again identifies a redesign of the technology.
Figure 2.3: Use Step of the Canvas [3]
The use cycle presented in Figure 2.3 also consists of four steps starting with the identification of the domain again. This is an important first step because the domain will change if the technology is implemented. The second step is the generation of the data for the data practice, followed by the analytics of the data. The analytics of the data is the moment at which it could become clear if the variables included in the design are biased. The last step is the data-driven intervention in which a stakeholder of the technology is performing an
action based on the data. Following the loop again should identify if there are pernicious feedback loops in the data practice.
3.
RESEARCH QUESTION
The objective of this research is to validate the datafication framework of Alberts-De Gier. The following question has been formulated to address this objective:
RQ1 How is the datafication canvas of Alberts-De Gier contributing to the identification of the moral dimension of data?
1.1 In what way is the ethics of data practices investigated in other frameworks?
1.2 To what extent can the canvas be applied to literature cases?
1.3 To what extent can the canvas be applied to real business cases?
To answer the main question, it is necessary to have an understanding of how other frameworks solve the identification problem of ethics in data practices. This will help in understanding the importance of the canvas of Alberts-de Gier and it will help to categorize biases. To Alberts-determine this, sub-question 1.1 will be answered.
After having identified the other frameworks, sub-question
1.2 and 1.3 will be answered to find out if the canvas can be applied to find biases in a case.
4.
METHODOLOGY
The conducted research is part of the domain of Information Systems research. Research in this domain can be divided into five different types of theory, of which the validation research concerns Type V [11]. This type of theory describes how to do something and it concerns methods and theoretical knowledge used in the development of IS. The validation research should give us more insights into the construction of the framework.
The framework, in general, is part of Information Systems Design Theory. Walls et al. define it as “a prescriptive theory which integrates normative and descriptive theories into design paths intended to produce more effective information systems” [19]. Gregor and Jones presented eight components that belong to a Design Theory [12]. The last component called expository instantiation stipulates the validation research best. This component is described as the physical implementation of the artefact for the purpose of testing theory.
This research is, therefore, also not quantitative research, but rather qualitative research. More specifically, it is interpretive research. Interpretive research in Information Systems is aimed at producing an understanding of the context of the Information System [15].
The research has been done in several phases. The first step of the research is the literature research in which different framework will be analysed for their ability to identify biases in data practices. The second step of the research is the application of two literature cases from the book Weapons of Math Destruction on the canvas. This is followed by an application on business cases from Asito and a large Dutch bank to test the practicality.
Design: Domain model
Use: Human-data relations
Historicism: Changing norms and
values
Domain:
The current system; the world; the context
Data-driven interventions: Action based on data
Generate data:
The actual datafication
Analytics and output:
Interpretation and visualization of the data
Domain:
The world; the context
Implementation:
Creation of the system / data practice
Domain Model:
Hermeneutics; Theoretical Framework supporting new data
practice
Artefacts and processes:
[image:2.595.54.288.277.415.2] [image:2.595.54.286.531.667.2]3 The research steps are described in more detail in the following subsections.
4.1
Relevant Work Comparison
Theoretical literature research was performed to find out which theories already exist and what the relations between the theories are.
First, the theories are discussed and their potential downsides are identified. This helps in understanding the contribution of the canvas of Alberts-De Gier to this domain.
After this, a taxonomy of biases is formed based on the different theories that already exist. This categorization of the biases is used as a basis to analyse the biases found in the literature and business cases.
4.2
Literature Case Application
To find out if the canvas is able to identify all different sorts of biases, it is applied to literature cases from the book
Weapons of Math Destruction. These cases have in common that they contain biases that are identified by the author. The reason that cases from this book are chosen is that the cases are derived from real-life situations and because the author clearly identifies the biases. The cases that are chosen are (1) predictive policing, and (2) the U.S. news university ranking. The characteristic of the first case is the pernicious feedback loop, while the character of the second case is the inclusion and exclusion of proxies.
The cases will be read, the biases will be identified, and they will then be categorized. Then the cases are applied to the framework and a comparison is made between the identified biases from literature and from the canvas.
4.3
Business Case Application
The practicality of the canvas is tested by applying it to business cases. The cases have in common that there are no biases identified beforehand as in the literature cases. The first case is from the cleaning company Asito. They implemented a data practice on Schiphol Airport. Based on the knowledge of the BIT Inc. project, the case can be filled in on the canvas.
The second case is from a large Dutch bank. They are working on data minimalization for the acceptance of mortgages. A workshop is organised to gain more insight into the practicality of the canvas. The workshop consists of a morning in which the case of the bank is discussed an applied to the canvas by the researcher and employees.
5.
FINDINGS
This section will elaborate on the results of the comparison between the canvas and other works and the application of the cases on the canvas. Section 5.1 will elaborate on the comparison with other solutions, while Section 5.2 shows the results of the literature application and the biases that were identified. Section 6.3 shows the results of the company case application.
5.1
Related Work
5.1.1
Comparison
In general, much research has been done on the concept of Big Data. If we perform a search for “big data” on Scopus we will find a total of 63,725 documents related to this topic. However, if we search for the combination “big data” AND (discriminat* OR bias*) we only find 1,152 relevant
documents. Favaretto, De Clercq and Elger performed literature research on the topic of discrimination and big data and they found a total of 2,312 documents of which 61 documents were considered relevant [8]. These documents were obtained from the databases PsychInfo, PhilPapers, SocIndex, CINAHL, PubMed, and Web of science.
Numerous papers from this literature research described the unfair outcomes that could result from the data processing. Among other things, proxies or the definition of the target variable could be a cause of discrimination. The literature has also suggested several strategies to prevent this discrimination caused by data (analytics). There are (1) technological solutions, (2) legal solutions, and (3) human-centred solutions. It is, however, not necessary to elaborate on the legal solutions, since they are out of scope.
The strategies that have a technological foundation focus on the development of discrimination-aware methods that can be applied during the development of the algorithm. Historical data, for example, can already be biased and, therefore, the algorithm trained with this data will also be biased. The discrimination-aware methods can provide a good solution for identifying this bias. They can be divided into pre-processing, in-processing, and post-processing methods [8]. They respectively provide sanitization of the data, modification of the learning algorithm through the application of probabilistic models, and the auditing of models for discriminative patterns. The shortcoming of this solution is, however, that it does not provide people with a clear overview of the ethical issues and that it does not filter indirect ethical issues. The other solution offered in literature is human-centred. The solutions offered in this domain are mainly focussed on the supervision of humans over the data. This matches with the intention of the datafication framework, but the solutions in the literature remain vague and do not give a clear framework or guideline to remove and/or avoid biases in the data. In this approach, there is no clear taxonomy made of the different biases but it merely states that humans should supervise the data. An example is the participation of trusted third parties to store sensitive data.
Friedman was the researcher that developed the concept of
value sensitive design. This is an approach to the design of technology that accounts for human values occurring throughout the design process [9].
Together with Nissenbaum, Friedman also came up with a framework that could help to identify which biases could arise [10]. They make a distinction between three types of biases: pre-existing bias, technical bias, and emergent bias. The former are biases that exist before the creation of the algorithm. Technical biases arise from technical considerations or constraints. And emergent biases arise in the context of use with users. The framework is rather theoretical and hard to operationalize.
Cramer, Garcia-Gathright, Springer, and Reddy translated this framework into an easy summary while adding team composition and team expertise as additional categories [6]. The framework then consisted of the categories (1) Data, (2) Algorithm and team, and (3) Desired outcome. There is an additional checklist that asks whether each identified bias is expected and how this can be addressed.
4 More recent research for creating awareness about the biases of data is carried out by Baeza-Yates. He created a table that classifies all the main biases against three types of biases (namely: statistical, cultural, and cognitive)[4].
Most of the frameworks provide a guideline of the existing biases, but the canvas of Alberts-De Gier is unique in that it can be directly applied to cases to identify biases.
5.1.2
Taxonomy biases
The human-centred approach [8], the Utrecht data school framework [18] and the value-sensitive design [9] do not provide a clear taxonomy of biases.
On the other hand, the technological-centred approach [8], the framework of Friedman and Nissenbaum [10], and the framework of Cramer, Garcia-Gathright, Springer, and Reddy [6] have provided a taxonomy. These frameworks have in common that they make a distinction between three types of biases.
The framework of Friedman and Nissenbaum is rather hard to operationalize, but it is used as the basis for the framework of Cramer et al. The framework of the latter is largely overlapping with the technological-centred approach. Both describe three sorts of biases, but the description is slightly different. By combining the two frameworks, the following taxonomy can be created:
Pre-processing characteristic
Is the data that is used biased? What do you measure?
e.g. sampling or the entire population.
In-processing characteristic
How does the model look?
e.g. which variables are included and excluded.
Post-processing characteristic
Are there discriminative patterns? e.g. demographic.
Table 5.1: Taxonomy of biases
5.2
Literature Cases Result
5.2.1
Predictive Policing
The first case concerns a predictive policing algorithm implemented in the U.S. [16]. The police needed better policing with a smaller force. Therefore, police forces in several cities invested in crime prediction software. The program processes historical crime data and calculates the places where crimes are most likely to occur. When setting up the algorithm, the police had the choice to focus on violent crimes, or also include nuisance crimes such as consuming small quantities of drugs. The problem is that these nuisance crimes are taking place in many impoverished neighbourhoods. Once the nuisance data flows into a predictive model, more police are drawn to those neighbourhoods and they most likely will arrest more people there. This creates a pernicious feedback loop because cops are sent back to the same neighbourhoods every time. The following biases were identified from the case and will serve as the guideline for the comparison with the canvas:
Pre-processing 1. Broken window theory as a basis 2. Including biased historical data
In-processing -
Post-processing 1. Pernicious feedback loop: targeting
of impoverished neighbourhoods
Table 5.2: Biases predictive policing
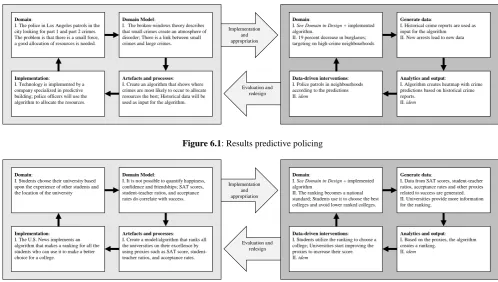
Figure 6.1 shows the result of the predictive policing algorithm filled in on the canvas. The I and II in the figure are the different iterations of the canvas. The Design Step is not iterated, while the Use step is iterated once.
The pre-processing characteristics were all identified by the canvas. The domain model described the theories that were used to determine how the algorithm should be implemented. The broken window theory is included here and the assumption that low-level crimes lead to high-level crimes. The domain model shown does excellent work in this case to find the cause of biases.
The use of historical data is also included in the framework. This is identified in the ‘generate data’ field. Although it shows the use of historical data, it does not become clear from the canvas whether or not this data is biased. From the case, we know that the historical data is generated by humans and could be racist, but this has not become explicit in the canvas. The post-processing characteristic is the one that is most clearly visualized in the canvas. The feedback loop that is included in the use step shows the development of a racist practice, namely: the targeting of poor neighbourhoods.
5.2.2
University Ranking
The second case is about the university ranking design by the U.S. News [16]. They decided to make a model for ranking the excellence of the colleges and universities in the United States. They picked proxies such as the SAT score as a measure for success. The trouble was, however, that the ranking was self-reinforcing. If a university received a bad score from the U.S. News, its reputation would suffer, and conditions would become progressively worse. The colleges, therefore, pushed to improve in each of the areas the rankings measured. The problem is that everyone is shooting for the same goals “which creates a rat race” [16]. Because the student financing is left out of the model and the focus is on the excellence of the education, colleges raised prices to address the areas that are being measured by U.S. News. Eventually, the victims are the poor and middle-class families who do not have enough money for a good education. For this literature case, the following biases were identified:
Pre-processing -
In-processing 1. Exclusion of tuition fee in the model. 2. Inclusion of the percentage of rejected students in the model.
Post-processing 1. Pernicious feedback loop: poor students cannot pay college because of increasing tuition fees
Table 5.3: Biases university ranking
The canvas that is filled in for this case, can be found in
Figure 6.2. For this case, there were only in-processing, and post-processing biases identified. Just as in the previous case, I and II indicate the iterations.
5 therefore, seems that the canvas is not able to identify in-processing biases well.
The post-processing characteristics are also not identified by the canvas. Because the tuition fee is not included in the model, it will also not be identified in the feedback loop.
However, the canvas, in general, does identify the self-reinforcing character of the ranking. If a college namely scores low in the ranking, good students are less likely to go to that college the following year, and the situation will deteriorate. Evaluation and redesign Implementation and appropriation Domain:
I. The police in Los Angeles patrols in the city looking for part 1 and part 2 crimes. The problem is that there is a small force, a good allocation of resources is needed.
Implementation:
I. Technology is implemented by a company specialized in predictive building; police officers will use the algorithm to allocate the resources.
Domain Model:
I. The broken-windows theory describes that small crimes create an atmosphere of disorder; There is a link between small crimes and large crimes.
Artefacts and processes: I. Create an algorithm that shows where crimes are most likely to occur to allocate resources the best; Historical data will be used as input for the algorithm.
Domain:
I. See Domain in Design + implemented algorithm.
II. 19 percent decrease in burglaries; targeting on high-crime neighbourhoods
Data-driven interventions: I. Police patrols in neighbourhoods according to the predictions II. idem
Generate data:
I. Historical crime reports are used as input for the algorithm II. New arrests lead to new data
Analytics and output:
I. Algorithm creates heatmap with crime predictions based on historical crime reports.
[image:5.595.50.556.40.720.2]II. idem
Figure 6.1: Results predictive policing
Evaluation and redesign Implementation and appropriation Domain:
I. Students choose their university based upon the experience of other students and the location of the university
Implementation: I. The U.S. News implements an algorithm that makes a ranking for all the students who can use it to make a better choice for a college.
Domain Model:
I. It is not possible to quantify happiness, confidence and friendships; SAT scores, student-teacher ratios, and acceptance rates do correlate with success.
Artefacts and processes: I. Create a model/algorithm that ranks all the universities on their excellence by using proxies such as SAT score, student-teacher ratios, and acceptance rates.
Domain:
I. See Domain in Design + implemented algorithm
II. The ranking becomes a national standard; Students use it to choose the best colleges and avoid lower ranked colleges.
Data-driven interventions: I. Students utilize the ranking to choose a college; Universities start improving the proxies to increase their score. II. idem
Generate data:
I. Data from SAT scores, student-teacher ratios, acceptance rates and other proxies related to success are generated. II. Universities provide more information for the ranking.
Analytics and output: I. Based on the proxies, the algorithm creates a ranking.
[image:5.595.52.551.68.350.2]II. idem
Figure 6.2: Results university ranking
Evaluation and redesign Implementation and appropriation Domain:
I. Asito cleans toilets at Schiphol Airport based upon the experience of the cleaners. However, it is not clear when customers experience the toilet as not clean. II. idem
Implementation:
I. FeedbackNow implements the system II. Bliptrack implements counters.
Domain Model: I. No Domain Model II. idem
Artefacts and processes: I. Make a system that gives customers the possibility to show their happiness by clicking on a green, yellow, red button on panel.
II. Implement counters on toilet
Domain:
I. See domain in Design + FeedbackNow implemented.
II. Asito cleans the toilets based upon the algorithm and passengers experience the toilets as cleaner
Data-driven interventions: I. The object leader sends cleaners to the toilets based upon the algorithm.
Generate data:
I. Passengers press a button on the FN panel. The button is registered with a time and location.
Analytics and output:
I. The algorithm visualizes the passenger perception of all the restrooms.
Figure 6.3: Results Asito
Evaluation and redesign Implementation and appropriation Domain:
I. A future customer asks a large Dutch bank a loan for a house and the bank determines if this individual is credit-worthy enough. However, the process of determining this is not the most effective.
Implementation:
I. The algorithm is implemented by the bank
Domain Model:
I. Data fields are analysed that seem relevant for the determination of the credit-worthiness of the future customer.
Artefacts and processes: I. An algorithm that uses among other things the UWV insurance report and income to determine if the bank should provide somebody with a loan.
Domain:
I. See domain in Design + Algorithm implemented
II. Future customer has a loan or has to deliver more information to receive a loan.
Data-driven interventions: I. The loan request is either accepted or denied.
II. idem
Generate data:
I. Customers are asked to deliver data about their income and financial situation; employees from the bank convert the data from paper to digital data. II. Send extra/new information
Analytics and output: I. The algorithm gives an advice about whether or not to accept the loan request of the future customer.
II. idem
[image:5.595.55.554.72.191.2]6
5.3
Business Cases Result
5.3.1
Asito Case Result
Asito is one of the biggest cleaning companies in the Netherlands. Among other things, they clean the toilets at Schiphol Airport. They want to collect data about the cleanliness of the toilets to serve their customers better. Schiphol Airport implemented FeedbackNow boxes at most toilets on the airport. People are able to press a green, yellow, or red button rating their experience at the restrooms. By analysing this data, it should be possible for Asito to improve their cleaning schedule and perform data-driven cleaning.
Figure 6.3 shows the application of the case to the canvas. Some interesting discoveries were made after the application. The implementation of the FeedbackNow system was not based upon a theoretical theory and, therefore, the Domain Model is empty. This is a clear example of a pre-processing characteristic. It is not clear for what reason the data is collected and what exactly is collected.
The in-processing characteristics are not found in the Asito case. The FeedbackNow system only consists of the green, yellow, and red button that can be pressed and, therefore, there are no in-processing biases that can be identified. The post-processing characteristics are clearly visible in the Asito case. However, in this case, there is no vicious feedback loop, but rather a virtuous feedback loop. The interventions that are done based on the FeedbackNow clicks will result in cleaner toilets for the visitors of the restrooms.
The following table can be assembled from different characteristics:
Pre-processing 1. No domain model and thus not clear what the data measures
In-processing -
Post-processing 1. Virtuous feedback cycle: cleanliness of toilets improve.
Table 5.4: Biases Asito
5.3.2
Large Dutch Bank Case Result
The mortgage department of one of the largest banks in the Netherlands wants to minimalize the data fields necessary to accept mortgages. They want to look at the data from an ethical standpoint and find out which data fields could be biased. The canvas could provide a way to analyse the data fields and identify the biases.
The workshop that was done showed that the case was too large to analyse as a whole. If there are more than a hundred data fields that need to be analysed, this will not fit on the canvas. Therefore, the decision was made to focus on a smaller amount of data points to analyse the practicality of the canvas for this case.
Chosen was to focus on the data fields related to the Income. These data fields included, among other things, The Loan to Income (LtI), the UWV information and the payslip. The LtI is a ratio that indicates how much you can borrow in relation to your income.
Figure 6.4 shows the application of the large Dutch bank case to the canvas. There were no pre-processing characteristics
identified, but the generate data step clearly showed which data was generated. The bank collects information from the UWV and the payslip. This information is very transparent.
During the workshop there was not much focus on the in-processing characteristics and, therefore, no biases have been identified for this type.
The post-processing characteristics seemed more clearly identifiable. Following the Use step of the canvas, a loan can either be accepted or denied. If the loan is denied, the person is asked for more information that proves he/she is capable of eventually paying back the loan. Following the feedback loop shows that no racist and/or discriminatory practices establish. This is, however, only true for the proxies that were included in the workshop. It is not possible to make any conclusions for different proxies.
6.
DISCUSSION
The results show that the canvas is very useful, but that it is not able to identify all the different biases and that it cannot be applied to all different cases. During the workshop at the large Dutch bank, it became evident that the canvas is too broadly oriented. The goal of the session was to look at the minimalization of the data from an ethical standpoint. However, at the end of the workshop, the canvas was mainly employed to look at the use of the data practice and less at the ethical concerns of some of the data fields. The canvas was also not considered self-explainable by the participants of the workshop, and the main reason for this is probably the broad orientation of the canvas. Therefore, it would be useful for the canvas to focus on a more specific topic such as the ethical implications of data practices.
From the pre-processing, in-processing, and post-processing characteristics the canvas was able to identify post-processing characteristics really well, but there could be some improvements for the identification of the pre-processing and the in-processing characteristics. We will discuss them one by one.
6.1
The Pre-processing Characteristics
The pre-processing characteristics were identified well in the canvas by the domain model and the generate data step. In the predictive policing and the Asito case, the domain model was essential to understand what the algorithm/model is actually measuring.The police are using the broken-window theory as a basis for their algorithm. This theory states that visible signs of crime encourage further crime. Therefore, the police include nuisance crime in the algorithm as well. They assume that small crimes will lead them to larger crimes. However, this is a misinterpretation of the broken-window theory and the inclusion of the nuisance crime data will not lead them to the larger crimes. It rather leads them to the impoverished neighbourhoods where nuisance crime happens the most. In the Asito case, there is not even a domain model included. The FeedbackNow system has been implemented without understanding what it really measures. The goal of Asito is to measure the Customer Experience (CX), but FeedbackNow does not seem to correlate with this.
7 is biased. Therefore, it is necessary to include some questions or remarks that will trigger the users of the canvas to think about their transparency and fairness of the data. It could include a question such as: What is the source of the data? Has the data been collected from the population or from a sample?
6.2
The In-processing Characterization
The identification of the variables included in the data practice come to pass in the artefacts and processes step. For the university ranking case, it is able to list the variables that will be used in the model. However, it does not become evident from the canvas whether these variables do contain biases.There seems to be a relation between the artefacts and processes step and the use stage of the canvas. A variable can be recognized as a discriminatory or problematic practice in the use stage. An example is the percentage of denied students, a variable that is included in the ranking model. This will cause universities to deny more students and end up higher in the ranking. The canvas was able to recognize this practice.
However, biases also occur with the exclusion of variables. The tuition fees are not included in the model and this will cause universities to raise these fees to improve their ranking. The canvas is not able to identify this problem. Questions could be added to trigger users of the canvas to think about the variables they include in their data practice. The following question could help: Do you disadvantage (groups of) people by excluding/including this variable?
More research is needed to find a conclusive answer on how to deal with the identification of these types of biases.
6.3
The Post-processing Characterization
The feedback cycle in the use stage of the canvas is very useful for addressing the post-processing biases. In the predictive policing case, the biased data practice was clearly identified. It was clear that impoverished neighbourhoods were targeted.In the university ranking case, the pernicious feedback loop was not identified, but this has to do with the in-processing biases that could not be identified.
The Asito and the large Dutch bank case also showed data practices, but are considered virtuous feedback cycles.
7.
CONCLUSION
The aim of this research was to validate the canvas of Alberts-De Gier. The canvas is designed to identify the ethical concerns of new data practices. It is highly valuable to know if the canvas is able to identify all the ethical concerns since there is a large increase in the use of data-driven technologies. We compared the canvas to other frameworks, applied the canvas to two cases from the literature and two cases from companies by doing interpretive research. As the research has demonstrated the canvas is different from existing frameworks and is useful for the identification of post-processing and pre-processing biases. However, the canvas was not able to identify in-processing biases correctly. Moreover, a shortcoming of the canvas is that it can be considered too broad.
In the first part of the research, which was concerned with the related works, it was shown that the canvas of Alberts-De Gier differentiates itself by its operationality.
In the second part of the research, concerned with the literature cases, it became clear that the canvas is highly valuable for identifying vicious feedback loops. The iterative function in the canvas is effective in analysing this. Moreover, the canvas describes clearly how data has been generated and does not just exist. However, it does not pinpoint what part of the data is biased exactly.
The last part of the research, in which company cases were applied to the framework, showed that the framework is practical as well. It is possible to fill in the case in the canvas. The main concern with the company application is that the framework is very broadly oriented. The companies cases are also less structured, and that makes it harder to find ethical concerns in the canvas.
For future work, it is necessary to have a more thorough understanding of the biases in the choice of variables. Their needs to be research in how other frameworks are able to identify these biases, and how the framework of Alberts-De Gier needs to be adjusted to work for in-processing biases as well.
8.
ACKNOWLEDGEMENTS
A huge thanks to Berend Alberts-De Gier for supervising the thesis, for the enthusiastic discussions about the topic, and the useful feedback that I received.
9.
REFERENCES
[1] Aboelela, S. W., Larson, E., Bakken, S., Carrasquillo, O., Formicola, A., Glied, S. A., Haas, J. and Gebbie, K. M. (2007), Defining Interdisciplinary Research: Conclusions from a Critical Review of the Literature.
Health Services Research, 42: 329–346. doi: 10.1111/j.1475-6773.2006.00621.x
[2] Alberts-de Gier, B. (2018, December 14). Understanding customers through data (PDEng Qualifier, Sept 2018). Retrieved May 4, 2019, from
https://medium.com/datafication-of- experience/understanding-customers-through-data-pdeng-qualifier-sept-2018-608ff55f6297
[3] Alberts-De Gier, B. (2019). The Datafication Framework. Unpublished paper
[4] Baeza-Yates, R. (2018b). Bias on the web.
Communications of the ACM, 61(6), 54–61. https://doi.org/10.1145/3209581
[5] Bowker, G. C. (2005). Memory practices in the sciences. Cambridge, Mass: MIT Press
[6] Cramer, H., Garcia-Gathright, J., Springer, A., & Reddy, S. (2018). Assessing and addressing algorithmic bias in practice. Interactions, 25(6), 58–63.
https://doi.org/10.1145/3278156
[7] Cukier, K. N., & Mayer-Schoenberger, V. (2015, September 15). The Rise of Big Data. Retrieved May 4, 2019, from https://www.foreignaffairs.com/articles/2013-04-03/rise-big-data
[8] Favaretto, M., De Clercq, E., & Elger, B. S. (2019). Big Data and discrimination: perils, promises and solutions. A systematic review. Journal of Big Data, 6(1). https://doi.org/10.1186/s40537-019-0177-4 [9] Friedman, B., Kahn, P., Borning, A. (2002). Value
sensitive design: theory and methods. University of Washington technical report, 02-12
8
Systems, 14(3), 330–347.
https://doi.org/10.1145/230538.230561
[11]Gregor, S. (2006). The Nature of Theory in Information Systems. MIS Quarterly, 30(3), 611–642.
https://doi.org/10.2307/25148742
[12]Gregor, S., & Jones, D. (2007). The Anatomy of a Design Theory. Journal of the Association for Information Systems, 8(5), 312–335.
https://doi.org/10.17705/1jais.00129
[13]Kubina, M., Varmus, M., & Kubinova, I. (2015). Use of Big Data for Competitive Advantage of Company.
Procedia Economics and Finance, 26, 561–565. https://doi.org/10.1016/s2212-5671(15)00955-7 [14]Manovich, L. (1999). Database as Symbolic Form.
Convergence: The International Journal of Research into New Media Technologies, 5(2), 80–99.
https://doi.org/10.1177/135485659900500206 [15]Myers, M. D. (1997b). Qualitative Research in
Information Systems. MIS Quarterly, 21(2), 241–242. https://doi.org/10.2307/249422
[16]O’Neil, C. (2016). Weapons of math destruction: How big data increases inequality and threatens democracy. New York, NY: Crown Publishers
[17]Redden, J., & Brand, J. (2017, December 9). Data Harm Record. Retrieved May 4, 2019, from
https://datajusticelab.org/data-harm-record/ [18]Schäfer, M. T., & Franzke, A. (2017). Data Ethics
Decision Aid [Illustration]. Retrieved May 4, 2019, from
https://dataschool.nl/wp-content/uploads/sites/272/2018/04/DEDA.worksheet.EN _.20170821.transparent.pdf.
[19]Walls, J. G., Widmeyer, G. R., & El Sawy, O. A. (1992). Building an Information System Design Theory for Vigilant EIS. Information Systems Research, 3(1), 36– 59. https://doi.org/10.1287/isre.3.1.36
![Figure 2.3: Use Step of the Canvas [3]](https://thumb-us.123doks.com/thumbv2/123dok_us/9658746.467916/2.595.71.264.70.175/figure-use-step-canvas.webp)