=trans
THE DESIGN AND IMPLEMENTATION OF
SITUATION AWARE SMART LOGISTICS IN
PERISHABLE FOOD TRANSPORTATION
[DATE]
Author
Gilang Charismadiptya
Supervisor
Dr M.E. Iacob Dr.ir. M.J. van Sinderen
Company
Supervisor
Maik Wesselink
i
S
UMMARY
An exception is “any deviation from an ‘ideal’ collaborative process that uses the available resources to achieve the task requirements in an optimal way” [2]. The exception handling process is slow. It may delay the delivery of the product. In consequences, this may cost the customers trust and their money. Also, because the products are perishable, it may get spoilt which will cost the company.
The food industry must consider food safety when transporting products. There are many hazards that can occur during transportation. For example, lack of security, improper handling, improper refrigeration, improper management of transportation units, improper loading practices, conditions or equipment [1]. The risk increases the chance of logistics exception
Prior research has shown many architectures for leveraging the internet of things into the logistics fields. However, most of the architecture purpose is to identify and record the location of the transported objects. However, there are not many architectures available for detecting logistics exception and provides useful information in respond. Existing architecture includes logistics exceptions management, described in [75] which focus on detecting the exception, and EURIDICE [43], which focus on gathering valuable information for logistics operation. Nevertheless, none of the mentioned architecture focuses on the integration of exception detection capabilities and presenting the information surrounding the exception into a real business process.
This thesis attempts to fill the gaps by designing an enterprise architecture for detecting and reacting to logistics exceptions. The enterprise architecture serves as a guide for implementing the concept of situation-aware logistics in real condition. Furthermore, I develop the architecture to serve as the basis for implementing artificial intelligence into logistics exception management for future research. I perform this study by using the design science methodology, which emphasize on stakeholder’s satisfaction.
The result of this design study is, the designed system can fulfil the stakeholder desire. However, some improvements are still possible. For example, the result suggests the addition of the scanning process have a measurable impact on the business process. Though, the scanning process is still within the accepted level, especially when compared to the real loading process that could take an hour to finish. The test subjects notify the customer faster compared to the previous business process.
ii
A
CKNOWLEDGEMENTS
First, I would like thanks to my parents, that always supports me in my life and give me direction when I lost.
I would like to thank CAPE Groep, which gives me a place and facilities to work on my thesis. Especially Pieter verkoost that accept and believe in me that I can contributes my thesis at Cape Group. Also to Maik Wesselink and Sebastian Piest as my mentor from the company. They always gave me useful advice and feedback based on their experience and technical knowledge.
I would like to express my gratitude to Dr M.E. Iacob and Dr.ir. M.J. van Sinderen for being my thesis supervisor. Their guidance and feedback help me a lot during my time working on the thesis.
I also want to thank my cats, and all the internet cats I watched during my procrastination, for making me smile and giving me the energy to keep moving forward. Finally, I would like to thank all my friends and loved one for supporting me during my darkest hour working on this project.
Gilang Charismadiptya Enschede,
iii
T
ABLE OF
C
ONTENTS
Summary ... i
Acknowledgements ... ii
List of tables ... iv
List of figures ... v
1
Introduction... 7
1.1 Situation-aware smart logistics ... 7
1.2 Research goals ... 8
1.3 Methodology ... 9
1.3.1 Research methodology ... 9
1.3.2 Prototype development methodology ... 10
2
Problem investigation ... 11
2.1 The case ... 12
2.1.1 About the perishable food company (PFC) ... 12
2.1.2 PFC product transportation overview... 12
2.1.3 Problems ... 15
3
Requirements analysis ... 16
3.1 Stakeholders analysis ... 16
3.1.1 Transportation manager ... 18
3.1.2 Employees ... 18
3.1.3 Customers ... 19
3.1.4 System designer ... 20
3.1.5 System administrator ... 20
3.1.6 System integrator ... 21
3.1.7 The government ... 21
3.1.8 The consultant ... 22
3.1.9 The supplier ... 22
3.2 Design requirements analysis ... 23
4
Literature review ... 25
4.1 Search terms ... 26
4.2 Literature databases... 27
4.3 Inclusion criteria ... 27
4.4 Exclusion criteria ... 28
4.5 Literature review results... 28
4.5.1 LRQ1: Reference architecture ... 28
4.5.2 LRQ2: Logistics exceptions ... 38
iv
4.5.4 LRQ5: Usability principles ... 42
5
The proposed design ... 44
5.1 Business process ... 44
5.2 System architecture ... 50
5.3 Data model ... 52
5.4 User interface ... 56
5.4.1 The loading/unloading employee role ... 57
5.4.2 Transportation manager dashboard ... 59
6
Prototype implementation ... 60
7
Validation ... 63
7.1 Hypotheses ... 63
7.2 Experiment design ... 64
7.3 Experiment result ... 72
7.3.1 [H1] By using the system, the stakeholder's desire will be fulfilled ... 72
7.3.2 [H2] By using the system, time to load the items should increase, but it will be negligible. ... 77
7.3.3 [H3] By using the system, the exception can be detected faster, leads to faster customer awareness. ... 78
7.3.4 [H4] The knowledge of which pallets contains sensitive items during transportation exception can minimise the items loss because the pallet can be prioritised during the mitigation operation. ... 80
8
Conclusion ... 82
8.1 Research questions ... 82
8.2 Limitation ... 84
8.3 Contribution ... 84
8.4 Future works recommendation ... 85
9
References ... 86
[image:5.595.66.527.72.562.2]L
IST OF TABLES
Table 1 mapping between the stakeholder's slots and roles ... 17Table 2 The desire of the stakeholders ... 23
Table 3 Functional and non-functional requirements ... 25
Table 4 Literature review search terms ... 27
Table 5 Discovered reference architecture... 28
Table 6 IoT-A requirements, mapping to the smart logistics planning architecture requirements ... 33
Table 7 Classification of exceptions [74] ... 38
Table 8 First sprint user stories ... 61
v
Table 10 Experiment protocol for [H2] ... 66
Table 11 Test protocol for [H3] ... 70
Table 12 Test protocol for [H4] ... 72
Table 13 Expert opinion analysis... 75
L
IST OF FIGURES
Figure 1 The design cycle [8] ... 9Figure 2 The research methodology ... 10
Figure 3 Prototype development methodology ... 11
Figure 4 PFC product transportation business process overview ... 13
Figure 5 Production centre to the distribution centre transportation process ... 14
Figure 6 Transportation exception handling process ... 14
Figure 7 PFC applications layer ... 15
Figure 8 The onion model ... 17
Figure 9 Transportation manager motivation model ... 18
Figure 10 Employees motivation model ... 19
Figure 11 Customers motivation model ... 20
Figure 12 System designer motivation model ... 20
Figure 13 System administration motivation model ... 21
Figure 14 System integrator motivation ... 21
Figure 15 The government motivation model ... 22
Figure 16 Cape motivation model ... 22
Figure 17 Ahrma motivation model ... 22
Figure 18 Goal realisation model ... 24
Figure 19 3-Layer architecture [34] ... 29
Figure 20 5-layer architecture [30] ... 29
Figure 21 Cloud computing-based architecture [57] ... 30
Figure 22 Fog computing-based architecture [60] ... 30
Figure 23 Big data analytics in fog and cloud architecture [62] ... 31
Figure 24 Relationship between IoT-A reference model ... 32
Figure 25 IoT-A functional view [41] ... 34
Figure 26 EPCIS generic data type [52] ... 36
Figure 27 EPCIS architecture layers [52] ... 36
Figure 28 EPCIS architecture [52] ... 37
Figure 29 Event processing architecture [75] ... 40
Figure 30 COLLECT architecture [78] ... 41
Figure 31 Exception handling process ... 45
Figure 32 Infrastructure for gathering data ... 47
Figure 33 Production center to the distribution center transportation process ... 48
Figure 34 Situation aware logistics business function ... 48
Figure 35 The system architecture ... 50
Figure 36 Communicating with external systems ... 51
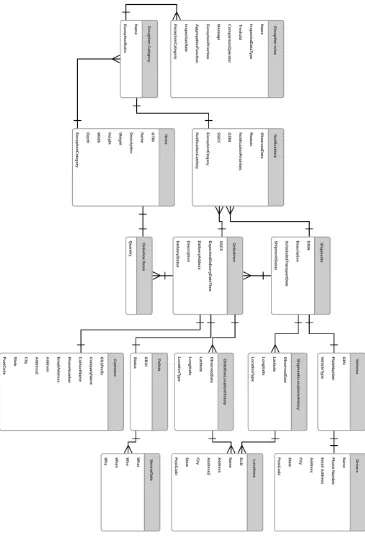
Figure 37 Entity relationship diagram ... 55
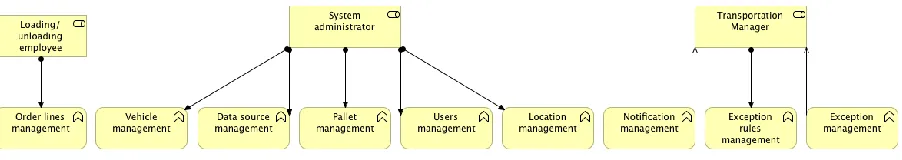
Figure 38 User role in situation aware logistics ... 56
vi
Figure 40 Scan items user interface ... 57
Figure 41 Pallet-orderlines association user interface ... 58
Figure 42 Transportation manager dashboard ... 59
Figure 43 Shipment Detail ... 60
Figure 44 Infrastructure for Situation-aware logistics ... 62
Figure 45 Loading simulator... 65
Figure 46 Rate of temperature increase [89]... 68
Figure 47 Event simulator ... 68
Figure 48 Notify customer simulation tool ... 69
Figure 49 Tool for simulating mitigation operation ... 71
Figure 50 Barcode scanning experiment results ... 77
Figure 51 Time to customer notification ... 79
Figure 52 Item loss experiment result ... 80
7
1
I
NTRODUCTION
1.1
SITUATION-AWARE SMART LOGISTICS
Perishable food logistics is the process of planning, implementing and controlling efficient, functional flow and storage of perishable goods, related services and information from one or more points of origin to the points of production, distribution and consumptions to meet customers’ requirements. The food industry must consider food safety when transporting products. The top 5 food safety hazards during transportation are lack of security, improper handling, improper refrigeration, improper management of transportation units, improper loading practices, conditions or equipment [1]. Moreover, the company also need to consider the transportation risks, such as road accidents. The risk increases the chance of logistics exception. An exception is “any deviation from an ‘ideal’ collaborative process that uses the available resources to achieve the task requirements in an optimal way” [2]. First, the company must identify the type and the reason for the exception. Then, the company must identify the affected products and its customers. Finally, the company can notify the customers and design a mitigation plan.
The exception handling process is slow. It may delay the delivery of the products, and the customers know about the possible delay too late. In consequences, this may cost the customers trust and their money. Also, unaffected products may get delayed by the exceptions. Because the products are perishable, it may get spoilt which will cost the company. Therefore, a perishable food company must react as quick as possible to an exception.
There are many points of optimisation for ensuring quick exception response. This study focuses on two things: automatic exception detection and improving traceability. Automatic exception detection is the capability to detect a possible exception automatically and informs the responsible transportation manager. Having automatic exception detecting capabilities will give the transportation manager time to react, and eliminates the time need to identify the exception type. Exception detection is made possible by leveraging real-time data from sensors, embedded into the products. The definition of traceability is the ability to trace and follow a food, feed, food-producing animal or substance intended to be, or expected to be incorporated into a food or feed, through all stages of production, processing and distribution [3]. By having traceability information, identification of the affected products and its customers can be quick.
Internet of things is a term first coined by Kevin Ashton, the director of the company that created the global standards for RFID [4]. Internet of things is defined more precisely by IEEE in 2015. Internet of Things is a network that connects uniquely identifiable “Things” to the Internet. The “Things” have sensing/actuation and potential programmability capabilities. Through the exploitation of unique identification and sensing, information about the “Thing” can be collected, and the state of the “Thing” can be changed from anywhere, anytime, by anything [5]. The advantage of using internet-connected devices is the user can monitor, and interact with the devices anytime, anywhere.
8 heart rate to detect illness. In the healthcare industry, internet of things devices successfully used to track and monitor the condition of the patient and the condition of medical equipment [6]. The agriculture industry uses IoT devices to monitor the environment and livestock. Factories use it to monitor the health of the production equipment.
I call the information system to provide exception detection and mitigation assistance by using IoT enabled sensors as situation-aware logistics systems. The problem is, currently only a handful of architecture has been described that incorporate the idea into an actual information system. A new system architecture needs to be devised. Thus, the goal of this study will be the design of the architecture of situation-aware logistics.
This thesis is part of the DATAREL project. The project objective is to expand the knowledge of employing data from Internet-connected sensor devices embedded into transportable items by utilising recently developed data processing techniques such as big data and artificial intelligence to detect emergence. The result of the project is expected to improve the resilience, real timeless, efficiency, and dynamics of logistics planning operation. NWO is funding the project [7]. The project is running for four years, starting in February 2018.
1.2
RESEARCH GOALS
The primary goal of this research is to define an architecture and its implementation for capturing and processing IoT data for improving logistics situation awareness. The study formulates the problems into the primary research questions:
What is the suitable design for situation aware logistics system?
To answer the primary research question, first, the study must define what the risks in perishable food transportation are and how they can be measured. The measure is essential to detect the exceptions as exceptions happen when the risks become concrete. Then, we need to know what the stakeholders want from such systems. I will design the architecture from the stakeholder’s desire and the defined risks measures. Finally, I need to know how the current business process handles logistics exceptions. The knowledge of the current business process is essential to know which part of the business process needs to be modified to integrate the designed system.
The designed architecture may or may not produce expected effects. That is why the designed architecture must be validated; the study must define the measure of the system performance to validate the architecture.
As a result, the study decomposes the primary research questions into smaller research questions: 1. What are the requirements for smart logistic planning systems to manage the risk? 2. What is the design of the situation-aware logistics system?
9
1.3
METHODOLOGY
1.3.1
R
ESEARCH METHODOLOGYThe study will use the design science research methodology by Roel J. Wieringa [8]. The methodology is suitable for designing an artefact for solving a problem in a context. An artefact is a result that comes from the design activities. A context is where the artefact can effectively solve a problem. The methodology describes a workflow to do design science research, called the design cycle. The design cycle consists of three iterative phases: problem investigation, treatment design, and treatment validation. The diagram below describes the design cycle:
FIGURE 1THE DESIGN CYCLE [8]
The workflow starts with problem investigation. In this phase, we will define the problems and the context of the problems. The first task is to define the stakeholders and their goals. The stakeholders are the primary user of the system. Therefore, it is essential to know what they want from the system. The next step is to create the conceptual framework. The conceptual framework defines the components that will interact with other components or the context.
The treatment design phase begins with defining the requirements. A requirement is the desire of the stakeholders that commit resources to realise their wish [8]. The stakeholders may not know their requirements. Therefore, the designer must cooperate with the stakeholders to define the requirements together. The result is the contribution argument, which is a prediction that the artefact will satisfy the stakeholder's requirements. There are two categories of requirements, functional requirement and non-functional requirement. The functional requirements are the desired function that an artefact must have. The non-functional requirements are the quality properties of artefacts.
Implementation evaluation / problem investigation •Stakeholders & goals
•Conceptual Framework
•Phenomena mechanism and reasons
•Effects & goal contribution
Treatment design •Requirements
•Existing treatments
•New Design
Treatment validation •Effects of the treatments
•Trade-offs
•Sensitivity
10 The process of designing an artefact is a cycle because the product from an iteration may be proven unusable after validation. The proposed design comes from the cycle is not the best solution. However, it serves only as a candidate solution. In the second iteration, we may investigate the validation result, and design a better artefact. This study will only perform the first iteration of the design cycle. The design may require several iterations before it finished.
Existing treatments provide valuable insights into the ways the problems can be solved. After analysing the existing treatments by comparing it to the requirements, the designer can decide to improve existing treatments, reuse components of the existing treatments, or create an entirely new treatment design.
The treatment validation objective is to justify whether the treatment contributes to the stakeholder’s goals when implemented in the problem context. The study must provide a validation model to validate the treatment. A validation model consists of a representation of the artefact (A prototype) and the representation of intended context. To study validation models, the literature provides a list of research methods: expert opinions, single-case mechanism experiments, technical action research and statistical difference-making experiments. The study chooses to use experts’ opinions and single-case mechanism experiments to study the validation model. The study gathers expert opinions by presenting the treatment model (the prototype) to them and capture their prediction of the effects of the treatments. Based on the methodology described above, the study will follow the steps below to perform the research:
FIGURE 2THE RESEARCH METHODOLOGY
1.3.2
P
ROTOTYPE DEVELOPMENT METHODOLOGYThe study must build a representation of the artefact to create the validation model. The study called this the prototype. The validation model artefact of this study is the prototype of the situation-aware logistics system. Situation-aware logistics system is an information system. An information system (IS) is an organised system for the collection, organisation, storage and communication of information. An information system consists of software, hardware and the organisation. This study will use the Scrum framework to develop the software part of the prototype.
11 roles, events, rules and artefacts. The scrum rules regulate the interaction and relationships between scrum components.
The stakeholders in the scrum framework are called the scrum team. It comprises of three stakeholders: a product owner, a development team and a scrum master. The primary role of a product owner is to write the product backlog and prioritise which features are the most important for them. The product backlog is the list of requirements, constructed as stories. A product owner is a single person who captures the desire of the stakeholders.
The development team are responsible for the incremental development of the product. The sprint team need to be small to remain nimble but enough to complete significant work in a sprint [9]. A sprint is an interval in which a product can be incrementally developed. The stakeholders in scrum perform sprint planning to determine the goal of the sprint. We must achieve the goal by implementing the backlog. A sprint goal can be adjusted according to factors such as the evaluation of the latest product increment, the capacity of the team and the past performance of the team.
The scrum master is responsible for promoting, coaching, and supporting the team to implement the Scrum method. The scrum master promotes the Scrum framework to a new member of the team that does not know about Scrum. The scrum master facilitates the product owner to build product backlog. The scrum master can help schedule a scrum meeting such as the scrum planning. The person is responsible for scrum implementation in the organisation [9].
The study is going to use the Scrum framework to build the prototype because it resembles the design cycle of the design science research methodology. Both methodologies exhibit the iterative nature of design development. Both start with the goals of the stakeholders and build the artefact from it. However, the purpose of the methodologies is different. The design science research methodology aimed at doing research, while the scrum aimed at building product. Hence, in this research, the study uses both, design science research methodology for doing the research and the Scrum framework for building the prototype. The diagram below presents the method for developing the prototype.
FIGURE 3PROTOTYPE DEVELOPMENT METHODOLOGY
12
2.1
THE CASE
2.1.1
A
BOUT THE PERISHABLE FOOD COMPANY(PFC)
PFC is a food production company that supplies food for the healthcare industry. Their client is ranging from hospitals, nursing homes, and home care in the Netherlands. Aside from the fresh meat product, the company can also deliver groceries to a various healthcare institution.
PFC currently have a production centre branch in a city, in The Netherlands. They also have a new distribution centre in another district in the city. The new distribution centre has a large freezer with an area of 3.850m2 and an expedition hall with a total area of 5300m2. They must transport the product from their production centre to a distribution centre. Currently, they do not track the movement of the product between the locations. Their ERP systems treat both locations as one. An order line identifies the transported products.
Risk such as road accident, thief, unapproved transport of unrelated goods, a cooling system failure that can lead to food spoilage may happen. When that happens, tracing back to what are the affected order line, what causes the problems can be slow. The company needs a system that can provide tracking and risk mitigation can be developed to solve the problems.
2.1.2
PFC
PRODUCT TRANSPORTATION OVERVIEWPFC is composed of many business services. Examples of the services are the production service, customer service, financial service and the logistics service. The logistics service is further composed of many services. The study will focus on the product delivery service. The product delivery service is responsible for product movement from the production centre to the distribution centre, and from the distribution centre to customer.
product transportation function realised the product delivery service. The function consists of several processes and events. The first process is the production centre into distribution centre process. When that process completed, and the products transferred to the distribution centre, a transportation success event will be triggered. The system will notify the transportation manager. Then, the transportation manager will start the transportation process from the distribution centre to the customers.
13
FIGURE 4PFC PRODUCT TRANSPORTATION BUSINESS PROCESS OVERVIEW
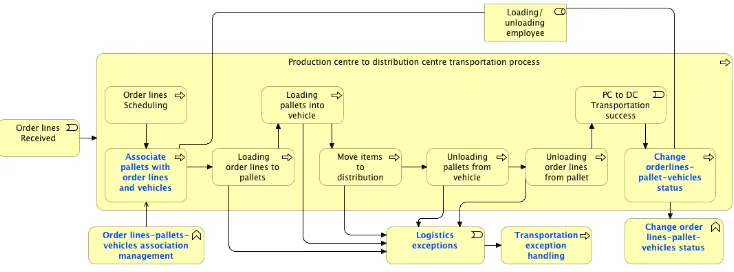
This thesis will focus on the exception handling of the production centre to distribution centre transportation process. The process consists of scheduling, loading, transporting and loading perishable goods. The process is handled by multiple roles, from the transportation manager which responsible for the business function, loading/unloading employees and the vehicle operator. All roles must coordinate their action cooperatively to produce efficient transportation process.
The transportation process begins when the orderlines shipping ready events raised from the ERP systems. The transportation manager will schedule the order lines for shipping, using the picking systems. There are three different picking systems available. The picking systems will determine the loading time, the vehicle, the order lines locations inside the pallet and the pallet locations inside the vehicles. The scheduling process must consider the priority of the order lines, the expiration date, the type of perishable products (For example, the loading employee should place heavier products below lighter products inside the vehicles) and the cooling requirements.
14
FIGURE 5PRODUCTION CENTRE TO THE DISTRIBUTION CENTRE TRANSPORTATION PROCESS
PFC is currently doing a lot of manual works to handle process exceptions. Their transportation exception handling process starts by gathering information about the exceptions. The information includes the types of exceptions, the location of the exceptions, the reason the exceptions occurred, the standard process to handle the type of exceptions and the responsible stakeholder. Then, because the order lines inside the vehicle not tracked, manual workers must unload the pallets from the vehicle, then unload the order lines from the pallets. After that, the items conditions must be identified and checked. Also, the transportation manager must identify the customers. Then, the transportation manager can create a mitigation plan based on all the gathered information.
The mitigation plan includes the necessary information to solve the exceptions. The mitigation plan contains a list of saveable products. At this point, the transportation manager should inform both the unaffected and the affected customers of the delay. Figure 6 depicts the whole transportation exception handling process.
FIGURE 6TRANSPORTATION EXCEPTION HANDLING PROCESS
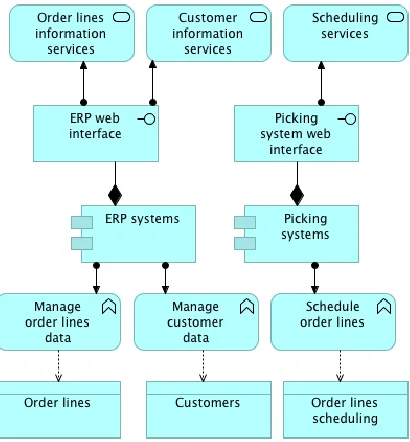
15 data. The ERP systems provide a web interface to access the data. For scheduling, the picking systems managed the information. The web interface provides logistics manager information to the systems. Figure 7 shows the various applications and data types used in the business process.
FIGURE 7PFC APPLICATIONS LAYER
2.1.3
P
ROBLEMSCurrently, The ERP system that PFC use considers the production centre and the distribution centre as one. The condition possesses problems because of the untracked movements of their products. The untracked movements create problems described below:
2.1.3.1
Slow response to accidents
An accident is an unexpected event which causes loss, a decrease in the value of resources or an increase in liability. Examples of accidents are traffic accidents, thieves, loading/unloading accidents, equipment failure. Because the movements between the production centre and the distribution centre not tracked, the company cannot know which order lines are affected by an accident straightaway. The company needs to provide a worker to inspect and trace the products inside the vehicle sequentially. The manual tracing process is time-consuming. The tracing process cause mitigation decision to be delayed. The result is the timeliness of the product delivery may be affected. The delay may also cause end client to be informed too late about the accidents, affecting their business.
2.1.3.2
Partially transparent supply chain
16
3
R
EQUIREMENTS ANALYSIS
A requirement is a property of the treatment desired by some stakeholder, who has committed resources (time and money) to realise the property[8]. Therefore, first, we need to identify who the stakeholders are. Then, we must find their desire. I will identify the stakeholder's desire by performing a literature review and conducting an interview with the stakeholders. After that, the desire must be prioritised based on the importance of the person towards the projects. The stakeholder's desire is not the requirements for designing the artefacts. The desire is the goal of the system. The designer of the system must specify the requirements to achieve that goal.
To summarise, I use the following steps to determine the architecture requirements: 1. Stakeholders analysis.
2. Architecture requirements analysis.
3.1
STAKEHOLDERS ANALYSIS
In this section, I identify and describes the stakeholders of the case study. A stakeholder of a problem is a person, group of persons or institution who is affected by treating the problem [8]. A design is generated to solve the stakeholder’s problems. That is why the stakeholders’ analysis is vital. I use their desire as the basis of the requirements. All stakeholders have its desire and goal for using the system. The effect of treating a problem may not be beneficial to all stakeholders. There may be stakeholders whose interest is against one another. The system must make priorities based on the resource committed.
To identify the stakeholders, the design science research methodology book provides references to the onion model. The onion model is a classification system of stakeholder designed for determining stakeholders in a project [10]. The onion model proposes the concept of circles, slots and roles. The circles illustrate the relationship distance between the stakeholders and the actual system. The closer the ring to the centre means the closer its relation to the system. The circle contains slots, which predicts generic roles that may be needed by a project. The slots may not be used or filled with specific roles that interact with the projects.
17
FIGURE 8THE ONION MODEL
The circles contain the classification of possible stakeholder. In this study, I will not use all the available stakeholder’s slot. I decided to fill the following slots: Normal operator, operational support, maintenance operator, functional beneficiary, developer, regulator, and the negative stakeholders. I omitted the rest because they do not commit resources to the system, or not relevant to the study. The regulator
The normal operator is the person that feeds inputs and command to the system. This person directly interacts with the system. The maintenance operator job is to ensure the system working as intended. The person is responsible for performing maintenance & troubleshooting. The operational support provides training on how to use the system to the normal operator. On the containing circle, we have the functional beneficiary, which is the person who uses the result from the system. In the wider environments, the developer is responsible for designing and realising the system. The regulator is responsible for ensuring the products comply with the law.
From the available slots, I decide the matching role based on the context of the case. A slot may contain multiple roles. The table below contains the slots and the matching roles.
Slots Roles
Normal operator Loading/unloading employees, Transportation
operator
Operational support System implementor
Maintenance operator System administrator
Functional beneficiary Transportation manager
Developer System designer, programmer
Regulator The government
Negative stakeholders Hackers
18 To know the desires of the stakeholders, I performed an interview with the identified person that have the roles in the case. The following section will describe the role of each stakeholder.
3.1.1
T
RANSPORTATION MANAGERThe transportation manager is responsible for executing the transport process [11]. In this case, the transportation manager is responsible for scheduling the transportation between the factory warehouse and the distribution centre. The scheduling process is a decision-making problem. To make the decision, transportation managers need information that includes resource availability and delivery requirements so they can arrange shipments to take advantage of load/carrier consolidations or routing efficiencies [12]. We can improve the transportation efficiency by considering product flows, including volume, frequency, seasonality, physical characteristics, and special handling requirements [11]. Transportation manager has to ensure minimal customer service failures and unnecessary cost [12]. The transportation plan must consider the possibility of an exception to achieve minimal service failures. An exception is a deviation from the "optimal" (or acceptable) process execution that prevents the delivery of services with the desired (or agreed) quality[13]. Currently, the response time to an exception is slow. Some part of the supply chain causes the slowness when not tracked. It causes backtracking the order takes a long time to finish. There are 3 activities associated with improving service quality by exception handling: analysing, predicting, and preventing [13]. Hence, the logistics manager wants to know when an exception is happening, what causes the exception, who cause the exception, how to deal with the exception, and what is affected by the exception. The diagram below shows the motivation of the transportation manager.
FIGURE 9TRANSPORTATION MANAGER MOTIVATION MODEL
19 There are two employee’s roles in the case. The loading/unloading operator and the vehicle operator. The loading/unloading operator is responsible for loading or unloading the items from the vehicle. The loading/unloading employees are located on both the factory and the distribution centre. The employee’s roles aside from loading or unloading the items are to give the transported items an identifier and submit the status of the items. The roles require the employee to interact daily with the systems. Therefore, usability is crucial for them. The definition of Usability is the effectiveness, efficiency, and satisfaction of the user [14]. Usability is important to minimise data entry mistake, lower the learning barrier and reduce the time for data entry, making the transportation process efficient. The vehicle operator is responsible for delivering the items from the factory to the distribution centre promptly. The vehicle operator must report any anomalies during the transportation. The process is vital to monitor the items conditions. The report is necessary to ensure the speed of exception detection. For that reason, the vehicle operator desire usability. The diagram below depicts the desire of the employee
FIGURE 10EMPLOYEES MOTIVATION MODEL
3.1.3
C
USTOMERSThere are five dimensions of service expectation: reliability, tangibles, responsiveness, assurance and empathy [15]. Reliability is the dependability of the service provider to uphold its promise. The Reliability correlates with the quality of service. Tangibles are the service appearance. The responsiveness is the ability of the company to help the customer in needs. The assurance is the ability to convey trust and confidence.
The dimension of reliability and tangibles correlates with the quality of service. One of the main tasks of the rapidly growing service sector is to ensure the quality of service to the customers [16]. The study suggests services that lack execution speed, flexibility and punctuality perceived as having low service quality [16]. These metrics depicts the performance of the logistical operation. Hence, logistics planning should concentrate on ensuring it.
20 assemble a follow-up plan when an exception happened. The notifications are essential, because the customer activities may be disturbed by the exceptions. Fast notification `gives the customers time to decide how to handle the effect of the exception.
In summary, the customers want the goods to the delivered in time, and intact. The customers also want to track where is the current location of their order, and when their order will have arrived. Finally, they want notifications when an accident happened as soon as possible.
FIGURE 11CUSTOMERS MOTIVATION MODEL
3.1.4
S
YSTEM DESIGNERThe role of a system designer is to analyse and design the technical specification. The person will be held accountable for every decision that leads to system design. The person needs to communicate with the stakeholders to gather the requirements, determine the priority of the requirements and decide, and which requirements should the system designer implements.
A system designer wants a system that can cope with changes. The system designer wants that because the business environment is always changing. The company must continuously adapt to the new business trends and requirements. The changes will affect the systems. A system that could not adapt quickly will need significant rework by the system designer in the future. Moreover, if the cost of implementing the changes is enormous compared to creating new systems, the company may replace the systems. Both scenarios mean the company will lose time and money. Therefore, it is in the best interest of the system designer to design a system that can cope with changes.
FIGURE 12SYSTEM DESIGNER MOTIVATION MODEL
3.1.5
S
YSTEM ADMINISTRATOR21 performing backup and recovery when a fatal error occurred. The system administrator wants the system to be scalable, secure, stable and easy to maintenance.
FIGURE 13SYSTEM ADMINISTRATION MOTIVATION MODEL
3.1.6
S
YSTEM INTEGRATORThe system integrator is responsible for implementing the concrete application into the organisation. The person will train the involved stakeholders on how to use the system. The person also responsible for measuring the effect of the system, to validate whether the system meets the objective. The system implementor wants the system to be as easy to use as possible, so the organisation can accept the new system without too much effort to learn.
FIGURE 14SYSTEM INTEGRATOR MOTIVATION
3.1.7
T
HE GOVERNMENT22
FIGURE 15THE GOVERNMENT MOTIVATION MODEL
3.1.8
T
HE CONSULTANTCape Groep is an information technology consulting company established in the Netherlands. They mainly have an expertise in building information technology system for logistics operations. Examples of their clients are PostNL and HST Groep. Cape group is looking for a new technology solution to solve problems in logistics. That is why they partner with various universities and research group in the Netherlands. Cape Groep is part of the DATAREL project. They contribute to this research by providing resources and knowledge needed to finish the research. What cape Groep wants is a prototype implementation of the situation awareness logistics concept.
FIGURE 16CAPE MOTIVATION MODEL
3.1.9
T
HE SUPPLIERAhrma is an information technology logistics company in the Netherlands. They serve clients in the field of foods & beverage, medicine and retail logistics industry. One of their products is the smart pallet. The pallets can be reused multiple times, and have sensors embedded in it. The sensor can detect temperature, weight and more. The Ahrma cloud store the data from the sensors. Ahrma is also part of the DATAREL project. They help this research by providing the IoT devices. Their desire from this project is to use smart pallets as the IoT device, as that will show their clients what the IoT devices can do.
23 The table below summarises the stakeholders and their desired goals for the system.
Roles Desired Goals References
Transportation manager Want to improve traceability.
Want to monitor exceptions occurrence.
[11][12][13 ]
Customer Want timely exception notifications. Want to monitor items conditions.
[15][16] The government Want the company to adhere to the laws.
(Information security & privacy)
[17][18] The employees
(Loading/unloading operator & Driver)
Want their work to be uninterrupted (Usability). [14]
Ahrma (Supplier) Want the system to use Ahrma products. Interview Cape Groep (Consultant) Want to realise the DATAREL concept
Want the system to be adaptable to a different company
Interview
System designer & programmers
Want the system to be simple and easy to update. [14]
System integrator Want usability. [14]
System administrator Want a powerful administrative function [14]
TABLE 2THE DESIRE OF THE STAKEHOLDERS
3.2
DESIGN REQUIREMENTS ANALYSIS
I derived the architecture requirements for situation aware logistics from the desire of stakeholders depicted in Table 2. First, I set a target for each of the desired goals. I use the targets as the basis to create the measure of stakeholder’s goal achievement. The measure will be used to validate the design. I also use the targets to decide what kind of design principle should be used to build the design. I use the principle as the guideline to specify the exact architecture requirements. This way, the reasoning behind a requirement specification can be traced back to the stakeholders. I use it to make sure only essential requirements implemented in the systems.
The most important person responsible for PC to DC transportation business process is the transportation manager. He is the one that will use the output of the system. The transportation manager is also responsible for notifying the customers, which is related to the customer's desire. The customers desire to be notified as soon as possible when an exception that will affect their product delivery happened. Hence, I will discuss his requirements first. The transportation manager wants three things: improved transparency, traceability and monitor exceptions.
24 capabilities to register and deregister a pallet. It also must have the capabilities to manage the data from the smart pallets. The managing capabilities include the abilities to store and remove the data. In Figure 7, we can see the applications and data entity that is used for PC to DC distribution process and the exception process. There are two applications: ERP systems and the scheduling systems. The ERP systems are used to store the order lines data. The scheduling systems are used to schedule the order lines into the vehicles. The designed system needs to handle the data from all the mentioned applications.
Furthermore, In the future, the applications might become different. For example, because of an update, changing vendors or maintenance. Therefore, the designed architecture requires data integration capabilities that are flexible to change.
The employee (Both the loading/unloading employee and the vehicle operator) are responsible for putting the association between the order lines with pallets and the pallets with the vehicle. Because they will use it daily, they need a data input method that is fast and easy to learn. This goal also aligned with the system integrator goal. The person is responsible for giving the employee training to use the systems. An easy to use systems will help to make the training process faster. Therefore, it is required for the design to adhere to the usability principles.
FIGURE 18GOAL REALISATION MODEL
25 measured and that indicate the presence of the property. Therefore, I represent the functional and the non-functional requirements as a table below:
Ref Functional requirements Ref Non-functional requirements R1 Manage exceptions report NFR1 Usability
R2 Manage notifications NFR2 Information security
R3 Manage exceptions rules NFR3 Accuracy
R4 Generate exception notification NFR4 Effectiveness R5 Manage IoT sensors
R6 Manage IoT sensors data
R7 Manage order lines associations R8 View exceptions report
R9 Manage exceptions R10 Manage vehicles data R11 Manage driver’s data R12 Manage data integrations R13 Manage users
TABLE 3FUNCTIONAL AND NON-FUNCTIONAL REQUIREMENTS
What I mean by manage in Table 3 is the capability to create, read, update and delete the data managed by the system. I use the prefix R followed by a number to denote a functional requirement. Consequently, I use the prefix NFR to denote a non-functional requirement.
4
L
ITERATURE REVIEW
The next steps after finding the requirements are to review the existing solution in the literature. The literature review is essential to know the current best practice. I use the requirements determined in the previous section to scope the topic of the literature that I should explore.
The primary purpose of the situation-aware logistics information system is to process data that comes from IoT devices. There are many problems with managing the IoT data, and many ways to solve them. For example, where should the data be stored and processed, How the architecture should be structured, what kind of components are necessary to achieve the objective. Hence, the first thing that I decided to investigate is the reference architecture for managing data from IoT Sensors. I need determine which reference architecture is suitable for managing the data from the IoT sensors. The transportation manager desire is to know when, and why an exception is happening. In that case, I need to know the type of exception that the system must detect. On top of that, the literature can provide me with the method to detect the exception. We should note that the detection method must be able to detect an exception, by considering the available information from the IoT sensor. I use the following limit to scope what an IoT sensor can provide: temperature, humidity, shock status, and location. The current and historical data will be available as an input.
26 the same information. Which means it is wasting processing resource if we perform the detection method over the same data set. The data that come from the sensor may not be relevant for the detection method. Moreover, there is a chance for data corruption. Hence, filters must be incorporated so that the detection method only process relevant data.
Moreover, Different IoT sensor may use a different data format from each other. Furthermore, if the detection method needs historical information, it may use a different data format as well. Therefore, the system needs an architecture to Filter, integrate and process the input data in real time.
Finally, because the user will use the system daily, it needs to have a good user interface. The user interface is especially important for the loading/unloading employee and the vehicle operator. The loading/unloading operator must input data to the system when the person is loading/unloading the items. The system must ensure that the usage of the system will not disrupt the loading/unloading process too much. Therefore, usability principles are essential.
I summarised the required information as research questions below:
1. What is the reference architecture for managing data from IoT sensors? LRQ1 2. What are the exceptions that the systems must detect? LRQ2
3. What is the architecture to detect an exception from the sensor’s events? LRQ3 4. What is the architecture to integrate multiple data source into the applications? LRQ4 5. What are the usability principles in an information system? LRQ5
I use the systematic literature review methodology to do the literature review. A systematic literature review is a means of evaluating and interpreting all available research relevant to a particular research question, topic area, or phenomenon of interest [20]. The main differences between a systematic literature review and “normal” literature review are we need to generate a review protocol before performing the review. The protocol contains the search terms, the source database as well as the including and excluding criteria. The reason is so that the reader can trace where the result is come from, so the person can validate the logic behind the chosen search terms.
4.1
SEARCH TERMS
The search terms are keywords for searching the literature database. I determine the keywords by decomposing the literature research questions. For example, in LRQ1 we want to look for literature that describes a reference architecture for managing data from IoT sensors for logistics transportation. Accordingly, the keywords should contain at minimum “reference architecture”, “IoT”, “logistics” and “transportation”. However, the results from the literature database may not be focused enough. Hence, I further refine the search terms by the searching result. If the results return keywords that is useful, I will append that to the search terms. If the results return unrelated results, I will exclude the keywords from the search terms. Table 4 contains the generated search terms.
Literature review research questions
Search terms
27 LRQ2 (“classification” OR “taxonomy”) AND “Exception” AND “Logistics” LRQ3 (“event” AND “processing”) AND (“IoT” OR “internet of things”) AND
“Exception” AND “Logistics.”
LRQ4 “Data integration” AND (“IoT” OR “Internet of Things”) LRQ5 “Usability” AND “principles” AND “Information systems.”
TABLE 4LITERATURE REVIEW SEARCH TERMS
I add (“smart” OR “intelligent”) to the search terms for LRQ1 because that keywords make the search results more relevant. Some papers may use different terms to convey the same concept. Hence, I use the operator “OR” with the variation of the terms to cover all papers. For example, (“classification” OR “Taxonomy”). Both concepts describe similar meaning.
4.2
LITERATURE DATABASES
To decide which literature databases to use, First I check which literature databases I can access. Then, I look for literature databases that contain paper relevant to the project. I do this by looking at the literature database description and whether the search terms return relevant results. The results are, I use the following academic databases to do the literature review:
• IEEE Xplore Digital Library
• ScienceDirect
• Scopus
• Google Scholar
I choose IEEE Xplore because it contains many technical papers about Internet of things, logistics and information systems. I also choose Science direct because the search result is accurate and relevant to the search terms.
Moreover, science direct also contains papers that are not in the IEEE database. I also use the Scopus database. The Scopus database gives a smaller number of papers compared to other databases. However, the results are usually more relevant. I use Google Scholar when I could not get relevant results from other literature databases. Google scholar served as a backup because the quality of the papers on google scholar is questionable. Google scholar find papers from all the internet, while in other literature databases, it only contains papers that have been approved or curated.
4.3
INCLUSION CRITERIA
I will include papers that matched the criteria. The criteria are chosen based on the research questions to make it focus. I will only include papers and standards from a maximum of seven years in the past. The inclusion criteria are selected to cope with the fast-paced technological progress in smart logistics. Listed below are the selected criteria for the paper:
• The paper is related to the architectural design of a logistics information system.
• The paper contains transportation exception taxonomy.
• The paper describes methods to process events stream from IoT devices.
• The paper describes methods to integrate data into information systems.
• The paper describes usability principles.
28
4.4
EXCLUSION CRITERIA
I choose the exclusion criteria based on the irrelevant results of the search query. I excluded papers that possess the criteria described below:
• The papers only describe general IoT implication in logistics
• The papers only describe what exception in general is.
• The papers describe the offline processing of the data stream.
• The papers describe a security system for the harbour.
• The paper objective is to explain how IoT devices work at a technical level.
4.5
LITERATURE REVIEW RESULTS
4.5.1
LRQ1:
R
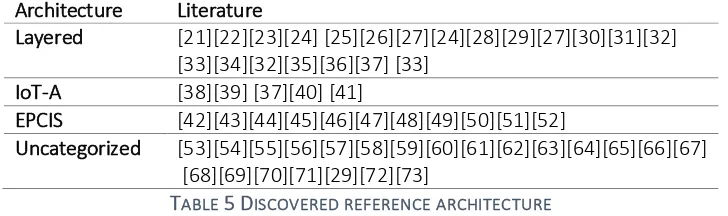
EFERENCE ARCHITECTUREI performed the search into the literature database using keywords defined in 4.1, to find existing architectures and standards currently used in logistics. I found 59 papers, describing IoT architecture in various context. However, three reference architecture described in Table 5 below are the most discussed in the literature.
Architecture Literature
Layered [21][22][23][24] [25][26][27][24][28][29][27][30][31][32] [33][34][32][35][36][37] [33]
IoT-A [38][39] [37][40] [41]
EPCIS [42][43][44][45][46][47][48][49][50][51][52]
Uncategorized [53][54][55][56][57][58][59][60][61][62][63][64][65][66][67] [68][69][70][71][29][72][73]
TABLE 5DISCOVERED REFERENCE ARCHITECTURE
Table 5 shows three approaches for reference architecture: Layered IoT architecture, IoT-A reference architecture and EPCIS. Some of the architecture in the literature database is uncategorized. The uncategorised happened because the literature talks about a specific function or the architecture only described in a few sources. Under the circumstances, I decided to focus on the three architectures: Layered, IoT-A and EPCIS.
4.5.1.1
Layered architecture
[image:29.595.117.481.343.451.2]29
FIGURE 193-LAYER ARCHITECTURE [34]
The problem with 3-layer architecture presented above is it does not provide a complete picture of a production-ready architecture. The architecture requirements require the architecture to handle security. Regrettably, 3-layer architecture does not describe how the architecture could provide trust. On the other hands, it leaves room for architecture designer to improvise. Some of the literature studied describes the way to provide security or flexibility to the architecture.
The next iteration of the layered architecture is the 5-layer architecture.
FIGURE 205-LAYER ARCHITECTURE [30]
The 5-layer architecture provides a more comprehensive components separation. The differences between the 3-layer architecture and the 5-layer architecture are the addition of business layer, processing layer, security capabilities and management capabilities. The processing layer is responsible for storing, analysing and processing the acquired data. The business layer represents the stakeholders’ goals [30]. The management capabilities layer provides scalability, and the security capabilities layer provides security for all components.
30 the financial budget of the architecture owner limits the scalability of cloud computing-based processing architecture.
[image:31.595.177.426.272.403.2]Fog computing provides a solution to alleviate the problem with cloud computing. In this approach, the data are pre-processed close to where the sensors are gathering data, or in another word, on the edge of the system. By pre-processing the data, the system could filter unnecessary data, so the final computing resources only working with useful data. This final processing could happen in the cloud. Not only it will lessen the burden on the final processing layer, but it also means less data needs to be transferred by the network layer, possibly making the system faster and reliable. The disadvantage of this process is it increases the complexity on the edge of the system. The devices located on the edge need to be powerful enough to process data from the sensors. It also must be programmed to process the data.
Figure 21 Cloud computing-based architecture [57]
FIGURE 22FOG COMPUTING-BASED ARCHITECTURE [60]
[image:31.595.195.399.459.672.2]31 enter the cloud. While in Fog computing, the fog Layer already processes the data even before entering the cloud.
From the data preparation and processing perspective, the 5-layer architecture does not specify any specific methods. Data generated from the IoT device for the smart logistics planning is real-time and potentially massive. For example, to solve the sustainability business concerns, the system must be able to handle CO2 emission sensor from the vehicle or ship. Another example, to track cold products, the system must handle the data from the temperature sensor. The volume of the data depends on how many tracked objects at one time. The velocity of the data depends on the resolution, how many data samples the user need per second.
The literature suggests using big data analytics techniques to process the data. Big data analytics defined the process of examining large data sets that contain a variety of data types to reveal hidden patterns, hidden correlations, market trends, customer preferences, and other useful business information [29]. Big data analytics defines three steps to do the process. The first step is the management of data sources. The second is the management of generated big data. The final step is the analysis of the data using analytical tools and data mining algorithms. Figure 23 contains a sample of this process in action.
FIGURE 23BIG DATA ANALYTICS IN FOG AND CLOUD ARCHITECTURE [62]
Figure 7 explains the use of fog architecture in conjunction with the cloud architecture to process data from the IoT sensors. The fog layer is used to pre-process the data by cleaning it from unnecessary noise and extract only the significant information. The data processed by the fog layer do not represent data from all the sensors. This pre-processed data needs to be integrated and analysed to get the complete picture. Cloud computing is suitable for the integration step because of its power and flexibility. The system needs the power to integrate and process data gathered from the fog layer, while must be flexible enough to handle changes to scale. In conclusion, the combination of fog and cloud architecture provide processing capabilities and scalability.
[image:32.595.249.519.358.540.2]32 approach means more time and resource is needed to design and validate an approach to solve a problem.
4.5.1.2
IoT-A
IoT-A is a complete reference architecture for Internet of Things. It is co-funded by the European Commission, industrial project partners, and universities in the EU. IoT-A is derived from the cutting-edge development of IoT architecture field in 2013 [41]. It composed from IoT reference model, IoT reference architecture and guidelines to use it. IoT-A is abstract enough to accommodate a wide range of context[41].
[image:33.595.175.419.352.579.2]The first thing that IoT-A specify is the reference model. The IoT reference model aims at establishing a common grounding and a common language for IoT architectures and IoT systems [41]. It composed of several models: domain model, information model, functional model, communication model and trust, security and privacy model. The domain model describes the concepts related to the Internet of things such as the device and the service it provides. The information model defines the relations and attributes of IoT information. The functional model groups functional interaction of the concepts. The communication model describes how each functional component communicates with each other. Figure 24 describes the relationships between the reference models
FIGURE 24RELATIONSHIP BETWEEN IOT-A REFERENCE MODEL
The second part of the IoT-A is the reference architecture. The reference architecture is composed of several architecture views: functional view, information view, and deployment view. Architecture view is a way to structure architecture description. The motivation behind separating architecture into view is to make the derivation of architecture and its validation easier by providing focused description based on its functionality [41].
33 management [41]. The unified requirements are generic, and some of the requirements align with the situation-aware logistics requirements. Table 6 below describes each requirement and mapping to situation aware logistics requirements.
IoT-A Unified Requirements Situation-aware logistics requirements Process modelling
Process execution
Data processing Service composition
Service orchestration Service choreography
-
IoT service
IoT service resolution
- Virtual entity service
Virtual entity resolution
- End to end communication
Network communication Hop to hop communication
Communication
Authorization
Key Exchange & Management Trust & Reputation
Identity Management Authentication
Security & Privacy
Configuration Fault
Reporting Member State
Data source management
TABLE 6IOT-A REQUIREMENTS, MAPPING TO THE SMART LOGISTICS PLANNING ARCHITECTURE REQUIREMENTS
34
FIGURE 25IOT-A FUNCTIONAL VIEW [41]
The functional view group each of the requirements into the function group and depict it in Figure 25 above. The purpose of this view is to describe the components. Hence, IoT-A architecture consists of 9 components: application, management, service organisation, IoT process management, virtual entity, IoT service security, communication and the device. The interaction between elements is not drawn inside the diagram to allow the existence of various context bounded implementation.
The purpose of the IoT process management is to provide integration between business function and information from the IoT devices. The service organisation function group works as the information router between services. Service organisation function group is responsible for arranging services, so it performed together to process data into the desired result. IoT-A uses the virtual entity to represents multiple sensor data as a single entity. For example, in a cold chain, items that are temperature monitored can be represented as a virtual entity, by associating the item identifier, such as a unique barcode with the temperature monitoring services. IoT service exposes a resource to the system. The communication function group provide the means of communication between devices on the different network to the system and connecting one architecture components to the other. It is responsible for ensuring a reliable end to end communication of the system.
The security function group is responsible for managing the access right of the user, system components, and devices. The function group needs to manage identity and perform authentication. IoT-A also requires the architecture to record user reputation for building trust score. The management function group is responsible for managing configuration, do fault handling and reporting.
35 Even though it seems complete, IoT-A does not explicitly mention where and how the data are stored and managed. We may store the data in a service. The downside is, the service becomes a single point of failure. For example, when the storage service is flooded with too much sensor data and fail, another system that depends on the storage service will also stop working. Another approach is to decentralise it. The system stores the data inside an IoT sensor service. That way, when one sensor service fails, only data from that sensor service is unavailable. The approach is a trade between complexity and availability. IoT-A should describe the best practice to do this, but it did not.
IoT-A also does not describe the need for standardisation. Standardization is essential for collaboration. So, IoT-A reference architecture is not useful for doing a collaboration, which is a concern for smart logistics planning stakeholders. It does not describe how to share the information gathered with the external party securely.
The European Union funds the IoT-A, so in theory, the world should widely use the system. However, the literature that describes a successful implementation based on IoT-A is fewer than expected. The specification includes links to web resource which contains IoT-A explanation. Unfortunately, the links are not working. The condition raised a question, whether the developer still maintains the reference architecture or abandoned. A quick search on the internet suggests the abandonment of IoT-A. The literature does not provide insight into why this happened. I think this is because of IoT-A complexity. The conclusion is, IoT-A provide a comprehensive reference architecture for smart logistics planning, and it includes the guideline on how to implement it. It also specifies additional architecture requirements relevant to smart logistics planning architecture. However, IoT-A is also missing some essential information. It is not clear where to store data, how the architecture store data, the means of sharing information between different systems and little literature mention successful implementation found. Furthermore, I believe the architecture is abandoned.
4.5.1.3
EPC Information System (EPCIS)
EPC Information system or EPCIS is an architecture designed by GS1. GS1 is the official organisation responsible for barcode, which is ubiquitous in all products. EPCIS specifically engineered for traceability. Traceability is the ability to follow back the route a product takes, from the finished product at the hand of the end customer to the production of the raw material. Traceability capabilities can be used for example to track where food is contaminated when food poisoning is happening. Traceability is also essential to optimise logistics route. Traceability needs collaboration between partners inside the supply chain. It also needs a system that could track the position of an item in real time. EPCIS provide the architecture to do it.
36 EPCIS is general purpose. EPCIS can store any types of data because the data model is extensible. So, EPCIS can be extended to store any data from an IoT device. Because the event type is general purpose, GS1 provides a companion standard called the core business library. The core business library covers the definitions of data that can be used to populate the EPCIS data model. The diagram below depicts the generic type of data that EPCIS handle.
FIGURE 26EPCIS GENERIC DATA TYPE [52]
To capture, identify and to enable sharing, EPCIS define an architecture based on the following principles: Layered, Extensible and Modular [52]. Layered means the separate architecture structure and the meaning of data from the real implementation. The arrangement is made to make reusability of the data structure and meaning in different architecture possible. Extensible means the core data types can be extended to include the needs from the application context. Other specification documents can replace modular, the components of the architecture. Figure 27 below depicts the components divided by layers.
FIGURE 27EPCIS ARCHITECTURE LAYERS [52]
![FIGURE 22 FOG COMPUTING-BASED ARCHITECTURE [60]](https://thumb-us.123doks.com/thumbv2/123dok_us/9670419.468875/31.595.195.399.459.672/figure-fog-computing-based-architecture.webp)
![FIGURE 23 BIG DATA ANALYTICS IN FOG AND CLOUD ARCHITECTURE [62]](https://thumb-us.123doks.com/thumbv2/123dok_us/9670419.468875/32.595.249.519.358.540/figure-big-data-analytics-fog-and-cloud-architecture.webp)

![FIGURE 28 EPCIS ARCHITECTURE [52]](https://thumb-us.123doks.com/thumbv2/123dok_us/9670419.468875/38.595.195.404.164.407/figure-epcis-architecture.webp)