University of Warwick institutional repository:http://go.warwick.ac.uk/wrap
A Thesis Submitted for the Degree of PhD at the University of Warwick
http://go.warwick.ac.uk/wrap/68249
This thesis is made available online and is protected by original copyright. Please scroll down to view the document itself.
Methodology for
Facility Layout Design
by
Luis Felipe Romero Dessens
Submitted for the Degree of Doctor of Philosophy
University of Warwick
\
Department
'
of
Engineering
Strong Component-Based Methodology for Facility Layout Design Table of Contents
Table of Contents
TABLE OF CONTENTS ...
1LIST OF ILLUSTRATIONS ...
IV
LIST OF TABLES ...
VI
ACKNOWLEDGEMENTS ...
VIIIDECLARATION ...
IX
SUMMARY ...
x
1. INTRODUCTION ... ' ...
11.1. BACKGROUND ... 1
1.2. FACILITIESLAYOUTDESIGN ... 3
1.3. RESEARCH PROJECT ISSUES ... 5
1.3.1 Objective ... 7
1.3.2 Approach ... 8
1.3.3 Chapter Plan ... 10
2. FACILITY LAYOUT DESIGN (LITERATURE REVIEW} ...
132.1. INTRODUCTION ... ~ ... 13
2.2. SYSTEMATIC LA YOUT PLANNING (SLP) ... 14
2.3. LAYOUT ANAL YSIS AND PRESENT A TlON SUPPORT TOOLS ... 18
2.4. ACTIVITY RELATIONSHIPS ... 19
2.5. EFFICIENT LAYOUT INTERRELA TIONSHIP REPRESENT A TlON ... 21
2.6. DEDICATED OR NON-DEDICATED FACILITIES STRATEGIES ... 25
2. 7. SUMMARy ... 26
3. FACILITY LAYOUT DESIGN SOLUTION APPROACHES
(LITERATURE REVIEW) ...
283.1. INTRODUCTION ... 28
3.2. THE LIMITATIONS OF FACILITY LAYOUT DESIGN MODELLING ... 29
3.3. QUADRA TIC ASSIGNMENT PROBLEM (QAP) ... 32
3.3.1. QAP Modelling Variations ... 36
3.3.2. Mixed Integer Programming (MIP) ... : ... 37
3.3.3. Multiple Objective Programming (MOP) ... 39
3.3.4. Dynamic Programming (DP) ... 40
3.3.5. Other Formulations ... 41
3.4. QAP SOLUTION ApPROACHES ... 42
3.4.1. Optimal Algorithms ... 43
3.4.1.1. Branch and Bound Method ... 43
3.4.2. Heuristic Approaches ... 46
3.4.2.1. Construction Methods ... 4 7 3.4.2.2. Improvement Methods ... 47
3.4.2.3. Hybrid Methods ... 48
3.5. GRAPH THEORETIC FORMULA TlONS ... 51
3.6. GRAPH THEORETIC SOLUTION ApPROACHES ... ... 53
3.6.1. Maximally Planar Weighted Graphs Method (MPWG) ... 53
3.6.2. Deltahedron Method ... 57
3.6.3. Wheel Expansion Method ... 59
3.6.4. Modified Spanning Tree Method (MST) ... 60
3.6.5. Greedy Method ... 62
3. 7. SUMMARy ••••••••.•••••••.•••..•••••••••••••••••••••••••... 63
4. MACHINE LAYOUT-MODELLING AND SOLUTION
APPROACHES (LITERATURE REVIEW) ...
664.1. INTRODUCTION ... 66
4.2. CELLULAR MANUFACTURING SySTEMS ... 67
4.2.1. Methods Addressing Individual Issues ... 69
4.2.2. Partial Methods ... 70
4.2.3. Complete Methods ... 71
4.2.3.1. Simulation ... 71
4.2.3.2. Virtual Manufacturing ...•...•...•...•.•....•..••...•...•...•.•...•.... 72
4.2.3.3. Simulated Annealing .... : ... 73
4.2.3.4. Heuristic ... 74
4.2.3.5. Graph Theoretical ... 75
4.3. FLEXIBLE MANUFACTURING SYSTEMS ... 75
4.3.1. Loop Layout Design ... 78
4.3.2. Linear. Circular and Multiple Row Layout Designs ... 79
4.3.3. Flexible Manufacturing Systems Design Issues ... 83
4.4. MACHINE LAYOUT DESIGN ... 85
4.4.1. Types of Machine Layouts ... 87
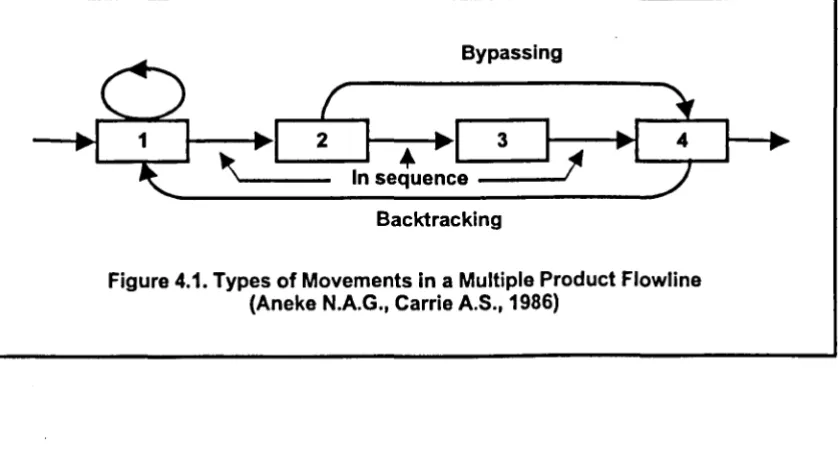
4.4.2. Types of Machine Layout Movements ... ; ... 88
4.4.3. Linear and Circular_Row Designs ... 90
4.4.4. Multiple Rowand Network-Based Designs ... 91
4.4.5. Modular Designs ... 95
4.4.6. Other Machine Layout Design Issues ... 96
4.5. SUMMARy ... 97
5. STRONG COMPONENT-BASED LAYOUT DESIGN
APPROACH ...
1015.1. INTRODUCTION ... 101
5.2. DEDICATED FACILITIES ... 103
5.3. NON-DEDICATED FACILITIES ... 104
5.4. ApPROACH OVERVIEW ... 109
5.5. DIRECTED GRAPHS AND STRONG COMPONENTS ... 110
5.6. LA YOUT DESIGN METHOD .... ... 110
5.6.1. Layout Design Method ... 112
5.6.1.1. Determine the Adjacency Matrix ... 116
5.6.1.2. Calculate the Reachability Matrix ... 118
5.6.1.3. Determine the Strong Component Matrix ... 121
5.6.1.4. Construct Strong Component Graph ... 122
5.6.1.5. Planar Graph Equivalence ... 129
5.7. SOLUTION ApPROACH EXTENSIONS ... 130
5.7.1. Volume Weights ... 131
5.7.2. Input-Output Ports ... 133
5.7.3. Consideration of Non-Adjacent Flows ... 136
5.8. NON STRONG COMPONENT PROBLEM ... 139
6. DISCUSSION ON STRONG COMPONENT-BASED FACILITY
LAYOUT DESIGN METHODOLOGY ...
1486.1. INTRODUCTION ... 148
6.2. GENERAL MODELLING ISSUES ... 149
6.3. COMPARISON WITH QAP ... 151
6.4. COMPARISON TO GRAPH THEORY METHODS .. ... 152
6.5. COMPARISON WITH LITERA TURE ExAMPLES USED IN THIS THESIS ... 154
6.5.1. Example 1, More Machines than Products ... 156
6.5.2. Example 2, More Products than Machines ... 159
6.5.3. Example 3, A Large Number of Machines ... 163
7. CONCLUSiONS ...
1687.1. RESEARCH CONTRIBUTIONS ... 169
7.2. FURTHER WORK ... 172
LIST OF
REFERENCES ...
174
BIBLIOGRAPHY ...
190
LIST OF
ABBREViATIONS ...
192APPEN DIX 1 ...
194ApPLE'S PLANT LA YOUT PROCEDURE ... 194
APPENDIX 2 ...
196REED'S PLANT LA YOUT PROCEDURE .... ... 196
APPENDIX 3 ...
197
A3.1. EXAMPLE 1. MORE MACHINES THAN PRODUCTS ... 197
A3.2. ExAMPLE 2. MORE PRODUCTS THAN MACHINES ... 206
A3.3. ExAMPLE 3. A LARGE NUMBER OF MACHINES ... 212
APPENDIX 4 ...
220APPENDIX 5 ...
223A5.1. ExAMPLE 1, MORE MACHINES THAN PRODUCTS ... 223
A5.2. EXAMPLE 2, MORE PRODUCTS THAN MACHINES ... 225
List of Illustrations
Figure 2. 1. Systematic Layout Procedure ... 14
Figure 3. 1. Quadratic Assignment Problem (QAP) Formulation Model ... 34
Figure 3. 2. Graph Theoretic Formulation Model. ... 52
Figure 3. 3. Relationship Chart and Graph ... 54
Figure 3. 4. Deltahedron Graph ... 58
Figure 3. 5. The Wheel Expansion Graph ...
60
Figure 3. 6. Modified Spanning Tree Graph ...
61
Figure 4. 1. Types of Movements in a Multiple Product Flowline ... 89
Figure 4. 2. Maximal Planar Spinal Graph ... 95
Figure 4. 3. Modular Layout Design Sample ...
96
Figure 5.
1.
Adjacency Graph ...106
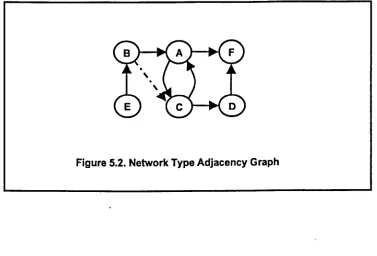
Figure 5. 2. Network Type Adjacency Graph ... 108
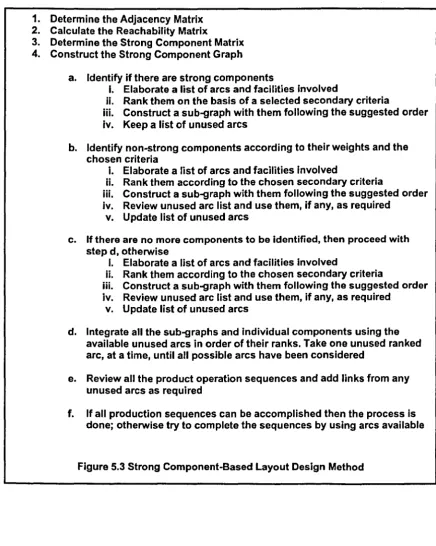
Figure 5. 3. Strong Component-Based Layout Design Method ... 113
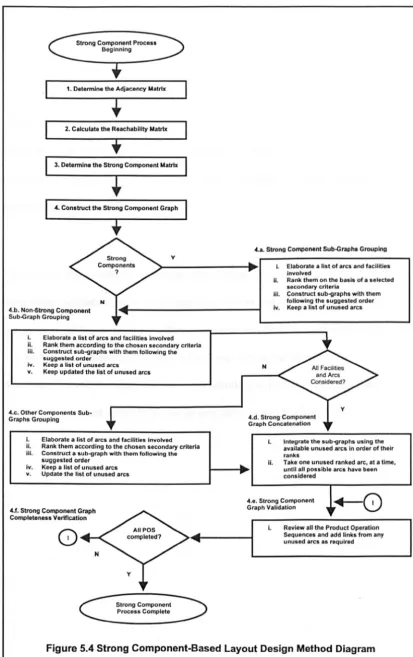
Figure 5. 4. Strong Component-Based Layout Design Method Diagram ... 115
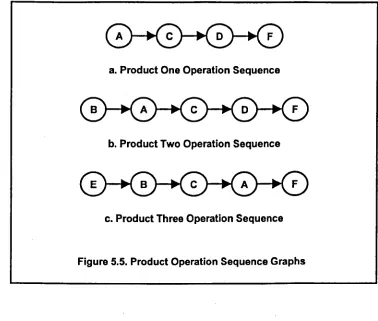
Figure 5. 5. Product Operation Sequence Graphs ... 117
Figure 5. 6. Strong Component Sub-Graph ... 124
Figure 5. 7. Non-Strong Component Sub-Graphs ... 124
Figure 5. 8. Strong Component Partial Sub-Graph ... 125
Figure 5. 9. Strong Component Graph ...
126
Figure 5. 10. Non-Dedicated Facilities without Bypassing Flows Graph ... 128
Figure 5.11. Non-Dedicated In-Sequence Flows Graph ...
129
Figure 5. 12. Planar Graph Equivalence ... 130
Figure 5. 13. Graph containing Input Output Relationships ... 135
Figure 5. 14. Non-Adjacent Planar Weighted Sub-Graph ... 138
Figure 5. 15. Low and High Frequency Non-Strong Component Sub-Graphs ... 143
Figure 5.
16.
Pre-linked Non-Strong Component Sub-Graph ... 144Figure 5. 17. Non-Strong Component Graph ... 145
Figure 6. 1. Example 1, Strong Component Layout Design ... 158
Figure 6. 2. Example 2, Strong Component Layout Design ...
161
Strong Component-Based Methodology for Facility Layout Design List of illustrations
Figure A3. 1. Example 1, Strong Component Sub-Graphs ... 203
Figure A3. 2. Example 1, Non-Strong Component Sub-Graphs ... 204
Figure A3. 3. Example 1, Sub-Graphs Interconnection Sample ... 204
Figure A3. 4. Example 1, Strong Component Graph ... 206
Figure A3. 5. Example 2, Strong and Non-Strong Component Sub-Graphs and their Interrelationships ... 211
Figure A3. 6. Example 2, Strong Component Graph ... 212
Figure A3. 7. Example 3, Strong Component Sub-Graph ... 216
Figure A3. 8. Example 3, Non-Strong Component Sub-Graphs ... 217
Figure A3. 9. Example 3, Strong and Non-Strong Component Sub-Graphs Integration ... : ... 217
Figure A3. 10. Example 3, Possible Layout Design ... 219
Figure A3. 11. Example 3, Another Possible Layout Design ... 219
Figure A4. 1. Partial Matrix
R1 ...
221Figure A4. 2. Partial Matrix
R2 ...
221Figure A4. 3. Partial Matrix
R3 ...
222List of Tables
Table 3. 1. Facility Layout Design Approach Computer Implementation ... 50
Table 5. 1. Product Data ... 103
Table 5. 2. Volume From-to Table ... 105
Table 5.3. Adjacency and Frequency of Displacements Tables or Matrices105 Table 5. 4. Adjacency Matrix ... , ... 117
Table 5. 5. Reachability Matrix ... 121
Table 5. 6. Reachability Transpose and Strong Component Tables or Matrices ... 122
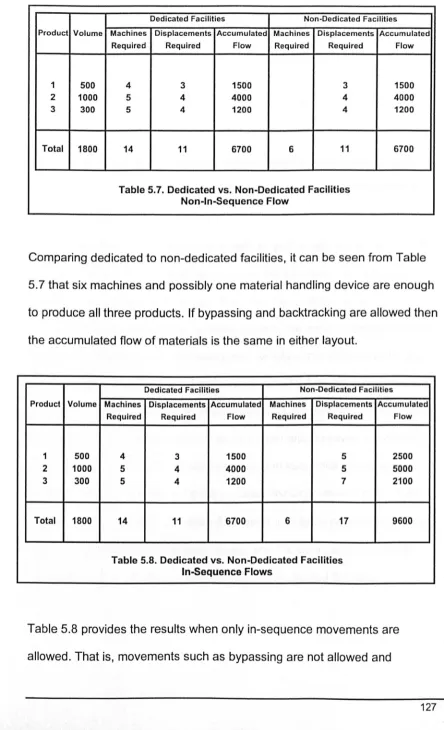
Table 5.7. Dedicated VS. Non-Dedicated Facilities: Non-In-Sequence Flow127 Table 5. 8. Dedicated VS. Non-Dedicated Facilities: In-Sequence Flows ... 127
Table 5.9. Directed Graph and Graph Equivalencies ... 129
Table 5. 10. Volume-Strong Component Arc Rankings ... 132
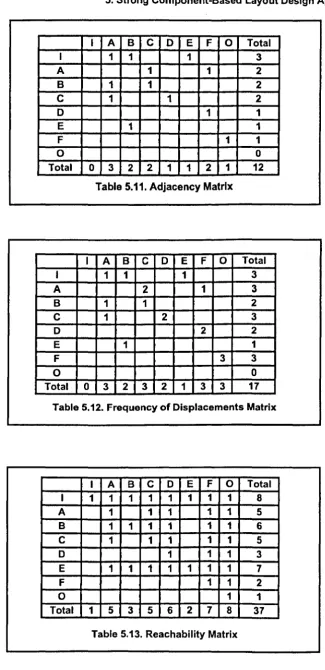
Table 5. 11. Adjacency Matrix ... 134
Table 5. 12. Frequency of Displacements Matrix ... 134
Table 5. 13. Reachability Matrix ... 134
Table 5. 14. Strong Component Matrix ... 135
Table 5. 15. Non-Adjacent Volume Weighted From-To Matrix ... 137
Table 5. 16. Volume and Product Operation Sequence Data ... 139
Table 5. 17. Adjacency Matrix ... 140 ,
Table 5. 18. Strong Component Matrix ... 141
Table 5.19. Frequency of Displacements Matrix ... 141
Table 6. 1. More Machines than Products Example Data Table ... 157
Table 6. 2. More Machines than Products Example Comparison Table ... 159
Table 6.3. More Products than Machines Example Data Table ... 160
Table 6. 4. More Products than Machines Example Comparison Table ... 162
Table 6. 5. A Large Number of Machines Example Data Table ... 163
Table 6. 6. A Large Number of Machines Example Comparison Table ... 165
Strong Component-Based Methodology for Facility Layout Design List of Tables
Table A3. 1. Example 1, More Machines than Products ... 198
Table A3. 2. Example 1, Adjacency Matrix ... 199
Table A3. 3. Example 1, Number of Displacements Matrix ... 200
Table A3. 4. Example 1, Volume From-To Matrix ... 201
Table A3. 5. Example 1, Reachability Matrix ... 202
Table A3. 6. Example 1, Strong Component Matrix ... 202
Table A3. 7. Example 2, More Products than Machines ... 207
Table A3. 8. Example 2, Adjacency Matrix ... 208
Table A3. 9. Example 2, Number of Displacements Matrix ... 209
Table A3. 10. Example 2, Reachability Matrix ... 209
Table A3. 11. Example 2, Strong Component Matrix ... 210
Table A3. 12, Example 3, A Large Number of Machines ... 213
Table A3. 13. Example 3, Number of Displacements Matrix ... 214
Table A3. 14. Example 3, Strong Component Matrix ... 215
Table A5. 1. Example 1, Example Operation Sequences ... 223
Table A5. 2. Example 1, Strong Component Operations Sequences ... 224
Table A5. 3. Example 2, Example Operation Sequences ... 225
Table A5. 4. Example 2, Strong Component Operation Sequences ... 226
Table A5. 5. Example 3, Example Operation Sequences ... 227
Acknowledgements
To Fernando and Luz in their memory ...
To my wife Silvia Irma, for your loving support and caring, and to my
wonderful children, Luis Felipe and Diana Lucia. Thank you for standing by me during the times of building up and while writing this Dissertation. Your support and prayers has been my strength and willingness to stay in course. Also, to Sandra, Luz Amelia, Josefina, Salvador, Rosario, Alma, Diana and all my brothers and sisters.
I am also deeply grateful to Rajat Roy for his supervision, patience and guidance throughout this research work. In addition, to acknowledge
PROMEP from the Mexican Government and the Universidad de Sonora by their support and by making the accomplishment of this project, become possible.
Furthermore, want to thank 8eth and Nigel for their invaluable support, sustained work and patience.
Moreover, I wish to thank the members of the Simulation TearT) within the WMG at the University of Warwick for their support and make of my stay at the University a very pleasant place to work in.
I am also very grateful to my friends for their company and all those moments that also made of this time to be a rewarding and a memorable experience.
Strong Component-Based Methodology for Facility Layout Design Declaration
Declaration
I declare that the work described within this Ph.D. thesis, unless otherwise acknowledge in the text, is my own work and has not been previously submitted for any academic degree.
Signed:
L~~Dessens
Summary
Among many issues involved within the field of manufacturing systems, the design of facilities layout is an ongoing and interesting research field, where new solutions and approaches are sought to determine the appropriate location and physical organisation of the resources in manufacturing
systems. Issues such as space, material handling, machine placement and orientation, utilities location, and environmental factors are important
features that may be considered when establishing the requirements of a facility layout design. The facility layout design can be thought of in terms of interconnecting workcentres that can be represented by a set of interrelated vertices in a graph. Directed graphs can be used to characterise each product operation sequence, which combined into a single directed graph, be used to represent appropriately a layout design. Doing this together with the material handling system requirements, will allow better facilities
planning and may improve process sequences that should be reflected in better designs.
The Strong Component Based Methodology proposed here, obtains a graphical structure from the integration of various products and using their operation sequences to produce a relationship diagram. The attributes of the resultant structure are used to create this diagram. The objective is to obtain layouts that minimise material handling, that is, as close as possible to that which can be obtained with dedicated facilities for each product family but without the capital costs involved in the case of the latter. Encouraging results have been obtained by considering strong components, a feature of directed graphs, because less computational resources than in the case of many previous methods, which use Quadratic Assignment Problem
approaches, are required to formulate and produce a relationship diagram. Moreover, this approach produces faster designs than other graph theoretic approaches because it avoids using planar and dual graphs. These
characteristics allow the Strong Components approach to address more complex situations and obtain comparable or better solutions than previous approaches.
Strong Component-Based Methodology for Facility Layout Design
, 1.
Introduction1. Introduction
1. 1.
Background
Contemporary industrial markets are dynamic and complex environments,
which make the innovation of manufacturing systems fundamental for
organisations to remain competitive. Manufacturing system design is still an
evolving research field. Researchers and practitioners are seeking new and
better alternatives to support the design of systems that satisfy changing
customer requirements in an efficient manner (Manetti
J.,
2001; Meller RD.,Gau K.V., 1996).
Among many issues involved within the field of manufacturing system
design, the design of facilities layout is an ongoing and interesting research
field (Ramabhatta V., Nagi
R,
1998; WelgamaP.S.,
GibsonP.R,
1995). Inthe design of facilities layout, new solutions and approaches are sought to
determine the appropriate physical organisation of the resources within
manufacturing systems. Facilities design is closely associated with the
performance of the production and the material handling systems (Owens
R.,
2001). It has been estimated that a good layout design may help reduce from 10 to 30% of the total operating expenses within manufacturingBeing competitive implies that organisations have to satisfy very demanding
and sophisticated customers using scarce resources (Corney W., 2002;
Schroeder D.M., Congden S.W., 2000). Products offered should fulfil and
exceed the expectations of customers in terms of their variety, quality, and
price. As customers' expectations change new products have to be offered
and new technologies are needed to open opportunities for product and
process improvements. For the manufacturing organisation, satisfying this
has its challenges and consequences. Offering a greater variety of products
may imply that production volumes should be smaller, that time-to-market
should be compressed, and hence, the life cycle of the product reduced.
These reductions may necessitate a thorough evaluation of a possible
design or redesign of new or existing facilities and, of course, of the technical
and/or economic consequences that these changes may bring. Industries in
fields such as electronics or high-tech may be examples of this type of
environment (Arntzen B.C., Shumway H.M., 2002; Frazier G.V., Reyes P.M.,
2000).
Amongst the main drivers that are guiding organisations, (Wu B., 2000:4;
Wacker J.G., Miller M., 2000; Joseph A.T., 1999), one is the need to meet
higher customer expectations on choice of products, quality, delivery
performance, and costs. These drivers can be translated into the following
criteria:
• Quality considered as the ability to produce products according to
Strong Component-Based Methodology for Facility Layout Design
1.
Introduction• Customer lead times as the ability to complete the required products at
the required times.
• Delivery reliability as the ability to provide the agreed quantities of
products at the agreed time.
• Volume flexibility as the ability to produce products in various batch sizes.
• Design flexibility as the ability to produce a range of products, to
customise products or produce new products to specifications.
• Price and costs as the ability to produce products at a low cost based on
perceptions of value for money.
Companies will have to carefully reorganise their available resources, set
priorities and targets, and keep monitoring their performance to meet these
goals (Sahin F., 2000). Additionally, the above may imply that new
processes may be required and support for these innovations may be
needed. Every time that new products, processes, and technologies are
considered, a new facilities layout design might be required and also an
evaluation of how these changes contribute in the efforts to become
sustainable and more effective, flexible and agile than the competition
(Belshaw B., Citrin S., Stewart D., 2001).
1.2. Facilities Layout Design
The Layout Design process of Manufacturing Systems or Facilities Layout
Design deals with how to deploy the manufacturing resources within a
performed appropriately and the materials to flow effortlessly (Chiang W.C.,
2001;
CaccettaL.
Kusumah Y.S.,1999).
Layout Design may be requiredwhen designing new facilities or processes, or when redesigning existing
ones. A layout is considered good if it promotes effective use of space,
equipment, materials, personnel, and other manufacturing resources (Foulds
L.R., Partovi F.Y.,
1998;
Meyers F.E.,1993:2).
Likewise, Layout Design is considered to be closely related to other
manufacturing design processes. These processes, such as product design,
process design and material-handling design, should be addressed
simultaneously as far as possible. During their interaction and iterative
feedback they should influence, enhance and contribute to each other,
allowing the development of more appropriate and more effective designs
(Yaman R., 8alibek E.,
1999).
For practical and analytical purposes, layoutdesign is often analysed in isolation, reducing considerably its complexity: in
practice its interaction and iteration with these other processes should not be
abandoned (Heragu 5.5.,
1992).
In general, the design of manufacturing facilities is an ongoing research topic
that can be studied from a strategic or tactical perspective. A few years ago,
when markets were more stable, the design of facilities was seen as a
strategic issue, since the layout remained fixed over long periods because
new products and new technologies took more time to be introduced and
developed (Kochhar J.S., Heragu 5.5.,
1999).
In current industrialStrong Component-Based Methodology for Facility Layout Design 1. Introduction
features are required by companies to respond to customers' demands, and
a more tactical perspective on manufacturing issues is required (Sanchez
L.M., Nagi R., 2001). Hence, models and methods are required which are capable of responding to changes in product mix and routing without the
need for frequent modification of an existing layout.
1.3. Research Project Issues
The generation of layout design alternatives is critical within the facilities
planning process because the layout establishes behavioural and physical
relationship patterns between resources allocated for production. The
complexity of the layout design together with the material handling system
design suggests that a sequential design process should be used. It is
recommended, when considering together these designs, that a number of
alternatives should be developed and then that the design considered most
suited should be selected from them. Issues such as the material handling
unit, the degree of automation, and the degree of control over
work-in-process, may affect requirements for space, equipment, personnel, and the
proximity requirement between production activities (Tompkins J.A., et aI.,
1996:287).
The way products are designed determines the processes that may be
available to produce them (Arnold T.J.T., 1998:365). The effect of a poor
product design can influence production and inventory costs through
required work in process because of excessive working time during
complicated operations. Effective flow between workcentres addresses the
progressive flow of materials and information between them, and contributes
to an effective flow between organisational units, and ultimately also
contributes to an effective flow between organisations. In consequence, the
deployment of a relationship diagram, which represents and considers these
flows, is an essential step in the development of any Facility Layout Design.
To determine the material flow pattern is the first step in developing layouts
(Heragu S.S., 1997:48; Tompkins J.A., et aI., 1996:288), and consequently it
is necessary to determine which workcentres should be adjacent in the
layout (Leung J., 1992b). Based on the material flow and depending on the
product design, volume and equipment available, production processes can
be classified as product, process, fixed position, group technology, or hybrid,
which are all known as the basic layout types. The product layout can be
characterised as a high-volume and low-variety production environment,
whereas the process layout is a low-volume and high-variety environment.
More companies are converting their facilities to combinations of product and
process families based on similar manufacturing operations or design
characteristics. This approach is known as group technology, and their
physical implementation as group layout or cellular manufacturing, since the
required machines are said to be grouped together in manufacturing cells
which are characterised by their medium-volume medium-variety
Strong Component-Based Methodology for Facility Layout Design
1.
IntroductionThe shift from high-volume production towards multiple products with small
to medium volume orientation and frequent product design changes
suggests that organisations are moving from dedicated to non-dedicated
facilities (Leung
J.,
1992b). This work describes an approach to obtainfacility layout designs in this environment, exploring the resultant production
network structure obtained, and comparing its performance against the
performance obtained from dedicated facilities. An approach originated by
the integration of production sequences is suggested by this project to
develop layout designs.
1.3.1 Objective
The objective that this project will address is:
To develop relationship diagrams using a construction-type approach in
order to study layout designs within environments where multiple products
have to share the same facilities based on their production operation
sequence similarities during their expected life cycles. This approach is
based on a model obtained by the combination of different product operation
sequences. To accomplish this purpose the following issues are addressed:
• The design and development of the necessary links between the facility
layout design problem and the theory of directed graphs that can be
applied successfully to aid the development of relationship diagrams
• The validation of the solution model against a dedicated facilities solution
model, based on a set of specific performance measures such as
utilisation of resources, production output, and batch production, among
other possible measures.
1.3.2 Approach
The computational requirement in the facility-layout-design problem to create
a relationship diagram is complex; for instance assuming that there are n
workcentres to be distributed, there will be n! possible solutions.
Consequently, researchers have concentrated on developing heuristic
methods, which may not guarantee optimality but provide acceptable
solutions (Heragu S.S., Kusiak A., 1988). These heuristics were classified by
Kusiak and Heragu (Kusiak A., Heragu S.S., 1987) as construction,
improvement, hybrid, and graph theoretic methods. In construction methods,
facilities are added, usually one at a time, until a complete layout is
achieved. There is an initial solution in improvement methods, from which a
systematic exchange between facilities is performed, seeking best solutions
until the solution cannot be improved: then the procedure is ended. Hybrid
methods are characterised by the use they make of the features from
improvement and construction methods.
The facility layout design can be thought of in terms of interconnecting
Strong Component-Based Methodology for Facility Layout Design
1.
Introductioninterrelationships between the workcentres, in terms of operation sequences,
can be represented by the edges or arcs. These relationships are usually
represented by charts or tables such as the relationship chart (Muther R.,
1973:5-2), from-to frequency of trips, and frequency of trips between facilities
(Heragu S.S., 1997:55). A relationship chart or rei-chart is a qualitative data
table that summarises estimates of the desirability of locating facilities next
to each other. Designers using rei-charts attempt to maximise the sum of the
scores of adjacent pairs of facilities in the layout. The from-to and the
trip-frequency tables are quantitative measures of flow, which indicate the level
of interaction between pairs of facilities. Thus, the from-to table shows the
number of trips made in each direction between every pair of facilities, and
the trip-frequency table combines the two directions and shows the total
number of trips in either direction between pairs of facilities. In the case of
these tables or matrices it is desirable that those edges or arcs with a higher
number of in-between trips are placed as close as possible. Directed graphs
could be used to represent each product sequence, which combined can be
represented by adjacency matrices.
Flow, space, and activity relationships are important considerations when
establishing the requirements of a facility. Issues such as space, material
handling systems, proper machine orientation, utilities location, and
environmental factors are features which can be considered in the detailed
design phase, once a proper machine sequence has been settled. Doing this
later, together with the material handling system requirements, may allow
reflected in better design (Rao H.A., Gu P., 1997). In addition, it can also be
supported by more suitable tools such as a CAD tool (Owens R.,
2001).
In summary, once each product to be considered is defined and its
production process known, each one of them can be represented by
sequences of steps which can be characterised through the use of a
directed graph. Each product graph then can be combined with the other
product graphs to construct a structure based on their production sequence
similarities. The properties of the resultant structures can then be used to
obtain the relationship diagram and produce a facility layout. These
structures represent the integration of the production operation sequences in
one model that can be pictorially represented by a directed graph.
Since this is a deterministic structure, it can be handled using deterministic
approaches such as directed graph theory and matrix algebra. The
application of directed graphs and particularly strong components and its
appropriateness to the Facility Layout Design is the main issue explored in
this Thesis.
1.3.3
Chapter PlanIn the following paragraphs, the contents of the thesis are briefly outlined.
In Chapter Two, the literature on facility-layout-design problems is reviewed
Strong Component-Based Methodology for Facility Layout Design
1. Introduction
relevant issues of the facility-layout-design process are explored and
discussed, along with some of their general formulation approaches.
In Chapter Three, analytical methods and techniques used to obtain
solutions to facilities layout design models are explored, compared, and their
underlying assumptions identified.
Chapter Four explores cellular, flexible and machine layouts, their main
characteristics are highlighted, and their respective formulations and
solutions approaches are addressed.
In Chapter Five, the solution approach developed in this research project is
outlined, providing a simple case example to show the details of how this
method works. Additional features are mentioned which enhance the
proposed method and may provide useful insights when designing or
redesigning manufacturing facilities. Moreover, the strengths and limitations
of the proposed approach are stressed, and its advantages and
disadvantages compared to when used to produce the same set of products
in dedicated facilities environments are discussed.
In Chapter Six, the findings are discussed and compared to other models
and approaches found in the literature, which provide insight into the
In the final chapter, the research contributions are summarised, and
Strong Component-Based Methodology for Facility Layout Design 2. Facility layout Design (Literature Review)
2. Facility Layout Design (Literature Review)
2.1. Introduction
How facilities have to be configured to best support manufacturing systems
is a fundamental question to be addressed and solved. Many factors have to
be considered, including the nature of the process, product life cycles,
product varieties, space usage, costs and product market demand, among
other factors. Publications on the Facility Layout Design approaches by
Apple (Apple J.M., 1977), Muther (Muther
R.,
1973), and Reed (ReedR.,
1961) can be considered among the seminal works that addressed this
question and provided a general approach to solve it. Many of today's
methods are still using the concepts contained in these initial proposals
(Tompkins J.A., et aI., 1996:291), and are explored in this chapter. The rest
of this chapter briefly introduces Systematic Layout Planning (Muther R.,
1973), and the approaches by Apple and Reed are presented in Appendices
One and Two. This is followed by an outline of activity relationships, and a
discussion of how efficiency has been measured in the different approaches.
2.2. Systematic Layout Planning (SLP)
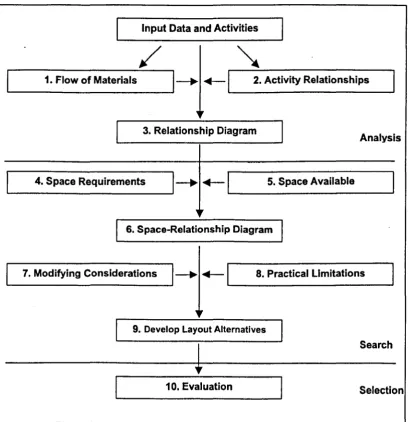
Muther's approach, Systematic Layout Planning (SLP), is based on the
methods proposed by Apple and Reed, and it has been one of the most
common approaches in practice (Heragu S., 1997:86).
I
Input Data and ActivitiesI
/
~
I
1. Flow of MaterialsI~
~I
2. Activity RelationshipsI
"
I
3. Relationship DiagramI
Analysis
I
4. Space RequirementsI~
~I
5. Space AvailableI
"
I
6. Space-Relationship DiagramI
I
7. Modifying ConsiderationsI~
~I
8. Practical LimitationsI
"
I
9. Develop Layout AlternativesI
~
Search [image:26.505.33.441.198.619.2]I
10. EvaluationI
SelectionFigure 2.1. Systematic Layout Procedure (Tompkins, 1996: 295)
Strong Component-Based Methodology for Facility Layout Design 2. Facility layout Design (Literature Review)
1. Determining the location of the area where facilities will be laid out. It is
this phase in which the available space for the layout is identified.
2. Establishing the general overall layout. This second phase involves the
framework which underpins the procedure, as shown in Figure 2.1. This
phase is also referred to as "block layout".
3. Establishing detailed layout plans. Once a relative gross position is
defined in the previous step then the location of specific components is
created. The detailed layout procedure follows the same procedure used
in phase two and it is repeated as necessary until all the detailed layouts
have been generated.
4. Finishing the selected layout. Once all detailed layouts are approved then
the information provided is used in development of drawings, and the
final layout is prepared.
The approach begins by establishing the required input data, which are
classified into five categories:
P Product: types of products to be produced
Q Quantity: volume of each part type
R Routing: Operation sequence for each part type
5 Services: support services, locker rooms, inspection stations,
and other services
T Timing: process times which will determine the resource
information by creating different charts, which eases the design process. It
constructs a from-to material flow chart from data P, Q and R; in Figure 2.1
this is shown as box one. This matrix indicates the intensity of the flow
between each pair of workcentres. A second chart, the activity relationship
chart, is constructed in the second step (box two in the same figure), which
allows us to establish the relative importance between the workcentres as a
qualitative measure that reflects the desired proximity between workcentres,
using a lexigraphic ordinal scale. This scale reflects the closeness
desirability between the different activities and is expressed using six values,
namely A, E, I, 0, U, and X. This range of values declares the A value as
the closest or most desirable closeness value and, consequently, any pair of
facilities should be placed together as close as possible. As the relationship
importance decreases, the letter changes to reflect the relationship
importance until, using X as the most undesirable closeness value, any pair
of facilities with this rating must not be near to each other.
From the two charts, from-to and activity relationship charts, a relationship
diagram is constructed, as in box three. This relationships diagram depicts
the workcentres and their relative positions, locations that can be determined
using algorithms or heuristics. In the following step, the method focuses on
space handling, and any limitations or other related particular issues are
considered. This step corresponds to boxes four and five in Figure 2.1. After
considering the space available and the space required by the relative
Strong Component-Based Methodology for Facility Layout Design 2. Facility layout Design (Literature Review)
using the space information available and prior diagrams, i.e. box six in
Figure 2.1. After taking into consideration other special items such as
material-handling methods, storage equipment, utilities location, building
codes, existing structures, safety and ergonomic issues, the space diagram
is modified to create layout alternatives to be evaluated.
A different perspective is the one given by Tompkins et al. (Tompkins,
J. A.,
et aI., 1996:295). This perspective suggests that the general overall phase
may be thought of as divided into three stages, namely analysis, search and
selection. From this partition, as seen in Figure 2.1, an output is obtained
from each stage. During the analysis stage, the space relationship diagram
is obtained; from the search stage, the layout alternatives are obtained; and
the proposed layout is obtained from the selection stage. Another
perspective is the one given by Hales (Hales H.L., 1984:40), which also
divides the procedure into three stages: relationships, space, and generation
of alternative layouts. Given the original sequential approach or following
these partitions, the steps or stages are performed separately and are
integrated in the last step, providing an overall approach to the facility layout
design. It seems that approaching the design by steps or stages provides a
better focus on each feature. Additional issues, such as space, shapes and
material-handling issues, can modify proposals by incorporating them during
the last stage of the process, before creating the design alternatives. It
should be stressed that the relationship and the space issues can be
considered as the most suitable features to be handled by mathematical
Modelling helps to clarify the problem and takes into account those relevant
factors that are critical in developing a layout. A model by itself does not
provide a solution to a problem; algorithms or solution techniques have to be
developed to obtain solutions to a model. Models are useful concepts even
though many of their assumptions may not be realistic. The layout analyst
has to be aware of the assumptions made in the models, and should use the
solution generated by a corresponding algorithm with caution. It must be
used only as a basis for generating solutions that can be applied in the real
world.
2.3.
Layout Analysis and Presentation Support Tools
Some of the complementary tools originally used to analyse a possible
layout proposal included drawings, templates, three-dimensional physical
models, and CAD systems.
Drawings, where generated manually, were considered a slow but necessary
task that took a long time to develop. Fortunately, computer technology is
now considered a drawing support tool that has given more speed to this
task, and is a supportive tool through CAD models and software available.
Another tool is a template, which helps to analyse layout designs before they
are implemented. These could be constructed or be bought as commercially
developed templates, and placed on a baseboard to indicate the position of
templates. These are also available commercially, and as with the previous
models, provide additional helpful information regarding the layout design.
In recent decades CAD systems have become very popular tools because
they have allowed users to create and reproduce more easily two and three
dimension drawings, not only to support layout analysis but also as a
presentation tool. Their popularity is due to the speed of adding, deleting,
modifying, saving drawings, generating new ones, and consequently
reducing the time, cost, and resources required to perform these activities.
Finally, they have become the most effective media for preparing and
presenting layout designs (Owens R., 2001).
2.4. Activity Relationships
Among the essential elements found in Systematic Layout Planning are
activity relationships and space requirements, and they can be considered
as information sources for the Facility Layout Design. Within the activity
relationships are the material flow relationships, which are of considerable
relevance since they show how elements are moved within the facilities, and
also show the relative importance of the relationship between facilities and
the movement of materials and components. A flow may be described in
terms of the flow subject, the resources required to support it, and the
communications that co-ordinate the resources and can be shown by their
design phase of the layout by determining the following (Heragu S.,
1997:45):
• Frequency of trips of material or some other measure of interaction
between facilities
• Location restrictions for facilities, if any
• Adjacency requirements between pairs of facilities, if any
The flow of materials, products, components, personnel or any other subject
of flow can be grouped as follows (Apple J.M., 1977:109):
• Requiring similar machinery or equipment
• Requiring similar processes
• Requiring similar operations
• Following the same sequence of operations or activities
• Having similar operation times
• With similar shape, size, purpose, or design
• Made of the same or similar materials
There exist many flow patterns which usually may be limited by the space
available for the deployment of the entities and which adopt different shapes.
Some of the most common patterns that can be found are aU-shaped,
S-shaped, W-S-shaped, straight line, or combinations of these (Heragu S.,
Strong Component-Based Methodology for Facility Layout Design 2. Facility layout Design (Literature Review)
2.5. Efficient Layout Interrelationship Representation
To evaluate alternative configurations, a measure of flow must be
established. Using a flow chart and a layout, an analyst can determine
whether the depicted process may have any unnecessary material
movements. The flows may be specified in a quantitative or qualitative
manner. Qualitative measures may include a subjective closeness rating, as
described in the systematic layout planning procedure in Section 2.2 above.
Quantitative measures may consider number of movements, product flow
quantities, costs and distances. Flows can be described in terms of the
from-to and frequency of trips tables or matrices. From-from-to tables are records of the
required trips made in each direction between any pairs of machines. The
frequency of trips table records the trips in both directions showing the total
number of trips between every facility pair. Additionally it may be useful to
specify that these trips, depending on their degree of sophistication, may be
carried out by personnel or by a material-handling device.
A from-to chart is constructed as follows:
• List all the workcentres in rows and across in columns, forming a square
matrix of size n X n, where n is the number of workcentres.
• Determine how the flow may be represented so as to indicate properly
number of units, weight, and volume. Moreover, the representation can
also be a subjective judgement of flow, indicating merely a relationship,
the number of times a link may be used, or it may just be an order of
precedence.
• Register the quantities to establish the measure of flow.
A frequency of trips chart is a table similar to the from-to chart which shows
the total number of trips between facilities by combining the items in both
directions. A difference that might be expected between both charts is that
frequency of trips is symmetrical and the from-to is not necessarily
symmetrical.
Distances are a way to express desirable adjacencies between any pair of
facilities on the production operation sequences. Depending on how they are
measured, this may lead to various possible solutions. Some of the most
common modes of measuring distance when developing layout design are
(Heragu S., 1997:56):
a. Euclidean: this is a metric that measures the distance between centres of
facilities. This metric is the shortest distance between any two given
points, calculated by the square root from the sum of the square of the
components.
b. Squared Euclidean: the same as the previous but without the square
Strong Component-Based Methodology for Facility Layout Design 2. Facility layout Design (Literature Review)
c. Rectilinear: This is commonly used because it is easy to compute and is
the sum of the absolute values of the distance components considering
the centroids of the facilities.
d. Aisle distance: this is the aisle travelling distance between the centres of
the facilities.
e. Adjacency: this metric indicates whether facilities are adjacent or not. It
does not differentiate between how far apart the facilities are.
f. Shortest path: This is related to network problems where the shortest
path is used to determine the distance between two facilities. A network
consists of nodes and arcs, where nodes represent facilities and an arc
between a pair of nodes represents a path between both nodes. Usually,
a weight is attached to each arc representing a cost, a distance, time or a
frequency.
In the literature, the layout's efficiency is typically shown in terms of material
handling costs. These costs are approximated with one or more or the
following interdepartmental flows: fij as the flow from department i to
department j; unit-cost values, Cij as the cost of moving one unit of load by
one distance unit from i to j; and department closeness ratings, rij as the
value of the closeness between department
i
and j (MellerR.A.,
Gau K.Y.,1996). The most commonly used quantitative criterion for evaluating layout
is given by
L L
cij fzj dij(1)
Cij, is the cost of moving a unit load of material by a unit of distance between
facilities i and j
fij, is the number of loads or trips between facilities i and j
dij , is the distance between facilities i and j measured using one of the
methods previously mentioned.
Based on how the activity relationships are considered, a layout design
objective can be expressed by considering any combination of the factors in
equation one as follows (Hassan, M.M.D., Hogg G.L., 1987):
a. To minimise the sum of the flow-distance of products between the
facilities when their relationships are stated by from-to charts, or
b. To maximise the facility adjacency when the relationships are stated by a
relationship chart.
It should be noted that how these activity flows or relationships between
facilities are recorded might have an impact or effect on the possible layout
designs. Given that intensity of relationships between facilities may be
represented by activity relationships or flows between them, this intensity
can be thought of as the representation of the proximity requirements or the
Strong Component-Based Methodology for Facility Layout Design 2. Facility layout Design (Literature Review)
2.6. Dedicated or Non-Dedicated Facilities Strategies
To determine if a layout might use dedicated or non-dedicated facilities is
another relevant issue in Facility Layout Design and may be related to the
economic feasibility of the expected sales volume.
It may be noted that, when dealing with dedicated facilities which may
produce one product or have a dominant product, it should be evident that
the product follows its production operation sequence to be elaborated. In
this case, the layout issue obviously focuses on answering questions related
to the other relevant layout requirements, such as the space usage, material
handling system, utilities location, environmental issues, and so on.
In non-dedicated facilities when dealing with multiple products and where
there is not a dominant product, the activities sequence becomes a relevant
issue, in addition to those issues mentioned for dedicated facilities.
Further detailed production systems classification located between product
(flow shop) and process Gob shop} configurations has suggested three
variants which may overlap within Group Technology, GT: namely, flow-line,
centre and cell (Singh N., Rajamani D., 1992:182). Centre layout has
process configuration with machines dedicated to specific families of parts or
components. This arrangement could lead to increased material handling
movements and may be more suitable when frequent changes in the mix of
omni-production sequence. The flow-line layout may be used when all the
components to be produced are assigned to a group that follows the same
machine sequence, and usually when automated material handling
equipment is used.
2.7. Summary
In the discussion in this Chapter, the relevance that relationships between
activities have on the design of layouts has been stressed. This is because
the chosen layout from those designs available may have an effect on other
required systems, such as the material handling system, and vice versa.
Consideration of activity relationships and space features in the development
of feasible designs are the most suitable to be treated by mathematical
models such as Graph Theory and Mathematical Programming. Moreover, it
has been highlighted that there are two instances in which these models
could be applied: in the general and in the detailed layout phases. The
general phase is also referred to as block layout, since it is developed at a
more global level within the organisational system, such as at departmental
levels or interdepartmental levels. The detailed phase works at a more
particular organisational level, such as inside each department or
intradepartmentally. Although most of the algorithms or heuristics to
determine layout deSigns originally were proposed to solve the block layout
designs, later they were extended to be applied to solve the detailed layout
Strong Component-Based Methodology for Facility Layout Design
2. Facility Layout Design (Literature Review)
This research addresses the detailed layout design, focusing on a
construction approach to determine the best possible machine configuration
in non-dedicated manufacturing environments. It uses Graph Theory to
develop layout alternatives when organisational environments need to deal
3. Facility Layout Design Solution Approaches (Literature
Review)
3. 1.
Introduction
The Facility Layout Design is a problem that can be classified into either
block or detailed layout, following Muther's procedure. The Block Layout is
associated with the second phase of this procedure and the Detailed Layout
with the third phase; therefore the formulation for the layout design can be
established for either the general or the detailed layout designs. In this
Chapter, the focus is on the block layout, and the next Chapter will focus on
the detailed layout. Before describing these models, this Chapter includes a
brief discussion of the modelling process, and of models and some of their
limitations when approaching the Facility Layout Design. In addition to these
basic issues, two large sections comprise the rest of the chapter. One
section deals with formulations related to the Quadratic Assignment Problem
and its variants, followed by a discussion of the solution methods available to
address a problem like this. The other section presents Graph Theory
models followed by their solution approaches, as alternatives to the
Strong Component-Based Methodology for Facility Layout Design 3. Facility Layout Design Solution Approaches (Literature Review)
3.2.
The Limitations
of
Facility Layout Design Modelling
The facility layout design can be classified as block or detailed, depending
on the level of abstraction of the facility to be modelled. The block layout
broadly speCifies the relative position among interrelated facilities. Additional
work may be required to create a detailed layout of each facility contained in
a block layout, which will specify exact facility pOSitions, aisle structures, and
utilities outlets. The detailed layout design may include flow-line layout,
machine layout, and cellular manufacturing design (Meller R.D., Gau K.Y.
1996). Several approaches to both layout design problems, block and
detailed, are found in the literature (Hassan M.M.D., 1994). However, Block
Layout formulations as Quadratic Assignment Problems and Graph
Theoretic Models are important approaches and are discussed in this
chapter.
The mathematical modelling process of the facility layout design is a
complex and useful task, when formulating as well as solving these
problems. Data reliability and computational complexity are among the
limitations which the facility layout designer may confront during its
modelling. Data reliability refers to data employed during the model
formulation or its solution, and is usually associated with the model's
objective functions. The computational complexity feature is related to the
Among the most common items related to the objective functions of a Facility
Layout Design are flows, times, costs and distances. Reducing any sort of
waste is considered an improvement strategy. Hence, improving material
flows by reducing distances, reducing the material handling costs without
affecting the flow, and/or placing facilities as close as needed, are
considered possible strategies. Material flows to a large extent are
dependent on market demand, which is considered stochastic in nature and
often uncertain; and consequently designers work with demand estimates
(Heragu 5.5., Kusiak
A.,
1988). Once real values are available to verifyresults, designs are already operating and may be expensive to change.
Costs, on the other hand, are usually associated with the material handling
systems required to move items from one workcentre to another, and to
place and retrieve items from machines. These costs are functions also of
displacements required by the items and generally are assumed to be linear
and incremental. Times and distances are assumed to be known, but
sometimes they are estimated values which may be approximations of the
real measures, usually when new facilities have to be designed. There are
other occasions on which qualitative values (based on subjective judgments)
are used as measures of proximity: they are converted to quantities and
used to maximise the proximity among many facilities that are desirable to
be grouped together. The major drawback in all cases is the subjectivity of
Strong Component-Based Methodology for Facility Layout Design 3. Facility Layout Design Solution Approaches (Literature Review)
The required computer resources are another limitation when handling the
facility layout design. Intuitively it requires more memory and computer time
to solve a problem that has 100 workcentres than one that has only 10. The
number of workcentres may give an adequate idea of the resources that may
be needed when solving a problem. If it is expressed as a function, f(n), of
the number of workcentres (n), then a problem requires an algorithm which
can be solved in polynomial or non-polynomial time. For a problem to be
solved in polynomial time means that f(n) is a polynomial function of n such
as n, n2, n3, ... ; this may contrast with non-polynomial time for which f(n)
grows exponentially with n in cases such as 2n, en, 3n, ... and n! (Daskin
M.S., 1995:85). Algorithms whose solution time required may be classified
under this criterion are labelled as class P if they are solvable in polynomial
time or class NP if they are only solvable in non-polynomial time. The
Facility Layout Design Problem is class NP, a point demonstrated by Shani
and Gonzalez (Shani S., Gonzalez T., 1976). Moreover, it has been
mentioned that obtaining optimal solutions to problems of a combinatorial
nature that are NP of size over 15 workcentres is difficult to be optimally
solved (Heragu S.S., Kusiak A., 1990). Hence, many approaches to solving
the Layout Design problem have been suggested that offer an approximation
to the solution of the design question.
There have been two main formulation approaches developed to solve the
facility layout design problem: the Quadratic Assignment Problem approach
(QAP) and the Graph Theoretic approach (Meller R.D. Gau K.Y., 1996). In
(Heragu S., 1997:123). Some of the most common formulation models and
solution approaches are presented in the rest of the chapter. Firstly, the
models are discussed and after them their respective solution procedures.
3.3.
Quadratic Assignment Problem (QAP)
Among the literature that was at first published on facility layout design was
the Quadratic Assignment Problem formulation by Koopmans and Beckman
in 1957(Koopmans T.e., Beckman M., 1957), as acknowledged by Meller
(Meller R. D., Gau K.Y., 1996), Leung (Leung
J.,
1992b), and Kusiak andHeragu (Kusiak
A.,
Heragu S.S., 1990). It was firstly introduced to solve thelocation of facilities considering the reduction of transportation costs between
facilities (Koopmans T.e., Beckman M., 1957). Later, it was adapted to
address and solve the layout of interacting facilities with equal areas: that is,
it assumes that workcentres or departments have equal squared areas
(Heragu S. 1997:139). This implies that there are known n fixed locations
available, and consequently distances can be predetermined. Hence, the
purpose is to assign n facilities to n available locations. A design restriction is
that only one workcentre should be assigned to only one specific location
and that a location should hold only one workcentre. The term workcentre is
used in a generic sense to name a department, a machine, workstation,
entity, or any facility in which there is an interest in finding its proper
sequence order or adjacency in a layout. It can be said that in the general
layout design problem workcentres are departments and the flow between
Strong Component-Based Methodology for Facility Layout Design 3. Facility Layout Design Solution Approaches (Literature Review)
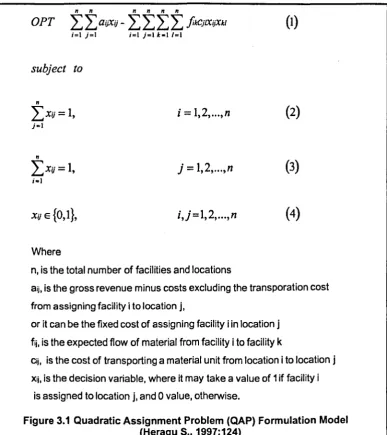
The name Quadratic Assignment Problem was suggested because its
objective function involves the product of two decision variables. A Quadratic
Assignment formulation of the Facility Layout Design formulation model is a
problem that can be stated as in Figure 3.1. This assumes that when a
department is assigned to a location, it also weights this location by
considering the cost of transferring materials from this relative position to the
other possible locations. The formulation objective function may address two
different kinds of optimisation problems: maximisation and minimisation. In a
maximisation situation, the first member of the function, aiJ, is considered as
gross revenues minus the primary costs excluding the transportation costs,
which are considered by the second term when a facility i is assigned to a
specific location j. In the other situation, minimisation, in the first member, aij,
is considered as a fixed cost of assigning facility i to location j and the
n n n n n n
OPT L L aijXij - L L L L j;kCjlXijXkl
(I)
;=1 j=1 ;=1 j=1 k-I 1=1
subject to
n
LXij=l, i =
1,2, ...
,n(2)
j-I
n
LXij=l, j = 1,2, ... ,n
(3)
i-I
Xij E
{O,l},
i,j=1,2, ... ,n(4)
Where
n, is the total number of facilities and locations
aij, is the gross revenue minus costs excluding the transporation cost from assigning facility i to location j,
or it can be the fixed cost of assigning facility i in location j fij, is the expected flow of material from facility i to facility k
Cij, is the cost of transporting a material unit from location i to location j Xij, is the decision variable, where it may take a value of 1 if facility I
[image:46.505.59.446.64.498.2]is assigned to location j, and 0 value, otherwise.
Figure 3.1 Quadratic Assignment Problem (CAP) Formulation Model (Heragu S., 1997:124)
In both cases, minimisation and maximisation, the transportation costs
consider the goods flow and the unitary transportation cost between facilities
assigned. In most of the cases the pursued objective function is intended to
minimise the transportation costs, the second member of the objective
function, omitting the first member of the function by considering it to be
Strong Component-Based Methodology for Facility Layout Design 3. Facility Layout Design Solution Approaches (Literature Review)
Although the OAP has been used to model facility layout design problems, it
cannot be useful in all types of formulations (Heragu S., 1997:126). In a
machine layout design situation, it cannot be used because machines are
usually different in size and shape, and consequently distances between
locations cannot previously be determined. This situation is avoided when
assuming equal-sized areas, an assumption that might not hold in the case
of machine layouts (Heragu S., 1997:126). These types of layouts will be
discussed in more detail in the following chapter.
There are two particular cases of the Quadratic Assignment Problem, known
as the Linear Assignment Problem (LAP) and the Travelling Salesman
Problem (TSP) (Kusiak A., Heragu S.S., 1987). The LAP situation is
assumed to be different from the QAP because its concern is only in the
relative assignment of an entity to a location. That is, the objective function is
reduced to the first term by considering that there are no interrelations
between facilities and consequently, there is no flow of goods between them.
In the TSP case, the shortest route that is soughtbegins and ends in the
same facility and visits each facility once during the tour. The number of
facilities, n, is given and so are the distances between each pair of them.
Thus, the objective is to assign the n facilities to one of the n positions in the
path so that the travelled distance is minimised. As in the case of the OAP,
the LAP and the TSP require the number of locations and the number of
In the following sections, the focus is on other formulations used to model
the facility layout design. These cover the variants or derivations from the
QAP, and other mathematical tools used to formulate and address this
problem from different perspectives, such as Dynamic, Multi Objective and
Mixed Integer Programming.
3.3.1. CAP Modelling Variations
A way to deal with different quadrilateral size areas is suggested by dividing
the area to be occupied by the facilities into a grid, creating artificial flows
between these grids to ensure that they are not split. The areas of the layout
and the individual facilities are expressed as unit squares (Sule D.R,
1994:487). Doing this only multiplies the need for more computational
resources, making it almost impossible to solve small design problems with a
few blocks of unequal areas (Meller RD., Gau K.Y., 1996). This formulation
is known as the Quadratic Set Covering Problem (QSP), in which distances
are measured from the centroids (Kusiak A., Heragu 5.5., 1987).
Lawler (Lawler
E.L.,
1963) also demonstrated an equivalent linear model inwhich the term XitXkl located in the second member of the QAP objective
function (Figure 3.1) is replaced by Yijkl, obtaining this wayan equivalent and
simpler version of the problem representation, where Yijkl takes the value of
one, if there is an existing interrelationship between facility i at location j and
facility k at location I, and zero otherwise. Another modelling modification to