Does leadership show through
behavior?
Ann-Christin Kock
B.Sc. Thesis
June 2016
Faculty of Behavioral Management and
Social Science
Supervisors: Dr. ir. P.W. de Vries Dr. M. van Bommel
Abstract
Because public concerts raise many public safety concerns with respect to the escalation of group excitement it seems important to monitor groups to prevent hazardous incidents. Research suggests that it can be effective to engage with leaders of groups (Solera et al., 2015). The purpose of this paper is therefore to investigate whether it is possible to (validly) detect a leader within a group on the basis of behavioral data. It was supposed that (a)
(perceived) leaders show initiative behavior and have (b) less interpersonal distance compared with the followers. Groups where (c) leaders have closer physical proximity to the group are hypothesized to perform better. Furthermore it was asked whether the perceived leader can be recognized on the basis of walking distance. These effects are expected to be greater in groups with formal leaders than in groups with informal leaders. An experiment with groups of four was executed. The groups had to search locations while wearing GPS-trackers. Half of the groups had a directed (formal) leader and the other half had an informal leader. The perceived cohesion of the group and the representativeness of the chosen leader were also measured. The results revealed that leaders tend to show initiative behavior. The representativeness also played a key role. It (significantly) predicted interpersonal distance, task performance and duration. The type of group had an influence on interpersonal distance and task performance. From this it can be concluded that it is not the membership (being a leader or not) that has a crucial influence on behavioral patterns, but the representativeness of the leader.
Keywords: emergent leadership, formal and informal groups, perceived cohesion,
Samenvatting
Het lijkt belangrijk groepen op openbare evenementen te monitoren om gevaarlijke incidenten te voorkomen. Uit onderzoek blijkt dat het hierbij effectief is de leiders van groepen te
benaderen (Solera et al., 2015). Daarom is het doel van dit paper te onderzoeken of het mogelijk is leiders in een groep op basis van gedragsmaten te detecteren. Er werd
verondersteld dat (a) (waargenomen) leiders initiatief tonen en (b) minder interpersoonlijke afstand ten opzichte van de volgers vertonen. Verder werd de verwachting opgesteld dat groepen waar de leiders minder fysieke afstand met de groep hebben beter presteren. De laatste hypothese die werd opgesteld houdt in dat de effecten in groepen met informele leiders sterker zijn dan in groepen met formele leiders. Ten slotte werd er gekeken of de
(waargenomen) leider op basis van de totale loopafstand gedetecteerd kan worden. Een experiment met groepen van vier participanten werd uitgevoerd. De groepen moesten diverse locaties opzoeken en daarbij GPS-trackers dragen. De helft van de groepen had een
toegewezen, formele leider en de andere helft had een informele, natuurlijke leider. Naast de gedragsmaten werden ook de waargenomen cohesie en de waargenomen representativiteit gemeten. De resultaten lieten zien dat (waargenomen) leiders de neiging hebben initiatief te tonen. Er werd ook duidelijk dat representativiteit een grote rol speelt wat betreft de leider. Deze variabele voorspelt zowel de interpersoonlijke afstand en de prestatie alsook de benodigde tijd van een groep. De groepssoort (informele of formele leider) had een
significante invloed op de interpersoonlijke afstand en de prestatie van de groep. Hieruit kan worden geconcludeerd dat niet het lidmaatschap (het wel of niet zijn van een leider) een cruciale invloed op gedragsmaten heeft, maar de representativiteit van de (waargenomen) leider.
Sleutelwoorden: opkomende leiderschap, formele en informele groepen, waargenomen
Although most events/occasions such as sporting events, concerts or festivals pass mostly peacefully and without problems, the occurrence of incidents during such events can have enormous consequences (Lee & Hughes, 2006). The consequences become apparent in headlines such as “1100 pilgrims killed during mass panic” (De Volkskrant, 2015) or in accidents such as the Love Parade in Duisburg in 2010 (Hitzler, Kirchner, & Betz, 2011). Losing control over a crowd can result in a high number of deaths, injuries and causalties, and those affected often struggle for years with the psychological effects of trauma (Huber, 2012). Lee and Hughes (2006) emphasized in their report the increasing number of reported crowd-related incidents during the last decade. In summary, controlling large groups can be difficult and losing control can have enormous consequences. To successfully monitor and control crowds and to prevent incidents, a well-founded knowledge of crowds is required. To be able to successfully intervene in the future, it is important to understand how crowds are
constituted, and what kinds of behavior they are likely to exhibit. Therefore, this paper investigates aspects of group behavior, focusing on the leader-follower relationship within groups. GPS-data gathered during a Scavenger Hunt are used to analyze the moving patterns of several groups and to identify the potential leaders.
Reviewing the literature, there is no single accepted definition of a crowd (Ge, Collins & Ruback, 2009; Solera, Calderara & Cucchiara, 2015). However, it is important to make a distinction between a collection of people sharing a common location and a psychological crowd that shares a common social identity. The current paper refers to psychological crowds. A crowd consists of several small groups that are defined as “a set of individuals who have direct interactions with each other over a period of time and share a common fate, identity, or set of goals” (Kassin, Fein & Markus, 2008, p. 297; Kenny et al., 2001).
Within groups, the members may take different roles, including the role of a leader (Solera et al., 2015). Leaders are those who often define the norms and values of a group and act as guides. They therefore offer orientation. Followers have confidence in the leader, who consequently has a great influence on the group. Leaders have the ability to transform,
whether intentionally or unintentionally, the behavior of followers from individual behavior into group behavior (Hogg et al., 2006).
identity. As a consequence they gain power (Haslam et al., 2011; Turner, 2005). An external figure – an out-group member – may want the group to do certain things that are not in their own interest. When an attempt is made to force a crowd into subordination, there is an
increased probability that the crowd will reject the guidance of the out-group authority figure. This is another reason to approach the leaders of a crowd in order to control a crowd.
Identified leaders can be separated from the group to eliminate their possibly negative
influence on the group. On the other hand, it can be highly valuable to work together with the leaders, making use of the influence they have. Leaders may initialize, encourage, motivate and stimulate behavior and thereby take control over a crowd (King, Johnson, & Van Vugt, 2009; Solera et al., 2015). All these points underline the importance of leadership detection.
Therefore, the current paper investigates whether it is possible to detect leaders within a group. One focus of the current research will be to examine how leaders within a group can be detected through the analysis of GPS data.
Theoretical Background
For the detection of leaders, understanding the concepts of crowd, group, leader and follower is necessary. In the following sections, these four terms are explained in more detail.
As already noted, there is a difference between a group of people sharing the same location and a psychological crowd. A psychological crowd is characterized by a common social identity and is a synonym for group. In the literature, a group is often referred to as a unit consisting of individuals who share common goals, motives, norms and values (Sherif, Sherif & Murphy, 1956). These individuals are related to each other in a manner that
enhances the performance of the group. To act as a group, it is important that the members of the group share a common identity.
In a group different roles can be assumed, such as the role of leader. In the literature different definitions of a leader are used. Andersson, Gudmundsson, Laube and Wolle (2008), for example, define the leader as someone who does not follow anyone but is followed by several members of the group. This definition, however, only notes the relative distance between the leader and the followers. Social and psychological factors are here not taken into account. However, the current study is concerned with detecting the
needs (Solera et al., 2015). A process occurs in which not only individual but also collective performance is facilitated to reach common goals (Van Vugt, 2006). So the leader has not only the role of guiding the group and establishing stability, but also of stimulating and supporting the members of the group. A leader represents the group with its norms and values (Haslam et al., 2011). Several different types of leader can be enumerated, but such
distinctions are beyond the scope of this study.
Leaders and followers have a reciprocal relationship (Antonakis & Atwater, 2002; King et al., 2009; Solera et al., 2015). Trust is one of the most important factors that influences this relationship (King et al,. 2009). Due to a common identity with the other members of the group, a feeling of ‘we-ness’ arises which strengthens the cohesion of the group (Haslam et al., 2011). This feeling facilitates group behavior.
Now that the theoretical background concerning crowds, groups, and the different roles of those within them has been clarified, the different variables expected to influence the
recognition of leaders are to be considered.
Following on from this, hypotheses are put forward for investigation. The current literature of leadership detection is presented in more detail.
Initiative taking as predictor
As mentioned, leaders are often defined in the literature in terms of their physical location in relation to the other members of the group. For instance, they are referred to as those who walk in front of the group (Laube & Wolle, 2008). The current paper focuses on the psychological definition of a leader. Contrary to the former definition, the latter implies interpersonal factors, such as trust, perceived cohesion and interconnectedness, instead of purely examining the interpersonal distance between the members of a group. The extent to which these two different definitions cohere is examined. Can the (psychological) leader be detected by observing his initiative behavior? The recent literature gives some indications of answers to this question. Bullée (2015), for example, shows that taking the initiative in a group seems to be one indicator of perceived group leadership. In the experiment the participants were asked to state three attributes of the perceived leader. 20% of the
differ from other employees in terms of activity levels, willingness to make decisions and ambition (Bray & Howard, in 1983 as in Van Vugt, 2006). Therefore, in the current study it is expected that the perceived leader of a group will more often initiate behavior compared to other members of the group (hypothesis I).
Interpersonal Distance as Predictor
In this study, the (interpersonal) distance is determined by the proximity of followers to the group leader. In the literature physical distance is often related to social distance (Antonakis & Atwater, 2002). Social distance refers to “the psychological effects of actual and perceived […] differences between the supervisor and subordinate” (p.13, Antonakis & Atwater, 2002). These differences involve values (beliefs, attitudes), power and
demographical factors (gender, race). It should be noted that similarities as well as differences are perceived by supervisors and subordinates to exist between them. Some authors have suggested that these two constructs, physical and social distance, act in a similar manner (e.g., Howell-Marenda & Hall, 1999). In the literature it is also suggested that social distance involves the physical distance of followers (e.g. Shamir, 1995). In contrast to that view, Antonakis and Atwater (2002) argue that social distance and physical distance should be sharply distinguished as concepts. Indeed, it is possible for a leader to be at a great physical distance from the followers and be socially and psychologically close to them. Therefore, the current paper treats these concepts as distinct and concentrates on physical distance.
Most literature on physical distance stresses that the performance of a group is negatively correlated with the physical distance between leaders and followers. This implies that members of a group perform better if they are physically close to the leader. Napier and Ferris (1993), for example, argue that close physical proximity is associated with higher performance, greater follower satisfaction and lower probability of leader withdrawal.
From this the authors conclude that the follower-leader distance should be smaller in order to preserve a good atmosphere within the group; this is because physical abandonment has a negative effect on the quality of the leader-follower relationship and reduces the
quality of the leader-follower relationship, as well as the performance of the group, is negatively influenced by a large physical distance
As mentioned in the definition of a leader, a leader wants to achieve the common goals of the group and wants to promote individual and collective performance. This implies that the leader (consciously or unconsciously) reduces physical distance in order to exert a positive influence on the group. Therefore, the assumption is made that the interpersonal distance of perceived leaders from their followers will be (significantly) less than the average interpersonal distance between the followers (hypothesis IIa). Furthermore it is hypothesized that groups with perceived leaders that have a smaller interpersonal distance from their followers will perform better during the experiment than groups where the perceived leader has a greater interpersonal distance from their followers (hypothesis IIb).
Formal and Informal Leader as Predictor
There are two types of groups - formal and informal groups (Sanchez-Cortes et al., 2010). To clarify these concepts, definitions of both terms are given. The concept of a formal group is often used in the context of organizations or institutions. Usually, this kind of group is deliberately composed by an ‘external’ person who has a higher position in the hierarchy. However, these groups can also be created by voting process. Due to his position, the leader of a formal group usually has power or authority over the group. In contrast to the formal group, there is no formal hierarchy in an informal group. Here, all members are equal in principle. Furthermore, the members can decide individually whether to stay in the group, which means that they are members voluntarily. Members of an informal group are interconnected and have direct contact (Tonkens, Duyvendak, & Hurenkamp, 2006). In general, there is no allocation of roles, no system or formalization in informal groups (Van den Berg, Van Houwelingen, & De Hart, 2011). A spontaneous and often unconscious
process leads to the emergence of a leader. The member who seems the most competent to the other members usually takes the role of the leader. An example of an informal group is a group of colleagues who decide to go drinking after work, or to a concert.
the formal leader, or perceive the leader as someone without sufficient competences to execute the role of a leader. On the other hand, members of informal groups identify their informal leaders with the group, because these leaders arise, spontaneously and organically, from within the group. The norms and values represented by the informal leader are more quickly accepted because the leader is chosen by, and thereby represents, the (whole) group. Because of shared identity which is more likely to develop with an informal leader, group behavior is mostly driven by the cognitive process in which individuals identify themselves in terms of group membership rather than separate individuals (Haslam, Reicher & Platow, 2011, Turner, 1982). Overall, an informal leader can therefore exert more influence on the group than a formal leader.
The current research will examine to what extent the influence of informal leaders and formal leaders on their groups will differ, as measured using behavioral data (GPS). It is expected that the observed effects which are predicted in hypotheses I, II, and III will be greater in groups with an informal perceived leader than in groups with a formal leader (hypothesis III).
Walking Distance as Predictor
Another measure by which group leaders could possibly be detected may be walking distance. For this measure no recent literature could be found that made assumptions about a relationship. However, other variables, for instance auditory factors such as talking time, volume of a person, or speaker turn duration, have been related to group leader recognition (Jayagopi, Hun Yeo & Gatica-Perez, 2009; Hung, Jayagopi, Ba, Odobez, & Gatica -Perez, 2008; Mast, 2002). All the studies conclude that the leader of a group exhibits active behavior (Jayagopi et al., 2009; Sachez-Cortez,Aran, Mast & Gatica-Perez, 2012). This active behavior becomes obvious from a longer speaking time, a higher voice volume, as well as from
Hypotheses
On the basis of the theoretical background an experiment was executed. Participants were divided into groups of four. After playing games to get to know each other, the groups had to find several locations using photos given to them by the researcher. They had to take photos of these locations, and the time they took to complete the Scavenger Hunt was also measured. GPS-trackers recorded the movement patterns of the participants during the task. Perceived group cohesion and interconnectedness was measured before and after the
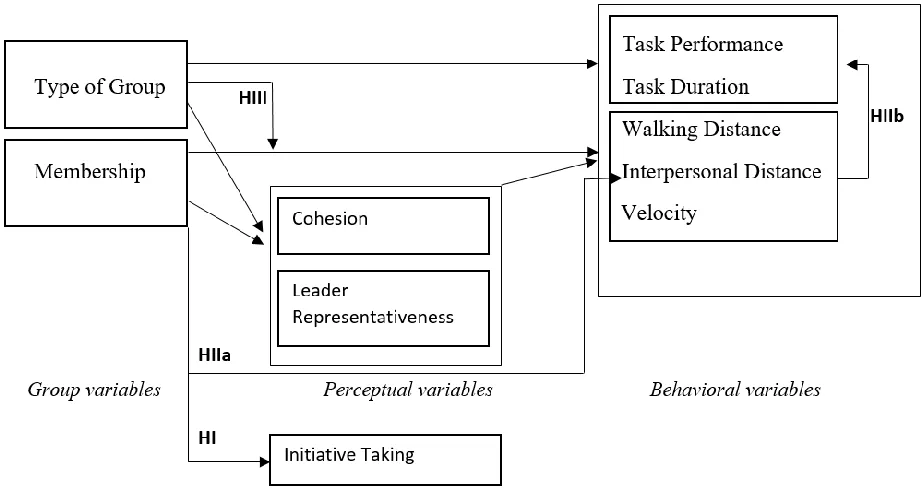
Scavenger Hunt. Using a camera, it was also recorded which member of the group grasped the paper with the instructions for the Scavenger Hunt. In addition, the perceived leader was identified by asking the participants to complete a ranking of the members of their group. All hypotheses are presented in more detail below, also in figure 1.
I. The perceived leader of a group will more often initiate behavior compared to other members of the group. Perceived leaders will therefore more often be the ones who grasp the instructions and walk the greatest distance at the front of the group compared to (perceived) followers.
II. a The averaged interpersonal distance between perceived leaders and their followers
will be (significantly) less than the average interpersonal distance between the followers.
b The groups with perceived leaders that have a smaller interpersonal distance from
their followers will perform better during the experiment than groups in which the perceived leader has a greater interpersonal distance from their followers. Performing better is defined in this case as finding (significantly) more locations from photos given by the researcher (and take correct photos of them) and being (significantly) faster in executing the Scavenger Hunt.
Figure 1. Conceptual model describing the relationships between variables measured in this
study.
Method
Participant
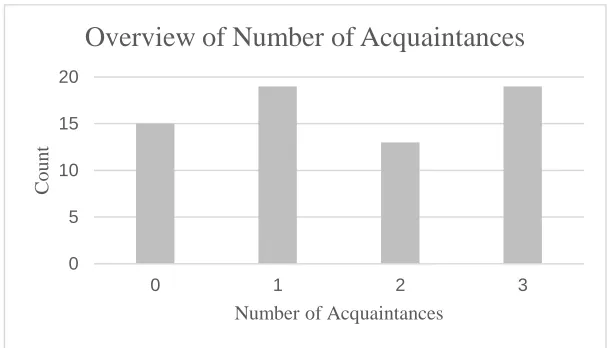
In total, 66 subjects participated in this study. Seven males (10.6%) and 59 females (89.4%) took part voluntarily and signed the informed consent form (Appendix A). 32 of the participants were German (48.5%) and 34 were Dutch (51.5%) The age of the participants varied from 18 to 24 (M= 20.76, SD= 1.55). Most of the participants had a VWO diploma (89.4%). Several participants already had a Bachelor’s degree (7.6%) or a HAVO diploma (3%). Only 28.8% of the participants stated that they lived on the campus, whereas 71.2% stated that they lived in the city. 15 (22.7%) of the participants knew nobody else in the group, 19 (28.8%) knew one person, 13 (19.7%) knew two persons and 19 (28.8%) knew three persons, figure 2. In this study, the convenience sampling method was used. Several social media sites and the SONA system were used to get in touch with the participants. The SONA system is an online subject pool management system.
Figure 2. Graphical overview of the number of participants knowing other participants of
their group. Design
In the study, a 2x2 factor design was used. The independent variables were
Membership (follower vs. leader) and Type of Group (informal vs. formal). The dependent variables were Cohesion, Leader Representativeness, Walking Distance, Interpersonal Distance, Velocity, Initiative Taking, Task Duration and Task Performance.
Procedure
Before the students entered the room, the researcher wrote down in which Type of Group the group was supposed to be (informal/formal) depending on the condition of the previous group. The study started with an informal group and then the groups were alternately assigned to the two types without any information about that. In the informal groups (N = 8) a leader could naturally emerge during the study. In formal groups (N = 9) a leader was
allocated by the order of the participants’ arrival. To avoid a systematic bias, it was decided that in the first experimental group the participant who arrived first would be designated as leader, in the second group the second participant, and so on. In the fifth group, the order was repeated so that the first person entering the room was designated as the leader of the group.
After welcoming the participants, it was emphasized that the participants were allowed to stop with the study without giving reasons and without dealing with any consequences. Furthermore, it was stressed that the data recorded by the camera, the GPS tracker and questionnaires would be saved, treated anonymously and not given to a third party. The participants were asked whether they agreed with their data being recorded. After that, the participants filled in the informed consent form and the questionnaire with all demographic variables, see Appendix B.
0 5 10 15 20
0 1 2 3
C
o
u
n
t
Number of Acquaintances
Then, the participants were asked to play several games to get to know the other (two or three) members of the group. After showing the participants where the instructions for the games were, the researcher turned on the camera and left the room. In the first game the participants had to briefly introduce themselves. In the second game, theyhad to throw one (or two) balls to another group member while saying his/ her name aloud. The goal of the game was to memorize each other’s names, and to establish the feeling of a group due to a common goal. In the last game, the participants had to (collectively) balance two folding rules on their fingers. Together, they had to squat once while balancing the rules. The goal of this game was to develop a strategy by communicating and through this a stronger “we”-feeling. For a more detailed description and the instructions for the games, see AppendixC. Subsequently, the participants filled in questionnaires about the (perceived) Cohesion of the group and the (perceived) Interconnectedness within the group, see Appendix D and Appendix E.
Next, the participants were asked to let the researcher into the room who then asked the participants to hang two GPS-trackers around their necks, on top of their clothes so that the trackers could accurately make contact with several satellites. With this system, spatio-temporal information about the location of a person could be registered weather
independently and reliably (Milner, 2016). For this space-based navigation I-gotU GT-600 GPS trackers were used which registered every second the latitude and longitude of the participant’s location.
Then, the researcher asked the participants to grasp the paper with the instructions about the Scavenger Hunt (Appendix F) and the camera (Panasonic Lumix DMC-FS10). Each group was supplied with a fully loaded camera with a cleared chip card to avoid participants getting information from previous groups. Then, the researcher wrote down who grasped the paper (Initiative Taking) and stopped the recording of the camera.
After that, the researcher and the participants went outside. The participants were supposed to find thirteen locations on the campus which were shown on thirteen photos they got with the instructions (Appendix G). They had to make photos of these locations with at least one group member in each photo within maximal 30 minutes. They were not permitted to move around by bike or to split up and individually search for the locations. The researcher also stressed that the participants should not go into or next to (large) buildings. The
Finally, the researcher demonstrated how to handle the GPS trackers. Every participant was given two trackers to avoid missing data. When no questions remained, the participants left and the researcher began recording the time.
At the arrival the researcher stopped the time for the participants (Task Duration). Together, they turned off the GPS trackers and went to the research room. There, the participants filled in four questionnaires about perceived (perceived group) Cohesion, the (perceived) Interconnectedness, the (perceived) Leader and Membership (ranking), and Leadership Representativeness (see Appendix D, E, H & I). Subsequently, the participants were given candies for taking part which was the secret price. The aim of the study, to measure leadership on the basis of GPS data, the conditions and other relevant information was explained to the participants. Finally, the researcher answered remaining questions from the participants.
In the informal condition, the paper with the instructions about the game laid on the table whereas in the formal condition, the designated leader received the paper with the instructions of the game and the map with the pictures to control the situation when the researcher was outside. Controlling was defined as managing the time-component, having oversight and leading the group so that they completed the task in an orderly fashion while having essential information about the task. In the informal group everyone could grasp the map containing the photos and the instructions about the task. In both conditions, the instructions about the task had to be grasped (Initiative Behavior).
Measurements
Different measures were used in the course of this study. In more detail, several questionnaires and behavioral variables were measured.
Demographic variables. In this questionnaire the participants were asked to fill in
several demographic variables: gender, age, highest education and nationality. Furthermore, they had to state whether they live on the campus and how many members of the group they already knew before taking part.
Interpersonal Connectedness. The questionnaire Inclusion of Other in the Self Scale
(IOS) was used to measure the perceived interpersonal connectedness of the participants with the group. It is a single-item pictorial measurement where participants have to choose
psychometric suitable and shows to be “consistent with diverse theoretical orientations to closeness” (Aron et al., 1992).
Cohesion. The perceived cohesion of the group was measured by a subscale of the
Revised Subsitute for Leadership Scale (Podsakoff, Niehoff, Machenzie, &Williams, 1993). The chosen subscale “closely-knit, cohesive, interdependent work groups (COHES)”
(Podsakoff et al., 1993, p. 707) was translated from English to Dutch. The scale consists of six items with a five point Likert scale varying from 1 (“totally disagree”) to 5 (“totally degree”). An example item was “members of my group work together as a team”. In this study, the questionnaire was shown to have excellent reliability, Cronbach’s α = .902 (George, 2003).
Membership and Leader. To make it possible to detect the perceived leader of a
group, each group member was asked to rank the members of the group with respect to their leadership of the group. In doing so, the participants made a ranking and distributed ten points across the group. This distribution had to clearly show one (perceived) leader of the group. The summation of all scores given the group made it possible to detect the perceived leader. The character of each participant’s membership of the group was determined through the use of this questionnaire. Two variables were created on the basis of this questionnaire, Leader (yes vs. no) and Membership. The variable Membership was a ranked variable. Here, “1” indicated that the participants were, compared to the other members of the group, perceived as the ones who were the most leading. The rank “4” was assigned to members who were seen as the most following members.
Leader Representativeness. A subscale of the Identity Leadership Inventory (ILI)
was used to measure the perceived representativeness of the group’s chosen leader. It was measured whether the chosen leader was perceived as being one of them. The subscale consists of four items with a five point Likert scale varying from 1 (“totally agree”) to 5 (“totally disagree”). An example of an item is “this leader is representative of members of the group” (Steffens et al., 2014). The reliability of this questionnaire has been shown to be acceptable in this study with a Cronbach’s α of .717 (George, 2003).
Behavioral Measures. The behavioral measures include variables gathered by the
GPS-trackers. Furthermore, other measures recorded by other technical devices are taken into account.
the group. Therefore, only grabbing the paper was used as Initiative Behavior for analyzing hypothesis I.
Performance. For this variable, the number of locations each group correctly discovered was checked. This was done by counting all the correct pictures stored on the camera.
Task Duration. The time each group spent on executing the task of the Scavenger Hunt was taken into account for the overall performance. The time was measured by the researcher.
Walking Distance. This variable represents the total distance a participant walked during the Scavenger Hunt (in meter). The distances between all locations the GPS-trackers recorded (one location per second) were summed per participant.
Interpersonal Distance. This variable represents the (averaged) distance a participant had with the other group members. To be able to analyze the difference in interpersonal distance between leaders and followers, the interpersonal distance of the leader with the followers and the interpersonal distance of the followers among each other was computed and assembled to one variable, Interpersonal Distance.
Velocity. This variable represents how fast a participant was in average (in kmH). For this, it was calculated how much time passed between the locations the trackers recorded. This time was averaged and computed to one variable.
Data Analysis
Before the data was analyzed, the final data set was compounded. Then, the dataset was extended (means were computed) and some analysis were done to get an overview over the data (correlation matrix). Finally, the hypotheses were tested.
For testing the relationships between the group, perceptual and behavioral variables (see figure 1), two-step hierarchical regression analyses were computed. At the second step, the interaction term between the two independent variables was added. A mean score of the independent variables was aggregated and a new variable was computed. The new variable was a subtraction of the participants’ score in the variable minus the mean score.
Results
test of independence (N = 8). The test analyzed the relation between the assigned leaders and the perceived leaders. Therefore, the two variables Leader and Assigned Leader were used in the test. The test was not significant which shows that there is no significant association between Leader and Assigned Leader, p = .189. A total of 50% of the allocated leaders actually were perceived as the group’s leader. 22.4% of the members who were not allocated as leader finally served as a leader.
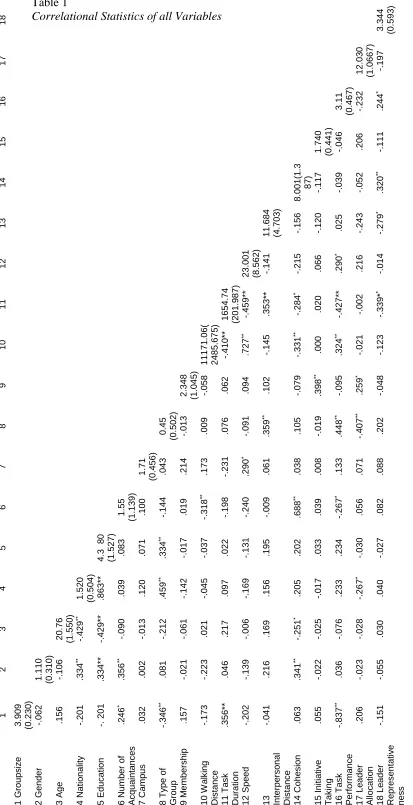
Descriptives
There are several correlations between the variables measured in this study. Table 1 gives an overview. Here, only results that probably could have systematically influence the results of the study are briefly illustrated. Especially the variable Number of Acquaintances had a great influence on different variables used in the statistical analyses. It correlated significantly with Walking Distance [r(64) = -.318, p = .010], Cohesion [r(64) = .688, p < .001] and Task Performance [r(64) = -.267, p = .030].
The perceived Cohesion after playing the games was relatively high (M = 3.955, SD = 0.736). This shows that playing the games created a (temporal) connection between the members of the group. The goal of playing the games which was creating a feeling of togetherness and being a unit therefore succeeded. A Wilcoxon Signed-Rank Test indicated that the perceived cohesion after the Scavenger Hunt (M = 4.054, SD = 0.723) was
1 2 3 4 5 6 7 8 9 10 11 12 13 14 15 16 17 1 G ro u p s iz e 3 .9 0 9 (0 .2 3 0 ) 2 G e n d e r -.0 6 2 1 .1 1 0 (0 .3 1 0 ) 3 Ag e .1 5 6 -.1 0 6 2 0 .7 6 (1 .5 5 0 ) 4 Nat io n a lity -.2 0 1 .3 3 4 ** -.4 2 9 ** 1 .5 2 0 (0 .5 0 4 ) 5 Ed u c a ti o n -. 201 .3 3 4 ** -.4 2 9 ** .8 6 3 ** 4 .3 80 (1 .5 2 7 ) 6 Num b e r of Ac q u a in ta n c e s .2 4 6 * .3 5 6 ** -.0 9 0 .0 3 9 .0 8 3 1 .5 5 (1 .1 3 9 ) 7 Cam p u s .0 3 2 .0 0 2 -.0 1 3 .1 2 0 .0 7 1 .1 0 0 1 .7 1 (0 .4 5 6 ) 8 T y p e of G ro u p -.3 4 6 ** .0 8 1 -.2 1 2 .4 5 9 ** .3 3 4 ** -.1 4 4 .0 4 3 0 .4 5 (0 .5 0 2 ) 9 M e m b e rs h ip .1 5 7 -.0 2 1 -.0 6 1 -.1 4 2 -.0 1 7 .0 1 9 .2 1 4 -.0 1 3 2 .3 4 8 (1. 04 5) 10 W a lk in g Dis ta n c e -.1 7 3 -.2 2 3 .0 2 1 -.0 4 5 -.0 3 7 -.3 1 8 ** .1 7 3 .0 0 9 -.0 5 8 1 1 1 7 1 .0 6 ( 2 4 8 5 .6 7 5 ) 11 T a s k Dura ti o n .3 5 6 ** .0 4 6 .2 1 7 .0 9 7 .0 2 2 -.1 9 8 -.2 3 1 .0 7 6 .0 6 2 -.4 1 0 ** 1 6 5 4 .7 4 (2 0 1 .9 8 7 ) 12 Sp e e d -.2 0 2 -.1 3 9 -.0 0 6 -.1 6 9 -.1 3 1 -.2 4 0 .2 9 0 * -.0 9 1 .0 9 4 .7 2 7 ** -.4 5 9 ** 2 3 .0 0 1 (8 .5 6 2 )
13 Inte
[image:18.595.69.482.30.835.2]Analyzing relationships between variables
In the following, several hierarchical regression analysis are described for explaining the relationships presented in figure 1 (introduction). The relationship between the group variables (Type of Group & Membership), the perceptual variables (Cohesion & Leader Representativeness) and the behavioral variables (Task Performance, Task Duration, Walking Distance, Interpersonal Distance & Velocity) were assessed. For all analysis a significance level of .05 was used. Furthermore, it was checked for the necessary assumptions for assessing a regression (normality, collinearity, multicollinearity & homoscedasticity). Only the statistics of the significant results are presented in the text. A summary of statistical information including the non-significant regression can be found in the appendices. Also the predictive ability of the different models are presented in the appendices.
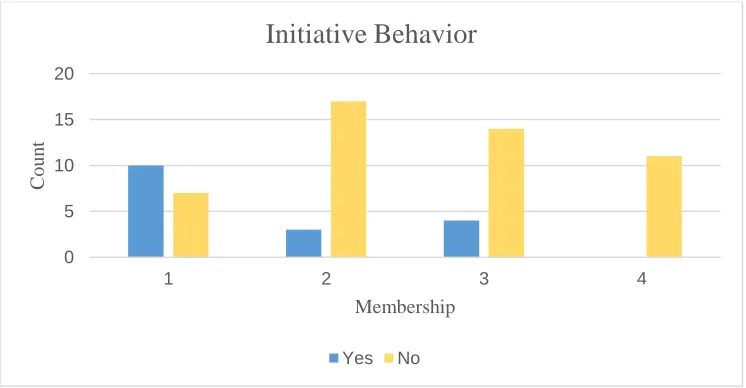
Assessing the initiative behavior of leaders and followers. Direct logistic regression was
[image:19.595.112.485.532.726.2]performed to assess the impact of Membership, Type of Group and the interaction of these variables on the likelihood that leaders would show initiative behavior. Going in front of the group could finally not be measured because of unforeseen difficulties. Therefore it was chosen to make only use of grabbing instructions as indicator for initiative behavior. The full model containing all predictors was significant, X² (3, N = 66) = 11.656, p = .009. This implies that the model was able to distinguish between participants grabbing the instructions and participants that did not. Only the variable Membership made a significant unique contribution to the model (p = .003). Therefore, hypothesis I is accepted. The more a group member is perceived as the leader of the group, the bigger is the probability of showing initiative behavior. Type of Group and the interaction were not significant predictors.
Figure 3. Initiative Behavior for different kind of Membership.
0 5 10 15 20
1 2 3 4
C
o
u
n
t
Membership
Initiative Behavior
Assessing relationship between Interpersonal Distance, Task Performance and
Duration. It was hypothesized that (perceived) leaders with a smaller distance to the
followers will perform better compared to (perceived) leaders with a bigger distance. For this, solely the data of the leaders was used. For analyzing this hypothesis (IIb) two linear
regressions were computed. The first regression model tested whether the Interpersonal Distance predicts the Task Performance of groups. Furthermore, no evidence was found that there is a predictive relationship between the Interpersonal Distance and Task performance, t(15) = -0.559, p = .584, β = -.143. There was no evidence found that the smaller the distance
between the leaders and their group is, the more photos a group makes. A second linear regression was calculated with Interpersonal Distance as independent and Task Duration as dependent variable. It was tested whether groups with leaders that have a smaller
Interpersonal Distance are faster in executing the Scavenger Hunt. Interpersonal Distance was not able to predict the independent variable, indicating that there is no significant relationship between the interpersonal distance of the leaders with the followers and the required time for executing the task, t(15) = 1.707, p = .109, β = .403. As a result of these two regression analysis, hypothesis IIb cannot be accepted. It could not be proved that groups were the perceived leaders have a smaller distance to the group will perform better than leaders with a bigger distance.
Assessing relationship between the group variables and perceptual variables. The
independent variables of the analysis were Type of Group (formal vs. informal) and
Membership (ranking of leadership) and the interaction between the two variables. Appendix J gives an overview of all statistical information with respect to these regressions.
In the first hierarchical regression it was analyzed to what extent the independent variables are able to predict the (perceived) Cohesion of a group (dependent variable). The independent variables were not able to (significantly) predict the (perceived) Cohesion of a group. Also the interaction between the two independent variables was not able to predict the Cohesion.
The second hierarchical regression with the independent variables Type of Group and Membership examined the ability for predicting the (perceived) Leader Representativeness (dependent variable). The Type of Group, Membership, and the interaction between Type of Group and Membership were not able to predict the perceived representativeness of the chosen leader. No main-or interaction effect was found.
Assessing relationship between group variables and behavioral variables. The
behavioral variables were Type of Group, Membership and the interaction between the two variables. The dependent variables were: Task Performance, Task Duration, Walking Distance, Interpersonal Distance and Velocity. Appendix K shows an overview of all statistical information about the executed regressions.
Firstly, a hierarchical regression analysis with the mentioned independent variables (Type of Group, Membership and interaction between Type of Group and Membership) was assessed to test whether the independent variables were able to (significantly) predict Task Performance. The regression revealed that Type of Group significantly predicted the Task Performance, t(62) = 3.983, p < .001, β = .466. The positive beta reveals a positive
relationship between the variables indicating that groups with a formal leader performed better during the Scavenger Hunt. Better performing implies finding more locations (making more correct photos).
For assessing predictive ability of Type of Group, Membership and the interaction of Type of Group and Membership on the Task Duration, a hierarchical regression was assessed. No main effect or interaction effect was found. The independent variables could not predict the dependent variable.
In addition to that hierarchical regression was assessed to analyze whether the
independent variable Type of Group, Membership and the interaction between Type of Group and Membership could predict the Walking Distance of a group. The independent variables did not have a (significant) predictive ability for the Walking Distance of a group. Therefore, the sub question ‘can the perceived leader of a group can be recognized based on the walking distance’ with which was dealt in the introduction, can be negated. Membership does not predict the distance a group walked during the task.
Finally, it was assessed whether it is possible to predict the Velocity of a group based on Type of Group, Membership and the interaction. The independent variables did not show any predictive ability for the dependent variable.
Because none of the interactions showed predictive value, hypothesis III was rejected. Informal groups did not significantly higher on the behavioral measures.
Assessing relationship between perceptual variables and behavioral variables. Several
hierarchical regression analysis were computed to analyze whether Cohesion and Leader Representativeness are able to predict several independent variables (Task Performance, Task Duration, Walking Distance,Velocity & Interpersonal Distance). The interaction effect was added in the second block to test whether the interaction effect adds predictive value to the model. In Appendix L the most important results of the regression analysis are presented.
First of all, a hierarchical multiple regression with the independent variables and the dependent variable group Task Performance was assessed. The interaction between the two independent variables (Cohesion and Leader Representativeness) was entered at stage two in the model. Although the regression equation was not significant, Leader Representativeness showed to significantly predict the Task Performance of groups, t(62) = 2.239, p = .029, β = .286. This implies that the more a leader is perceived as representative for the group, the better a group performs. The other independent variables did not significantly predict Task Performance.
Another hierarchical regression was calculated to analyze a possible prediction of the duration of the task (dependent variable) based on Cohesion and Leader Representativeness. The interaction between Cohesion and Leader Representativeness was added at the second stage to analyze whether it adds any predictive ability to the model. The model was
significant in predicting the required time for the groups for executing the task, F(2, 62) = 5.534, p = .006. The independent variable Leader Representativeness significantly predicted Task Duration, t(62) = -2.257, p = .027, β = -.277. The negative beta shows a negative relation between the two variables. This implies that the more representative a perceived leader of a group is, the less time a group needs for the execution of the task. The two other variables had no significant effect on Task Duration.
Furthermore, a hierarchical regression was assessed with the independent variables Cohesion and Leader Representativeness, and the dependent variable Walking Distance. At the second stage, the interaction between Cohesion and Leader Representativeness was added. The model revealed to be significant, F(2, 62) = 3.836, p = .027, adj. R² = .081. The
t(62) = -2.572, p = .012, β = -.323. The negative beta indicates a negative relation between
the two variables. In this case, it means that the more a groups perceives cohesion between the members, the less a group totally walked during the Scavenger Hunt. Leader
Representativeness did not have any predictive value on the Walking Distance of a group. An interaction effect was also not found.
In addition, a hierarchical regression with Cohesion, Leader Representativeness and the interaction between the two variables as independent variables and Interpersonal Distance as dependent variable was assessed. The perceived representativeness of the chosen leader showed to be significantly predict the Interpersonal Distance, t(62) = 2.002, p = .050, β = -.255. The negative beta value indicates a negative relation between the variables. It suggests that the more group members perceive their leader as representing the group, the less distance there is between the members among each other and the leader.
Finally, a hierarchical regression with Cohesion and Leader Representativeness as independent variables and Velocity as dependent variable was assessed. Cohesion and Leader Representativeness did not significantly contributed to the regression model. Adding the interaction did not add explain any addition variation in Velocity significantly. The independent variables were not able to predict Velocity.
Additional Analysis
The analysis were computed to check whether Number of Acquaintances influenced the predictive ability of variables with which it significantly correlated. Therefore the hypotheses containing the variables Task Performance (hypothesis III & IIb) and Walking Distance (subquestion) were tested with Number of Acquaintances as covariate. All results can be seen in appendix M.
First of all, an additional hierarchical regression was executed to test whether Number of Acquaintances had an influence on the predictive ability of Interpersonal Distance of leaders on the Task Performance of a group. The Number of Acquaintances was added as covariate and Interpersonal Distance was added in the second block. As in the regression executed without the covariate, the additional regression showed to be not significant, t(15) = -0.540, p = .598, β = -.143. This indicates that Interpersonal Distance does not predict the Performance of a group also when controlling for the covariate Number of Acquaintances.
Secondly, an additional analysis was done for measuring whether the regression for hypothesis III was influenced by Number of Acquaintances. Therefore Number of
significant. Membership, Type of Group and the interaction does not have any predictive ability on Task Performance. Therefore, as also in earlier analysis without the covariate, hypothesis III could not be accepted.
[image:24.595.80.529.260.522.2]Furthermore, it was also checked whether number of Acquaintances changes the results with respect to the sub question about the Walking Distance. The hierarchical regression revealed that only Number of Acquaintances significantly predict the Walking Distance, t(63) = -2.662, p = .010, β = -.318. Like in earlier analysis, the other independent variables had no predictive value on Walking Distance.
Figure 2. Significant relations between the variables.
Conclusion and Discussion
With respect to monitoring groups during public events to maintain public safety, it seems to be an effective option to address the leaders of groups (Solera et al., 2015). But how is it possible to (validly) detect a leader within a group on the basis of behavioral data? This paper analyzed to what extent it is possible to detect leaders within a group on the basis of GPS-data. For this, an experiment was conducted where GPS trackers recorded a group’s moving pattern during a task. The perceived leadership was measured using a ranking made by the participants.
Therefore, hypothesis I can be accepted. Furthermore, it was found that groups which perceived the cohesion within the group as high walked less than groups with low cohesion. The more a perceived leader is regarded as representative, the more photos a group found and the less time they needed for the Scavenger Hunt. Also the interpersonal distance of the group was smaller the more a leader was perceived as representative of the group. On top of that, groups where the leader could emerge naturally had a smaller interpersonal distance and performed better.
Discussion
It was hypothesized that (perceived) leaders of groups will more often initiate behavior compared to the followers (hypothesis I). Therefore it was expected that perceived leaders would more often grab the instructions than followers. The results show that actually displaying this form of initiative behavior predicts being perceived as the leader or not. This study is consistent about the literature about initiative behavior and therefore supports the findings. Previous work showed that the frequency of initiating behavior in an experimental setting correlates with being nominated as the leader of a group (Kremer & Mack, 1983). Emergent leaders were shown to be more often the ones who actively take part in group activities (Riggio, Riggio, Salinas & Cole, 2003). Van Vugt (2006) explains that groups often have difficulties with making decisions. An (emergent) leader therefore facilitates this process by coordinating and initiating behavior. Due to this behavior a group is able to act like a unit. So, leaders persuade other group members to follow them which facilitates the group
decision-making process.
Furthermore, it was expected that the interpersonal distance between (perceived) leaders and their followers would be smaller compared to the mutual interpersonal distance of the followers. This hypothesis (IIa) was rejected in the course of the study. In the theoretical background it was argued that the interpersonal distance between leaders and followers would be small because leaders want to communicate more with the members, create a good
atmosphere and therefore perform better with the group (Napier & Ferris, 1993). In the literature a larger physical distance is often referred to as a negative moderator for leadership results. When taking the potential initiative behavior of leaders into account one could assume that (theoretically) leaders cannot be often in the middle of the group because they are
by analyzing whether the initiative behavior of leaders is not only expressed in grabbing instructions, but also in walking in front of the group more often compared to the followers.
Nevertheless, in this study it becomes obvious that it is not simply being the leader, but the perceived representativeness of a leader, that plays a crucial role with respect to the interpersonal distance. The more representative a leader is of a group, the smaller the interpersonal distance. Being representative means reflecting the values and identity of the group (Halevy, Berson & Galinsky, 2011). It is defined as being one of the group, an in-group member. The smaller distance can be explained by a social interconnection which is inspired by the leader. Furthermore, a representative leader seems to elicit perceptions and emotions with respect to other in-group members. From this result one can conclude that to be perceived as a leader is not enough to bring the group closer together. The proximity of members of the group depends instead on the prototypicality of the leader. This reveals that the appearance of a leader has a huge influence on the behavior of the group.
In addition, it was hypothesized that groups where the interpersonal distance between the leader and the followers is smaller will perform better than groups where the leader has a greater distance from the followers. There was no evidence for this hypothesis (IIb). The interpersonal distance was not able to predict how fast a group was or how many photos they found. A possible reason for this could be the design of the study. Participants often
mentioned during the debriefing that the photos were easy to find. The distance between the locations was that small that the other locations were easily found. Furthermore, the time restriction of thirty minutes was not challenging for the most groups. Participants reported that they had time left, so they unconsciously stopped taking the time component seriously. Only giving the motivation of reward which depended not only on the number of correct photos but also on the time was not enough for the participants for paying attention to the time. Therefore, it can be concluded that the method of measuring the performance of the groups could be improved. In further research, the number of locations could be increased. Another option would be choosing locations that are further away from each other.
Furthermore, the time component could be made more challenging by changing the task and reducing the time for the Scavenger Hunt. It would also be possible to send messages to the participants after a determined time to remind the participants of the time component.
is an underlying variable - perceived representativeness of the leader - that influences both, the interpersonal distance (see above) and the group performance. The more representative a leader is, the better the overall performance of a group is (duration and photos). Also De Cremer, Van Dijke en Mayer (2010) also stress that leaders that are perceived as being prototypical and representing a group`s values and norms, are more effective (Haslam et al., 2011). The leader facilitates the communication between the members and the atmosphere. Therefore the group was better able to perform well.
Finally, it was assumed that the effects of hypotheses I, IIa and IIb would be greater for informal groups than for formal groups. The effects which were taken into account were interpersonal distance, initiative taking and performance. There was no evidence found for this hypothesis. There was no significant interaction and as a consequence there was no difference in behavioral data. In contrast to the findings of this study, Sanchez et al. (2010) state that informal leaders have a stronger influence on the group than formal groups that are chosen by an authority because the members of a group tend to accept and trust an informal leader more than a formal leader. Because the followers autonomously chose their leader, the possibility is high that they will follow the instructions of this leader. The different findings of this paper and the literature can be explained by the setting of the experiments. In the
literature, groups that already exist were taken into account. This implies that the members know each other and have experiences with each other that change their group behavior. In the current study, there were some participants who knew each other but generally the groups were newly formed. Therefore no group structure was available, the allocation of roles had not already taken place, and the members had to get to know each other. This different starting point could explain the different findings. In further research it could be tested to what extend newly formed groups and existing groups differ in that aspect. Therefore participants that have known each other for a longer time could be compared to participants that do not know anyone of their group.
On top of that, it was argued that the members of informal groups would have more trust in their leader because of a shared identity, common motives, norms and values (Sherif, Sherif & Murphy, 1956). It can be questioned to what extent this study is able to create such essential cognitive changes and perceptions in such a short time. For further research, the process of allocating leaders could be improved. Instead of only giving the leader the
Further Research
(Emergent) leadership is not only expressed in behavioral data. Another interesting topic is the influence of the different types of leadership on the behavioral data. Do all types of leaders behave in the same way in the same time and place? There are several leadership styles: the authoritarian, paternalistic, democratic, laissez-faire, transactional or
transformational (Eagly Johannesen-Schmidt & Van Engen, 2003). Authoritarian style, for example, implies efficiency focused leaders that take control over the group, maintain one-way, dominant interaction and exert a dominating influence over the group. Contrary to this style, a leader with a democratic style facilitates social equality and takes a special interest in the collective process of making decisions that are of interest to all group members. In further research it would be interesting to investigate whether there are behavioral differences
between leaders who exhibit the different styles. A leader with a democratic style would maybe have a close proximity to the members to be able to communicate efficiently and take the interests of all group-members into account. A leader with an authoritarian style on the other hand would maybe have a greater interpersonal distance to demonstrate that he has control. Initiative taking behavior may also be greater than among leaders with a democratic style.
In future research, the design of this study can be used. The Scavenger Hunt and the games before it were able to facilitate dynamic behavior of a group. It was possible to observe several behavioral and perceptual phenomena. The structure of this study – the games, the Scavenger Hunt, the time before and after the Scavenger Hunt for filling in questionnaires – made it possible to measure a wide variety of data. In future research, this structure can be used and additional data resources can be easily added. Nevertheless some design-related aspects of the current study could be modified to obtain even more information about
cameras could be used as an additional means of analyzing the movement patterns of groups. This extended version of the current study would be able to draw on much more information to detect possible leaders. . It would also be more similar to the final goal of this study - detecting leaders within crowds.
Conclusions
To summarize, the representativeness of a leader plays a key role in the behavioral patterns of groups. The membership only influences the initiating behavior of members. Another important finding is that groups in which the leader could naturally emerge perform better and show a smaller interpersonal distance.
References
Andersson, M., Gudmundsson, J., Laube, P., & Wolle, T. (2008). Reporting leaders and followers among trajectories of moving point objects. GeoInformatica, 12(4), 497-528. doi: 10.1007/s10707-007-0037-9
Antonakis, J., & Atwater, L. (2002). Leader distance: A review and a proposed theory. The Leadership Quarterly, 13(6), 673-704. doi: 10.1016/S1048-9843(02)00155-8 Aron, A., Aron, E. N., & Smollan, D. (1992). Inclusion of Other in the Self Scale and the
structure of interpersonal closeness. Journal of personality and social psychology, 63(4), 596. doi: http://dx.doi.org/10.1037/0022-3514.63.4.596
Bass, B. M., & Stogdill, R. M. (1990). Bass & Stogdill's handbook of leadership: Theory, research, and managerial applications. Simon and Schuster.
Bray, D. W., & Howard, A. (1983). The AT&T longitudinal studies of managers. In K. Shaiel (Ed.), Longitudinal studies of adult psychological development (pp.112-146). New York: Guilford Press.
Bullee, J. H. (2013). Detection of leadership in informal (small) groups based on CCTV information.
Butler, C. (1999). Transformational Leadership: Industrial, Military, and Educational Impact. Military Review, 79(3), 91.
Carmi, A. Y., Mihaylova, L., Septier, F., Pang, S. K., Gurfil, P., & Godsill, S. J. (2011). MCMC-based tracking and identification of leaders in groups. In Computer Vision Workshops (ICCV Workshops), 2011 IEEE International Conference on (pp.
112-119). IEEE. doi: 10.1109/ICCVW.2011.6130232
De Cremer, D., van Dijke, M., & Mayer, D. M. (2010). Cooperating when “you” and “I” are treated fairly: The moderating role of leader prototypicality. Journal of Applied Psychology, 95(6), 1121. http://dx.doi.org/10.1037/a0020419
Ge, W., Collins, R. T., & Ruback, B. (2009). Automatically detecting the small group structure of a crowd. In Applications of computer vision (wacv), 2009 workshop on (pp. 1-8). IEEE. Doi: 10.1109/WACV.2009.5403123
George, D. (2003). SPSS for windows step by step: A simple study guide and reference, 17.0 update, 10/e. Pearson Education India.
Eagly, A. H., Johannesen-Schmidt, M. C., & Van Engen, M. L. (2003). Transformational, transactional, and laissez-faire leadership styles: a meta-analysis comparing women and men. Psychological bulletin, 129(4), 569. http://dx.doi.org/10.1037/0033-2909.129.4.569
Hitzler, R., Kirchner, B., & Betz, G. (2011). Das Beispiel Loveparade. In Urbane Events (pp. 261-277). VS Verlag für Sozialwissenschaften. doi: 10.1007/978-3-531-92902-6_17 Hogg, M. A., Fielding, K. S., Johnson, D., Masser, B., Russell, E., & Svensson, A. (2006).
Demographic category membership and leadership in small groups: A social identity analysis. The Leadership Quarterly, 17(4), 335 - 350. doi:
10.1016/j.leaqua.2006.04.007
Huber, M. (2012). Trauma und die Folgen: Trauma und Traumabehandlung. Junfermann Verlag GmbH.
Hung, H., Jayagopi, D. B., Ba, S., Odobez, J. M., & Gatica-Perez, D. (2008). Investigating automatic dominance estimation in groups from visual attention and speaking activity. In Proceedings of the 10th international conference on Multimodal interfaces (pp. 233-236). ACM. doi: 10.1145/1452392.1452441
Kassin, S. M., Fein, S., & Markus, H. R. (2008). Social Psychology. 9th. Wadsworth: Cengage Learning.
Haslam, S. A., Reicher, S., & Platow, M. (2011). The new psychology of leadership : identity, influence, and power. Hove, East Sussex [England]; New York: Psychology Press. Halevy, N., Berson, Y., & Galinsky, A. D. (2011). The mainstream is not electable: When
vision triumphs over representativeness in leader emergence and effectiveness. Personality and Social Psychology Bulletin, 0146167211402836. doi:
10.1177/0146167211402836
Howell, J. M., & Hall-Merenda, K. E. (1999). The ties that bind: The impact of leader-member exchange, transformational and transactional leadership, and distance on predicting follower performance. Journal of applied psychology, 84(5), 680. doi:
http://dx.doi.org/10.1037/0021-9010.84.5.680
Jayagopi, D. B., Hung, H., Yeo, C., & Gatica-Perez, D. (2009). Modeling dominance in group conversations using nonverbal activity cues. Audio, Speech, and Language
Processing, IEEE Transactions on, 17(3), 501-513. doi: 10.1109/TASL.2008.2008238
PENNSYLVANIA STATE UNIV UNIVERSITY PARK APPLIED RESEARCH LAB.
King, A. J., Johnson, D. D., & Van Vugt, M. (2009). The origins and evolution of leadership. Current biology, 19(19), R911-R916. doi: 10.1016/j.cub.2009.07.027 Kremer, J., & Mack, D. (1983). Pre‐emptive game behaviour and the emergence of
leadership. British Journal of Social Psychology, 22(1), 19-26. doi: 10.1111/j.2044-8309.1983.tb00561.x
Lee, R. S., & Hughes, R. L. (2006). Prediction of human crowd pressures. Accident Analysis & Prevention, 38(4), 712 - 722. doi: 10.1016/j.aap .2006.01.00.
Mast, M. S. (2002). Dominance as expressed and inferred through speaking time. Human Communication Research, 28(3), 420-450. doi: 10.1111/j.1468-2958.2002.tb00814.x
Milner, G. (2016). What is GPS?. Journal of Technology in Human Services, 34(1), 9-12. Doi: 10.1080/15228835.2016.1140110
Napier, B. J., & Ferris, G. R. (1994). Distance in organizations. Human Resource
Management Review, 3(4), 321-357. doi: 10.1016/1053-4822(93)90004-N
Reicher, S., Stott, C., Cronin, P., & Adang, O. (2004). An integrated approach to crowd psychology and public order policing. Policing: An International Journal of Police Strategies & Management, 27(4), 558-572.doi:
http://dx.doi.org/10.1108/13639510410566271
Riggio, R. E., Riggio, H. R., Salinas, C., & Cole, E. J. (2003). The role of social and emotional communication skills in leader emergence and effectiveness. Group Dynamics: Theory, Research, and Practice, 7(2), 83. doi: 10.1037/1089-2699.7.2.83
Shamir, B. (1995). Social distance and charisma: Theoretical notes and an exploratory study. The Leadership Quarterly, 6(1), 19-47. doi: 10.1016/1048-9843(95)90003-9
Sherif, M., Sherif, C., & Murphy, G. (1956). An outline of social psychology. Harper. Solera, F., Calderara, S., & Cucchiara, R. (2015). Learning to identify leaders in crowd. In
Proceedings of the IEEE Conference on Computer Vision and Pattern Recognition
Workshops (pp. 43-48). doi: 10.1109/CVPRW.2015.7301282
Tonkens, E., Duyvendak, J. W., & Hurenkamp, M. (2006). Wat burgers bezielt. een onderzoek naar kleinschalige burgerinitiatieven. Den Haag: Universiteit van Amsterdam / NICIS Kenniscentrum Grote Steden.
Turner, J. C. (1982). Towards a cognitive redefinition of the social group. In: H.Tajifel (Ed.). Social identity and intergroup relations, 15-40. Cambridge: Cambridhe University
Press.
Van den Berg, E., van Houwelingen, P., & de Hart, J. (2011). Informele groepen:
Verkenningen van eigentijdse bronnen van sociale cohesie. Den Haag, Sociaal en Cultureel Planbureau
APPENDIX
Appendix A
Informed Consent
Beste deelnemer,
De deelname van dit onderzoek is volledig vrijwillig en u kunt op elk moment zonder opgaaf van redenen met het onderzoek stoppen.
De binnen het onderzoek verzamelde data wordt anoniem en vertrouwelijk behandeld. De resultaten zullen alleen voor dit project worden gebruikt. Er zullen geen conclusies over enkele personen worden getrokken. Tijdens het onderzoek worden uw locaties via GPS geregistreerd. Het doel van het onderzoek wordt na afloop door de onderzoeker bekend gemaakt.
Voor dit onderzoek is het noodzakelijk dat u uw medestudenten geen informatie over dit onderzoek geeft. Dit is belangrijk om goede resultaten te krijgen.
Het ondertekenen van dit document betekend dat u over het onderzoek geïnformeerd bent en vrijwillig akkoord gaat aan dit onderzoek deel te nemen.
Als u nog vragen hebt, kunt u de onderzoeker Ann-Christin Kock
([email protected]) vragen. Wij gaan ervan uit dat u met volledig inzet aan het onderzoek meewerkt en uw best doet om de opdrachten zo goed mogelijk uit te voeren.
Naam Deelnemer: ___________________________
Handtekening Deelnemer: ___________________________ Datum __________________________
Appendix B
Vragenlijst – demografische gegevens
Vul deze vragenlijst zonder overleg en meekijken van andere proefpersonen in. Omcirkel de antwoorden die voor jou van toepassing zijn.
Demografische gegevens
Wat is je geslacht? Man Vrouw
Wat is jouw leeftijd? …... jaar Wat is je nationaliteit? Duits
Nederlands
Anders, namelijk ……….. Wat is je hoogst genoten opleiding? Havo
Mbo
Abitur (Duits) Bachelor Master
Anders, namelijk ……….. Ken je al iemand uit de groep? Nee
1 persoon 2 personen 3 personen Woon je op de campus? Ja
Appendix C
Teambuilding
Spel 1
- 2 Minuten
Het eerste spel heeft als doel dat jullie elkaar leren kennen. Hierbij stelt iedereen zich kort voor en vertelt iets over zichzelf.
Spel 2
- 5 Minuten
Hierbij staan jullie in een kring. Iedereen gooit en vangt de bal een keer. Het is de bedoeling dat jullie de volgorde van de eerste ronden bijhouden. Telkens als iemand de bal gooit moet diegene de naam van het groepslid hardop zeggen waarnaar hij/zij de bal gooit. Als binnen 3 rondes geen fouten meer gebeuren mag een tweede bal erbij gepakt worden. Deze bal heeft een nieuwe volgorde en ook hierbij moeten de namen hardop worden gezegd. De oude bal moet nog steeds op de oude volgorde worden gegooid. Als er een fout gemaakt word, moeten jullie opnieuw beginnen. Jullie hebben 5 minuten de tijd.
Spel 3
- 4 Minuten
Appendix D
Vragenlijst - Groepscohesie1
Vul deze vragenlijst zonder overleg en meekijken van andere proefpersonen in. Lees de stellingen goed door. Je eerste gedachte na het lezen zal een goede indicatie voor het maken van een kruisje zijn. Er zijn geen verkeerde antwoorden.
Helemaal
mee oneens
Oneens Neutraal Eens Helemaal
mee eens
Er is veel vertrouwen tussen de groepsleden.
O O O O O
De groepsleden werken samen als een team.
O O O O O
Mijn groepsleden weten dat ze op elkaar kunnen rekenen.
O O O O O
Mijn groepsleden komen voor elkaar op.
O O O O O
Mijn groepsleden zien elkaar als vrienden.
O O O O O
1
Appendix E
Vragenlijst – Inclusion of Self Scale- identificatie met de groep 2
Zet een vinkje bij het plaatje dat het beste jouw relatie met de groep weergeeft. Er zijn geen verkeerde antwoorden.
2 Aron, A., Aron, E. N., & Smollan, D. (1992). Inclusion of Other in the Self Scale and the structure of interpersonal closeness. Journal of
Appendix F
Opdrachtomschrijving
Beste Studenten,
Hieronder vinden jullie een aantal foto’s. Deze foto’s laten verschillende locaties op de campus zien. Het is de bedoeling dat jullie zo veel locaties mogelijk vinden. Maak ter bewijs een foto met één of meer groepsleden erop. Let op: het moet duidelijk zijn dat het precies dezelfde locatie is. Afhankelijk van hoeveel locaties jullie goed hebben, krijgen jullie ook een
prijs na het onderzoek.
Voor deze opdracht hebben jullie in totaal 30 minuten de tijd, wees op tijd terug! Fietsen is niet toegestaan, jullie moeten de hele tijd lopen. Blijf ook de hele tijd in de groep, dus zoek niet apart naar de locaties. Jullie zijn één team en moeten dus samen de opdracht vervullen.
Succes!
Appendix G
Appendix H
Vragenlijst – waargenomen leider
Vul deze vragenlijst zonder overleg en meekijken van andere proefpersonen in. Vul hieronder alle namen van de groepsleden in, inclusief jezelf. Geef elk groepslid (ook jezelf) punten die aangeven in hoeverre iemand tijdens de opdracht de rol van de leider heeft ingenomen. In totaal mag je 10 punten aan de hele groep geven. Hoe meer punten je iemand geeft, hoe meer zie je diegene als leider van de groep. Er moet duidelijk een iemand als leider worden aangewezen, vermijd dus het geven van dezelfde aantal punten. Er zijn geen
verkeerde antwoorden.