University of Warwick institutional repository: http://go.warwick.ac.uk/wrap
This paper is made available online in accordance with publisher policies. Please scroll down to view the document itself. Please refer to the repository record for this item and our policy information available from the repository home page for further information.
To see the final version of this paper please visit the publisher’s website. Access to the published version may require a subscription.
Author(s): WS Kendall, Y Shen and E Thonnes
Article Title: N-fold way simulated tempering for pairwise interaction point processes
Year of publication: 2006 Link to published article:
http://www2.warwick.ac.uk/fac/sci/statistics/crism/research/2006/paper 06-11/
N
-fold way simulated tempering for pairwise
interaction point processes
Wilfrid S. Kendall
a, Yuan Shen
b,1, Elke Th¨onnes
b,∗
,1aDepartment of Statistics, University of Warwick
bCentre for Scientific Computing and Department of Statistics,
University of Warwick
Abstract
Pairwise interaction point processes with strong interaction are usually difficult to sample. We discuss how Besag lattice processes can be used in a simulated tem-pering MCMC scheme to help with the simulation of such processes. We show how the N-fold way algorithm can be used to sample the lattice processes efficiently and introduce the N-fold way algorithm into our simulated tempering scheme. To calibrate the simulated tempering scheme we use the Wang-Landau algorithm.
Key words: Pairwise interaction point processes, Besag lattice processes, MCMC, simulated tempering,N-fold way algorithm, Wang-Landau algorithm
1991 MSC: 60J10, 68U05, 60G55, 60D05
1 Introduction
Pairwise interaction point processes are common models for random point pattern. However, they are usually not amenable to analytic examination and therefore require simulation-based inference. Markov chain Monte Carlo (MCMC) methods produce Markov chains that can be used to sample such processes. However, for models with strong interaction, these Markov chains often suffer from high autocorrelation and so the resulting estimates have high asymptotic variances. To improve mixing of these chains (and thus reduce the autocorrelation) methods like simulated tempering are being used. In this pa-per we develop a variant of simulated tempa-pering based on the use of Besag
∗ Corresponding author. Present address: Department of Statistics, University of
Warwick, Coventry CV4 7AL, UK.
lattice processes. These define point processes via the joint distribution of point counts in cells dividing the sampling window. We can sample these lat-tice processes using anN-fold way algorithm, a method originally introduced for Markov random fields, which reduces computation time for Markov chains with long waiting times between transitions from one state to another.
The paper is structured as follows. First we introduce pairwise interaction point processes and Besag lattice processes. Then we provide a review on MCMC methods and ways of improving these. We then discuss our N-fold way approach to simulated tempering and illustrate it on the example of a Strauss process. The last section discusses the results thus obtained.
2 Point processes and Besag lattice processes
Point processes are models for random pattern of points. They are often de-fined by a density with respect to a Poisson point process on a bounded window W. For simplicity, we assume thatW = [0,1]2, the unit square window. In the following we consider pairwise interaction point processes on W which have the following density with respect to a unit rate Poisson process:
f(x) = αλn(x)Y
i<j
g(||xi−xj||) x⊆W. (1)
Heren(x) is the number of points inxand||·||denotes the Euclidean distance in R2. The parameter λ is positive and α denotes the normalizing constant
of the density. If the interaction function g satisfies 0 ≤ g(d) < 1, then the point process exhibits inhibitory interaction, that is it produces regular point pattern. For example, if the interaction function is given by
g(d) =
γ if d < R
1 otherwise (2)
where 0≤γ <1, then the resulting density
π(x) = αλn(x)γSR(x) (3)
specifies the Strauss process with interaction rangeR [21]. HereSR(x) counts
In [2] the authors show that the distribution of a purely inhibitory pairwise interaction process can be seen as the limit distribution of a sequence of auto-Poisson processes. Suppose we subdivide the sampling window into a regular grid of m equal sized square cells Cr, r = 1, . . . , m. Let ξi be the centroid,
xi the point pattern and nr the number of points in cell Cr. To define the
distribution of an auto-Poisson process we specify the probability of observing the cell counts n= (n1, . . . , nm), where nr is the number of points in cell Cr,
as proportional to
Y
1≤r≤m
(λ/m)nr
nr!
Y
r<s
g(||ξr−ξs||)nrns.
Now, given the point count in each cell we can produce a point pattern on W by generating a binomial process for each cell, that is, the locations of the nr points are independent and uniformly distributed in cell Cr. The resulting
point patternXhas a density with respect to a unit rate Poisson process given by
fm(x) ∝ λn(x)
Y
r<s
g(||ξr−ξs||)nrns. (4)
Now, [2] show that as the cell area 1/m tends to zero we have that fm(x)
tends to the density f(x) defined in (1).
Besag lattice processes such as the auto-Poisson process or the auto-logistic process were originally considered for pseudo-likelihood estimation [2] and also can be derived for marked point processes [11]. They can be simulated easily using a Gibbs sampler as in Section 3.2; for a perfect Gibbs Sampler see [17]. For the Strauss process the auto-Poisson approximation is given by
fm(x) ∝ λn(x)γS
B
R(x) where SB
R(x) =
X
r<s:||ξr−ξs||<R
nrns (5)
In the following we will call this process the Strauss lattice process.
Because within-cell interactions are neglected in the standard auto-Poisson process, its realisations can look very different from the corresponding Markov point process. We propose the use of a modified Besag lattice process where the area of interaction is still determined by the centroids of the cell but within-cell interactions are introduced. We achieve this by defining
hm(x) ∝ λn(x)
Y
r<s
g(||ξr−ξs||)nrns
Y
r
g(0)nr(nr−1)
2
.
Then we still have thathm(x)→f(x) as m→ ∞. For the Strauss process we
function
gm(d) =
γ for d= 0
β for 0< d < R
1 otherwise
leading to the density
hm(x) ∝ λn(x)βS
B
R(x)γ
ni(ni−1)
2 (6)
whereSB
R(x) is defined as in (5). Here 0 < β <1 and 0< γ < 1. Assume that
as m → ∞ the interaction function gm(d) tends to the interaction function
of a Strauss process as defined in (2). Then it can be shown easily that as m → ∞ the density hm(x) → π(x) where π(x) is the density of the Strauss
process defined in (3).
3 Markov chain Monte Carlo algorithms
Sampling of Markov point processes usually requires Markov chain Monte Carlo (MCMC) methods. In the following we give a short review of the most common algorithms.
3.1 Metropolis-Hastings algorithm
The Metropolis-Hastings algorithm developed in [9] is often used for point pro-cesses and, like all Metropolis-Hastings type algorithms, it consists of propos-ing a new state and acceptpropos-ing or rejectpropos-ing the proposal with the appropriate probability. If the state is accepted the chain moves to the proposed state, otherwise the chain remains in its current state. The probability is chosen such that the invariant distribution of the resulting chain coincides with the target distribution.
Suppose the current state of the chain is Xt = x. With probability p(x) the
birth of a pointξ, which is sampled according to a densityb(x,·), is proposed. The birth is accepted with probability min{1, α(x, ξ)} in which case we set Xt =x∪ {ξ}. Alternatively, with probability 1−p(x) a pointη∈xis sampled
according to a probabilityd(x, η) and its death proposed. The death proposal is accepted with probability min{1, α(x\η, η)−1}. The acceptance probabilities are specified by the Metropolis-Hastings ratio
α(x, ξ) = λ(x, ξ) 1−p(x∪ {ξ}) p(x)
where
λ(x, ξ) =
f(x∪{ξ})
f(x) for f(x)>0
0 otherwise
is the Papangelou conditional intensity of the target process with densityf. A common choice is to letb(x, ξ) be the uniform density on the sampling window W. For death proposals a point is chosen at random from the current con-figuration. Note that in pairwise interaction processes with strong inhibitory interaction the Papangelou conditional intensity λ(x, ξ) can be very small in large regions of the sampling window. This leads to a high rejection rate of births if the location of proposed points is sampled uniformly on the sampling window.
For a perfect simulation version of the above algorithm see [15] and for a comparison with birth-death processes see [4,5].
3.2 The Gibbs sampler
To simulate the auto-Poisson process we will use a Gibbs sampler. For a more detailed description of Gibbs sampling see for example [7]. The Gibbs sampler applies to multivariate distributions and samples successive states from full conditional distributions.
Consider the modified Strauss lattice process and let Nr be the cell count
in cell Cr. The conditional probability q(k|n(−r)) of Nr = k given the point
counts n(−r) in all other cells is proportional to
µk r
k! γ
k(k−1)
2 . (7)
Here
µr =
λ m
Y
s∼r
βns
where the product is over all R-close cells of cell Cr and ns is the point count
in cellCs. (CellCsisR-close toCrif||ξr−ξs||< R). Using the full conditional
distributions of cell counts we easily can sample the modified Strauss lattice process using a random-scan Gibbs sampler. Suppose the current state of the chain is Xt =x where x = (x1, . . . , xm) is a point pattern with point counts
n= (n1, . . . , nm). To produce Xt+1 proceed as follows:
(1) Choose at random a cell index r∈ {1, . . . , m}. (2) Samplek with probability q(k|n(−r)).
(3) Sample a Binomial point pattern yr with k points on cell Cr.
4 Improving and accelerating MCMC algorithms
While MCMC is a powerful technique for examining complex probability dis-tributions efficiency can be a bottleneck. Various methods have been developed to improve efficiency and we review the following selection of methods that we will be exploiting in our context:
(1) theN-fold way algorithm, (2) simulated tempering and (3) the Wang-Landau algorithm.
For point processes with strong interaction the standard Metropolis-Hastings algorithm described in Section 3.1 or the Gibbs Sampler in Section 3.2 often experience long waiting times between moves from one state in the state space to another. TheN-fold way algorithm reduces computation time by observing the target Markov chain only at times when there is a change in its state and recording the waiting between such transitions. To implement the algorithm we need to be able to sample these waiting times and transitions efficiently. As we describe in Section 4.1 this be done for the Gibbs sampler chain for the (modified) Besag lattice processes. (In general it is not possible to define an efficientN-fold way algorithm for pairwise interaction processes as it requires a partitioning of the sampling window into regions with constant Papangelou conditional intensity).
In order to exploit the computational saving produced by theN-fold way algo-rithm we use a simulated tempering scheme to combine N-fold way sampling of the modified Besag lattice process with standard Metropolis-Hastings sam-pling for the pairwise interaction process. Simulated tempering is a method that exploits faster mixing Markov chains defined on the same state space to help the slowly mixing target chain escape from local modes. More details are given in Section 4.2. To be able to apply simulated tempering we need to compute ratios of normalizing constants of the relevant invariant distributions. As this cannot be done analytically for our problem numerical approximations have to be found. The Wang-Landau algorithm is a clever way of avoiding such computation by using an adaptive algorithm that determines these quantities during the run-time of the simulated tempering algorithm.
4.1 The N-fold way algorithm
will be very small for a large number of cells. This leads to a large number of empty cells which often are updated to the empty set, thus leading to no change in the state of the chain. This problem can be alleviated by using the N-fold way algorithm [3]. This method is based on the idea of sub-sampling a Markov chain at times when there is a change in the state of the chain. Estimation using the sub-sampled chain is then based on weighted averages where the weighting is according to the lifetime of a state. While this does not change the mixing properties of the chain itself it does reduce the computing time needed to produce a sample of a fixed size.
In more detail, the N-fold way algorithm on a discrete state space works as follows. Firstly, given the current stateXt=xof the chain the probabilityp(x)
of a transition in the next time step to a state different from xis determined. Let Lx be a Geometrically distributed random variable with parameter p(x)
which we call the lifetime of state x. We set Xt+k = x for k < Lx and then
sample Xt+Lx from its conditional distribution given that Xt+Lx 6= x and
Xt+Lx−1 =x.
For the modified Strauss lattice process an N-fold way algorithm can be de-rived as follows. CellCris picked for updating with probability 1/m. A change
in the point pattern xr in cell Cr always occurs unless the cell is empty and
updated to the empty configuration. Assume cellCr is empty, then the
proba-bility of the cell being updated to an empty configuration is given byq(0|n(−r))
as defined in (7). Thus given the current state Xt=xthe probability p(x) of
a transition to a point pattern different to xat time t+ 1 is equal to
p(x) = 1− 1
m
X
r:xr=∅
q(0|n(−r)).
Hence state x is given a lifetime Lx which is Geometrically distributed with
parameter p(x). The state Xt+Lx is now produced as follows.
(1) Pick cell Cr with probability
1 p(x)
1
m 1[xr6=∅]+
1−q(0|n(−r))
m 1[xr=∅]
.
(2) (a) If cell Cr is not empty then sample k with probability q(k|n(−r)). (b) If cell Cr is empty then sample k >0 with probability
q(k|n(−r))/(1−q(0|n(−r))).
(3) Replace the point patternxr inCr by a Binomial point pattern yr onCr
consisting of k points.
of the estimator can be reduced by using a Rao-Blackwell approach [4]. Let x1, . . . , xnbe the states sampled by theN-fold way algorithm andLx1, . . . , Lxn
the corresponding observed lifetimes. To estimate Eπ(f(X)) we can use the
standard ergodic average which is equivalent to the lifetime weighted average
¯
f1 = Pn1
t=1Lxt
n
X
t=1
f(xt)Lxt
A Rao-Blackwell-type estimate can be produced by replacing the observed lifetimes Lxt by their expectation 1/p(xt) and so the following estimator has
smaller asymptotic variance than ¯f1:
¯ f2 =
1
Pn
t=11/p(xt) n
X
t=1
f(xt)/p(xt).
4.2 Simulated tempering
Simulated tempering [10,19] is an MCMC approach that aims at improving mixing of the target MCMC sampler by exploiting faster mixing samplers with stationary distribution different to the target distribution.
Letπ1(x) =π(x) be the unnormalized target density and let π2(x), . . . , πM(x)
be a set of unnormalized auxiliary densities. Generally πi is in some sense
“flatter” thanπi+1 and so an MCMC sampler with stationary density πi tends
to explore the state space better. For example, we might choose
πi(x) =
π(x)
1+λ1(i −1)
, i= 1, . . . , M; λ >0.
In this paper we will explore a sequence of auxiliary distributions that are based on a coarser auto-Poisson approximation to the target distribution.
Simulated tempering samples a chain (X, I)t≥0 with stationary distribution
π(x, i) ∝ ciπi(x), i∈ {1, . . . , M}
and inference on π(x) can be done by simply retaining values (x, i) where i = 1. Let the current state of the chain be (Xt, It) = (x, i). One iteration
of simulated tempering consists of an update of Xt according to the sampler
with stationary distribution πi followed by an update of the index It. In the
following we call It the level. To perform an update of It = i we propose a
new index j with user-defined probabilityqij. The proposed index is accepted
with probability
α(x, i, j) = min
1,cjπj(x)qji ciπi(x)qij
The constants ci, i = 1, . . . , M, are chosen such that the chain divides its
time roughly equally among the M levels. This is ensured if ci is equal to
the normalizing constant ofπi. As these normalizing constants usually are not
available approximations need to be found before the simulated tempering scheme is run. A common method used is reverse logistic regression, see [8].
Successive auxiliary densitiesπi andπi+1should be sufficiently similar to allow the simulated tempering chain to move from one level to another. On the other hand πM should be sufficiently different from π so that the corresponding
chain is fast mixing. Literature suggests a spacing that leads to an average acceptance rate for moves between neighbouring levels of about 20% to 40%.
4.3 The Wang-Landau algorithm
The Wang-Landau algorithm [22,1] is an adaptive MCMC approach based on a sequence of stochastic approximations of the target density π(x) by mixture distributions of the form
πn(x) = M
X
i=1 π(x) θn(i)
1[x∈Si], n ∈N, (9)
where 1 denotes the indicator function. Here S1, . . .SM, is a disjoint
parti-tion of the state space S of π which is chosen such that the mass R
Siπ(x)dx
is roughly equal for all i ∈ {1, . . . , M}. The random sequences θn(i), i ∈ {1, . . . , M}, forn ∈N are defined as
θn(i) = Φn(i)/ M
X
j=1
Φn(j) where (10)
Φn(i) = Φn−1(i)(1 +γn−11[Xn∈Si]) and (11)
Φ0(i) is set to some user-defined value. (12)
Here (γn)n∈N is a positive, non-increasing sequence that we define later and
X = (Xn)n∈N is a controlled Markov chain with limit distribution π. This
controlled Markov chain is evolved as follows. LetPn(x,·) be a transition kernel
with stationary distribution πn(x) as defined in (9). Given the current state
Xn =xwe sampleXn+1fromPn(x,·) and then updateθn(i) fori∈ {1, . . . , M}
as defined in equations (10)-(12). Note that Φn(i) may be interpreted as an
occupation measure ofSi. Recall that the partition ofS is chosen such that in
equilibrium each partition set has equal mass and so asymptotically the chain will spend equal time in each partition set. As the occupation measure Φn(i)
increases the mixture distribution πn and thus the stationary distribution of
To ensure that the controlled Markov chain has the correct asymptotic distri-bution π the sequence (γn)n∈N needs to converge to zero. It should converge
slowly enough to avoid the algorithm becoming stuck but not too slowly as the rate of convergence of the controlled Markov chain X depends on the rate of convergence of (γn)n∈N towards zero. A major contribution of the
Wang-Landau algorithm is a method of adaptively decreasing γn according to the
following mechanism. At random times ˜τ1 <τ˜2 < . . . we set
γ˜τk+1 = (1 +γ0)
1 2k −1
for some initial value 1< γ0+ 1< e. Between these random times γn remains
constant, that is
γn = γ˜τk+1 for ˜τk < n≤τ˜k+1.
The random times ˜τnare chosen to be times at which the occupation measures
Φ(n) become approximately equal. Wang and Landau [22] suggest to measure this as follows. Equal occupation measures are assumed if
min
i=1,...,Mθn(i) ≥ c
1 M
M
X
j=1 θn(j)
wherecis some constant close to one, say 0.8. Atchade and Liu [1] recommend to use times τn = min{a,˜τn}for some large integer a such that nλγn ≤K for
constantsK <∞andλ > 12. This is to ensure that the time-varying transition kernels Pn stabilize and thus the algorithm converges.
The Wang-Landau algorithm can also be applied to simulated tempering [1]. Here the partition ofS =∪M
i=1{i}×X is given bySi ={i}×X,i∈ {1, . . . , M}.
Suppose the current state of the chain is (Xt, It) = (x, i). A proposal to update
the level It to state j then has acceptance probability
αn(x, i, j) = min
1,Φn(j)πj(x)qji Φn(i)πi(x)qij
.
In this case we haveθn(i)→1/ci asn → ∞and thus the Wang-Landau
algo-rithm avoids the need to compute approximations to the normalizing constants prior to running the simulated tempering algorithm.
For illustration we describe below a Wang-Landau simulated tempering scheme for the Strauss process with density
π1(x) = λn(x)
1 γ
SR(x)
1 .
The auxiliary densities are Strauss processes with weaker interaction, that is
πi(x) = λ n(x)
i γ
SR(x)
where λ1 > λ2 >· · ·> λM and γ1 < γ2 <· · ·γM. The interaction radius R is
equal for allM densities.
Suppose the current state of the Wang-Landau simulated tempering chain is (Xt, It) = (x, i), then we sample (Xt+1, It+1) as follows:
(1) With probability 1/2 propose a birth. Alternatively, propose a death. (a) If we propose a birth we sample a point ξ uniformly on W. With
probability
min
1, γSR(x∪{ξ})−SR(x)
i
λi
(n(x) + 1)
we set Xt+1 =x∪ {ξ}. Alternatively, we set Xt+1 =x.
(b) If we propose a death and x=∅ we set Xt+1 =∅. If Xt6=∅ then we
sample at random a point ξ ∈x. With probability
min
1, γSR(x\{ξ})−SR(x)
i
n(x) λi
we set Xt+1 =x\{ξ}. Alternatively, we set Xt+1 =x.
(2) With probability 1/2 we samplej = min{i+ 1, M}. Alternatively we set j = max{i−1,1}. Then with probability
min
1, Φt(j)λ
n(x)
j γ SR(x)
j
Φt(i)λ n(x)
i γ SR(x)
i
.
we set It+1 =j. Alternatively, we set It+1 =i.
(3) Finally, fork ∈ {1, . . . , M}we update Φt(k) to Φt+1(k) as defined in (11).
5 N-fold way simulated tempering for the Strauss process
5.1 Simulated tempering using lattice processes
will update the locations of several points at once. However, more auxiliary densities will lead to the target chain being visited less often. Furthermore, while chains whose equilibrium distribution is defined on a coarser grid will tend to mix better, the computational advantages of using the N-fold way is lost as the expected waiting time in a state becomes shorter. We found it computationally more efficient to consider only one auxiliary density and use it to exploit the advantages of theN-fold way algorithm.
As an example we consider as target density the (unnormalized) densityπ1 of the Strauss process:
π1(x) = λn(x)γsR(x).
Nowπ2 is the unnormalized density of a modified Strauss lattice process, that is
π2(x) = λn(x)βS
B
R(x)Y
r
γnr(nr−1)
2 .
In our experiments we chose the parameters of the modified Strauss lattice process such that the number of cells m was as small as possible but still produced a sufficiently high average acceptance rate for moves between levels.
5.2 Wang-Landau simulated tempering, the N-fold way
For the modified Strauss lattice model on a fine grid we observe slow mixing of the corresponding Gibbs Sampler when the inhibitory interaction is very strong. Thus we will use the N-fold way algorithm to save computing time. We described the standard N-fold way algorithm to sample a modified auto-Poisson process in Section 4.1. We now augment this algorithm for the Wang-Landau simulated tempering approach described in Section 4.3.
Recall that the simulated tempering scheme produces a chain (X, I)t≥0 with two components: (X)t≥0 which describes the current point pattern and (I)t≥0 which describes the level. An iteration within the simulated algorithm scheme then consist of an update of the point pattern followed by an update of the level. In the Wang-Landau approach to simulated tempering the transition kernels for updates of the level change with time. This may be taken account of by sampling the lifetimeLt
x,i of the state (x, i) entered by the chain at time
t not from a Geometric distribution but from the probability mass function given by
P(Lt
x,i=k) =
k−2
Y
j=0
1−pt+j(x, i)
pt+k−1(x, i). (13)
Here
pt(x, i) = 1−P
(Xt, It) = (x, i)
(Xt−1, It−1) = (
x, i)
and can be computed as follows. We have Xt=Xt−1 if at time t−1 we pick an empty cell and update it to an empty cell. Given (Xt−1, It−1) = (x, i) this
occurs with probability
q(x, i) = 1 m
X
r:xr=∅
qi(0|n(−r)).
Hereqi(k|n(−r)) is the conditional probability mass function of the number of
points in cellCr given the point counts n(−r) in all other cells for the modified Strauss lattice process with density πi(x).
Next, we derive the probability of It = It−1 given that Xt = Xt−1 and (Xt−1, It−1) = (x, i). Recall that qij is the probability of proposing to move
from levelito levelj. Also recall that the probability of accepting the proposal j at timet givenXt=x and It−1 =i is given by
αt(x, i, j) = min
1,Φt(j)πj(x)qji Φt(i)πi(x)qij
.
Then
1−pt(x, i) =P
(Xt, It) = (x, i)
(Xt−1, It−1) = (x, i)
=q(x, i)
qi,i−1[1−αt(x, i, i−1)] +qi,i+1[1−αt(x, i, i+ 1)]
This defines the distribution of the lifetime Lt
x,i.
We now describe the Wang-Landau simulated tempering scheme with one auxiliary density, although the algorithm can easily be extended to a scheme with more than one auxiliary density. Recall that
π1(x) = λn(x)
1 γ
sR(x)
1
and
π2(x) = λn(x)
2 β
SB
R(x)
2
Y
r
γnr
(nr−1)
2
2 .
As mentioned earlier, N-fold way simulation is only feasible for the Markov chain with invariant densityπ2. We augment the state space of the simulated tempering chain by an additional variable that keeps track of the lifetimes. Choose a starting value (X0, I0, Z0) = (x0,1,1) for the chain and set Φ0(1) = Φ0(2) = 1. Suppose the current state of the chain is (Xt, It, Zt) = (x, i, z). We
then proceed as follows:
(1) Ifi= 1 then perform the following steps:
(i) If we propose a birth we sample a pointξuniformly onW. With probability
min
1, γSR(x∪{ξ})−SR(x)
1
λ1 (n(x) + 1)
we set Xt+1 =x∪ {ξ}. Alternatively, we set Xt+1 =x.
(ii) If we propose a death and x = ∅ we set Xt+1 = ∅. If Xt 6= ∅
then we sample at randomξ ∈x. With probability
min
1, γSR(x\{ξ})−SR(x)
1
n(x) λ1
we set Xt+1 =x\{ξ}. Alternatively, setXt+1 =x. (b) With probability
min
1,Φt(2)λ
n(x)
2 β
SB
R(x)
2
Q
rγ
nr(nr−1)
2
2 Φt(1)λ
n(x)
1 γ
SR(x)
1
.
we set It+1 = 2. Alternatively, set It+1 = 1.
(c) For k∈ {1,2} update Φt(k) to Φt+1(k) as defined in (11).
(d) If It+1 = 1 set Zt+1 = t+ 1. Alternatively, if It+1 = 2, sample the lifetime Lt+1
x,2 =Laccording to the probability mass function defined in (13) and set Zt+1 =t+L.
(2) Ifi= 2 then perform the following steps:
(a) If Zt > t set (Xt+1, It+1, Zt+1) = (Xt, It, Zt). For k ∈ {1,2} update
Φt(k) to Φt+1(k) as defined in (11).
(b) If Zt=t then proceed as follows:
(i) With probabilityq(x, i) set Xt+L=x. Alternatively set Xt+L=
y wherey6=xis sampled as follows. Choose cell Cr with
prob-ability
1 1−q(x, i)
1
m1[xr6=∅]+
1−qi(0|n(−r))
m 1[xr=∅]
.
If cell Cr is not empty sample k with probability qi(k|n(−r)). If
cell Cr is empty sample k >0 with probability
qi(k|n(−r))/(1−qi(0|n(−r)).
Then y is the point pattern produced by replacing in x the pattern xr with a Binomial pattern on cell Cr with k points.
(ii) If Xt+1 =x then set It+1 = 2 with probability
αt(x,2,2)
and It+1 = 1 otherwise. If Xt+1 = y 6= x then perform a standard update of the level. Set It+1 = 1 with probability 0.5αt(y,2,1) and setIt+1 = 2 otherwise.
(iii) If It+1 = 1 set Zt+1 = t+ 1. If If It+1 = 2 sample the lifetime Lt+1
x,2 =L according to the probability mass function defined in (13) and setZt+1 =t+L. Fork ∈ {1,2}update Φt(k) to Φt+1(k)
as defined in (11).
6 Experimental Results
6.1 Assessing performance
The standard approach to assess the performance is to examine the auto-correlation function of a summary statistic of the point pattern. Commonly used summary statistics are the number of points, the number of neighbour pairs and the average first coordinate of the points. We additionally propose to use a summary statistic more specific to spatial point pattern: the multivariate K-function [6]. Given two point patternsxandy, the multivariate K-function essentially looks at the number of points in pattern xthat lie close to a point in y. More formally, the multivariate K-function of a point process X and a point process Y is given by
λYKX,Y(r) =E(number of points in Y within distance r
of an arbitrary point inX) = λXKY,X(r),
where λX and λY are the intensity of X and Y respectively. An estimate of
the K-function can be computed as follows:
K(r, x, y) = |W| n(x)n(y)
X
xi∈x
X
yj∈y
1[||xi−yj||≤r].
We use periodical boundary conditions to account for edge effects. If xand y are independent thenK(r, x, y) =πr2. To stabilize the variance, it is common to consider the so-called L-function which is defined as
L(r, x, y) = qK(r, x, y)/π−r
Under the hypothesis of independence L-function is constant zero. Thus to measure the dependence between successive point configurations sampled by our MCMC algorithm we compute
ˆ
L(τ, r) = 1
N−τ
n−τ
X
k=1
wherextis the observed state of the Markov chain at time n. We expect these
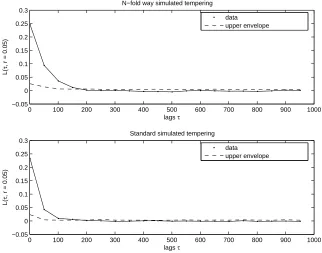
estimates to decay to zero asτ increases subject to sampling fluctuations. To decide when theL-function has converged to zero we calculate an upper con-fidence envelope.. The envelope is obtained by randomly translating the first point patternxk and estimating theL-function for the translated pattern and
xk+τ. This procedure is repeated independently 99 times. The 100(1-α)%
con-fidence upper envelope is then given by the pointwise 100(1−α)th percentile of the 99 L-function estimates. For more information on using confidence en-velopes and related Monte Carlo tests, see [6].
6.2 Example: A Strauss process
In the following we consider the Strauss process as an example case. However, our methods apply to any Markov point process that can be approximated by an auto-Poisson or auto-logistic lattice process. We examine sampling from a Strauss process on the window W = [0,2.5]2 with parameters
λ= 1000, γ = 10−5, and R = 0.45.
This is a process with very strong inhibitory interaction which is difficult to sample and so a good test case for our method. The average number of points for this process is about 20 and Figure 1 shows a sample.
As discussed earlier we use one auxiliary densityπ2(x) which describes a mod-ified Strauss lattice process. The parameter of the auxiliary density are chosen as follows:
m = 322, λ= 1000 β = 10−5 γ = 10−5 R = 0.45.
These parameters lead to an average acceptance rate of 2% for moves between levels. This is lower than the values recommended in the literature and us-ing a finer grid would increase the average acceptance rate. However, a finer grid makes the sampling process computationally more expensive. More im-portantly it produces a Markov chain that is slower mixing as it effectively updates smaller region in the sampling space. In simulation experiments we found that using a finer grid produced little improvement in terms of mixing at a significantly higher computational expense.
λ2= 600 γ2 = 0.002 R2 = 0.45, λ3= 380 γ3 = 0.0066 R3 = 0.45, λ4= 315 γ4 = 0.02 R4 = 0.45, λ5= 210 γ5 = 0.05 R5 = 0.45, λ6= 65 γ6 = 0.1 R6 = 0.45, λ7= 30 γ7 = 0.22 R7 = 0.45, λ8= 12.5 γ8 = 0.45 R8 = 0.45, λ9= 7.2 γ9 = 0.66 R9 = 0.45, λ10= 3.35 γ10= 1 R10= 0.45,
The above parameters were chosen such that the average acceptance rate of moves between levels lie between 20% and 40%. The hottest chain (sampling the Strauss process with the weakest interaction) is in fact a Poisson process which can be sampled directly.
6.3 Results and Discussion
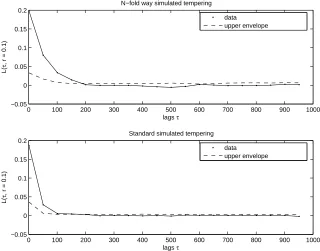
Both simulated tempering schemes were run for 5×10⁶ iterations. Then the cold chain was subsampled to yield a timeseries of length 104. Figure 2 shows the auto-correlation function of the number of points in the sub-sampled cold chain for both the N-fold way simulated tempering scheme and the standard simulated tempering algorithm. Figures 3 and 4 show theL-function for both schemes for length scales r = 0.05 and r= 0.1 respectively.
First note that the auto-correlation function of the number of points suggests negligible auto-correlation at smaller lags than the L-functions. This provides evidence to the fact that a high -level summary statistic like the number of points is unlikely to provide an adequate description of the auto-correlation of the chain. Similary, we found the number of neighbour pairs not a useful summary statistic as our target distribution has such strong repulsoin that neighbour pairs hardly occur. Thus we would recommend the use of the L-function which is specifically designed to detect ”correlation” between point patterns.
+ +
+ +
+
+
+ +
+
+ +
+
+ +
+ +
+ +
+ +
0.5 1.0 1.5 2.0 2.5
0.5
1.0
1.5
2.0
[image:19.595.205.374.85.243.2]2.5
Fig. 1. A sample of a Strauss process on the window [0,2.5]2 with parameters λ= 1000, γ= 10−5 and R= 0.45.
The fact that the L-function takes longer to decay to zero is probably due to the gridsize. In our scheme the grid has square cells of sidelength 0.78125. Therefore the neighbour count SB
R(x) of a point pattern xdoes not change if
a pointξ ∈xchanges its location within the same cell.
We restricted our simulation experiments to simulated tempering and did not exploit a parallel computing based implementation. The fact that the N-fold way scheme relies on a smaller number of chains will be less of an advantage if using parallel tempering implemented on multiple processing units.
Finally, we considered a Strauss process whose interaction functiong is a step function. The interaction in a (modified) Besag lattice process is based on cell centres. For the (modified) Strauss lattice process this leads to existence of point patterns x such that SR(x) = 0 but SRB(x) > 0 and vice versa. This,
in turn, leads to an increased rejection rate when moving from one level to another. We would expect this problem to be less pronounced for a smooth interaction function, thus leading to a better mixing N-fold way simulated tempering algorithm.
References
[1] Y.P. Atchade and J. Liu. The Wang-Landau algorithm for Monte Carlo computation in general state spaces. Technical Report, 2004.
[2] J. Besag, R. Milne and S. Zachary. Point process Limits of lattice processes. Journal of Applied Probability, 19:210-216,1982.
0 100 200 300 400 500 600 700 800 900 1000 −0.2
0 0.2 0.4 0.6 0.8
N−fold way simulated tempering
ACF of number of points
0 100 200 300 400 500 600 700 800 900 1000
−0.2 0 0.2 0.4 0.6 0.8 1 1.2
ACF of number of points
Standard simulated tempering
data envelopes
[image:20.595.127.450.83.336.2]data envelopes
Fig. 2. The auto-correlation function for the number of points for the two simulated tempering schemes.
0 100 200 300 400 500 600 700 800 900 1000
−0.05 0 0.05 0.1 0.15 0.2 0.25 0.3
lags τ
L(
τ
, r = 0.05)
N−fold way simulated tempering
data upper envelope
0 100 200 300 400 500 600 700 800 900 1000
−0.05 0 0.05 0.1 0.15 0.2 0.25 0.3
lags τ
L(
τ
, r = 0.05)
Standard simulated tempering
data upper envelope
[image:20.595.128.450.407.660.2]0 100 200 300 400 500 600 700 800 900 1000 −0.05
0 0.05 0.1 0.15 0.2
lags τ
L(
τ
, r = 0.1)
N−fold way simulated tempering
data upper envelope
0 100 200 300 400 500 600 700 800 900 1000
−0.05 0 0.05 0.1 0.15 0.2
lags τ
L(
τ
, r = 0.1)
Standard simulated tempering
[image:21.595.129.449.76.327.2]data upper envelope
Fig. 4. TheL-function at length scaler = 0.1 for both simulated tempering schemes. The dashed line is the 99%-confidence envelope.
simulation of Ising spin systems. Journal of Computational Physics, 17:10–18, 1975.
[4] O. Capp´e, C.P. Robert and T. Ryd´en. Reversible jump MCMC converging to birth-and-death MCMC and more general continuous time samplers. Journal of the Royal Statistical Society, Series B,65:679-700, 2002.
[5] P. Clifford and G. Nicholls. Comparison of birth-and-death and Metropolis-Hastings Markov chain Monte Carlo for the Strauss process. Department of Statistics, Oxford University. Manuscript, 1994.
[6] P.J. Diggle. Statistical Analysis of Spatial Point Patterns. Academic Press. New York, 1983.
[7] A.E. Gelfand and A.F.M. Smith. Sampling based approaches to calculating marginal densities. Journal of the American Statistical Association, 85:398– 409. 1990.
[8] C. Geyer. Markov chain Monte Carlo maximum likelihood. In P. Keramidas, editor, Computer Science and Statistics, Proceedings of the 23rd Interface, 156-163. Interface Foundation, Fairfax Station, 1991.
[10] C.J. Geyer and E.A. Thompson. Annealing Markov Chain Monte Carlo with applications to ancestral inference. Journal of the American Statistical Association, 90:909-920.1995.
[11] M. Goulard, P. Grabarnik and A. S¨arkk¨a. Parameter estimation for marked Gibbs point processes through the pseudo-likelihood method. Scandinavian Journal of Statistics, 23:365–379,1996.
[12] D. Higdon, H. Lee and Z. Bi. A Bayesian approach to characterizing uncertainty in inverse problems using coarse and fine scale information. IEEE Transactions on Signal Processing, 50:389-399, 2002.
[13] M.A. Hurn and C. Jennison. A study of simulated annealing and a revised cascade algorithm for image reconstruction. Statistics and Computing. 5:175-190, 1995.
[14] D. Kandel, E. Domany and A. Brandt, Simulations without critical slowing down: Ising and three-state Potts models. Physical Review, Series B. 40: 330-344, 1989.
[15] W. S. Kendall and J. Møller. Perfect simulation using dominating processes on ordered spaces, with application to locally stable point processes. Advances in Applied Probability, 32: 844-865, 2000.
[16] W.S. Kendall and R.G. Wilson. Ising models and multi-resolution quad trees. Advances in Applied Probability. 35: 96-122, 2003.
[17] M.N.M. van Lieshout and R.S. Stoica. Perfect simulation for marked point processes. To appear in Computational Statistics and Data Analysis, 2006.
[18] J. Liu and C. Sabatti. Generalized Gibbs Sampler and Multigrid Monte Carlo for Bayesian Computation. Biometrika, 87:353-369, 2000.
[19] E. Marinari and G. Parisi. Simulated tempering: a new Monte Carlo scheme. Europhysics Letters, 19: 451-458, 1992.
[20] A. Sokal. Monte Carlo Methods in Statistical Mechanics: Foundations and New Algorithms. Cours de Troisieme Cycle de la Physique en Suisse Romande. 1989
[21] D.J. Strauss. A model for clustering. Biometrika, 63:467-475, 1975.
![Fig. 1. A sample of a Strauss process on the window [0, 2.5]2 with parametersλ = 1000, γ = 10−5 and R = 0.45.](https://thumb-us.123doks.com/thumbv2/123dok_us/9771439.478161/19.595.205.374.85.243/fig-sample-strauss-process-window-parametersl-g-r.webp)