University of Warwick institutional repository: http://go.warwick.ac.uk/wrap
This paper is made available online in accordance with publisher policies. Please scroll down to view the document itself. Please refer to the repository record for this item and our policy information available from the repository home page for further information.
To see the final version of this paper please visit the publisher’s website. Access to the published version may require a subscription.
Author(s):Monica Giulietti, Luigi Grossi and Michael Waterson Article Title: Price transmission in the UK electricity market: was NETA beneficial?
Year of publication: 2009 Link to published article:
http://www2.warwick.ac.uk/fac/soc/economics/research/papers_2009/t werp_913.pdf
Price transmission in the UK electricity market:
was NETA beneficial?
Monica Giulietti, Luigi Grossi and Michael Waterson
No 913
WARWICK ECONOMIC RESEARCH PAPERS
Price transmission in the UK electricity market: was NETA
beneficial?
Monica Giulietti (Nottingham University Business School), Luigi Grossi (University of Verona) and Michael Waterson (University of Warwick)
September 2009 Please do not quote
Abstract
This paper explores the relationship between domestic retail electricity prices in Great Britain and their determinants in the particular context of the New Electricity Trading Arrangements (NETA) introduced in 2001. The analysis requires a consistent comparison of wholesale power price series before and after NETA, which we investigate using a range of wholesale future price series. Despite its stated intention of reducing prices, we conclude that the net effect of NETA alongside other developments instead merely rearranged where money was made in the system.
Keywords: Electricity generation, electricity supply, retail pricing, futures markets, energy market competition
JEL numbers: L94, L51,
Price transmission in the British electricity market: was NETA
beneficial?
1. Introduction
The purpose of our paper is to explore the relationship between domestic retail electricity prices in Great Britain and their various determinants, focussing on the effect of the New Electricity Trading Arrangements (NETA). In the British electricity industry, the mantra “competition where possible, regulation where not” (Littlechild, 2005) has led to an evolution of processes to inject competition into electricity generation and supply, through introducing, encouraging and then reforming markets in these areas; the recent series of reforms relating to NETA started in 2001. These arrangements were instituted with the aim of reducing average prices paid to generators by suppliers, hence leading to cheaper electricity prices for consumers. In this context, we explore the relationship between domestic retail electricity prices in Great Britain and wholesale prices for fuel over the period during which this batch of reforms has been instituted. Ultimately, the test of a change in arrangements must be whether the impact on final consumers is positive or not. In this analysis we exploit structural differences between the electricity and gas wholesale markets and in particular between institutional regimes in England and Wales as against Scotland.
Since the early 1990s, the British electricity market has changed out of all recognition. The first major steps involved vertical disintegration and the introduction of competition in generation, together with a Pool mechanism for coordinating generation and supply. This period has been well studied, with key papers on the British experience including Green and Newbery (1992) and Wolfram (1998) and, as Sweeting (2007) points out, competition in generation has been enhanced in the sense that the Herfindahl- Hirschman index in generation has been falling through divestiture, although he finds that the generators were nevertheless able to exercise considerable market power.
network operator, based upon matching predicted demand with bids from generators. This system received criticism, for example that it was subject to manipulation by generators, was insufficiently cost-reflective and that it did not contain demand revelation elements (OFGEM, 2002). As a result, replacement arrangements known as the New Electricity Trading Arrangements (NETA) were instituted in March 2001. These applied to England and Wales only, whilst Scotland then had a more vertically integrated structure. However, a revision to incorporate the two Scottish operators, known as BETTA, was developed and became live in April 2005. The operating scheme under NETA and BETTA involves bilateral wholesale trades together with a small balancing market. It is this little-studied period following the introduction of competition in supply and the replacement of the Pool by NETA, which is the focus of the present paper.1
The major unregulated determinant of retail prices is wholesale electricity costs, although clearly there are other costs involved. Neither generation nor supply is regulated in Great Britain and the major operators are active at both these levels, so we explore the links between wholesale input prices (gas and coal) into electricity generation as well as links between retail and wholesale prices for power. The method by which wholesale and retail prices can be reconciled is by no means obvious. Although the early period of deregulation coincided with generally falling retail prices, more recently there have been concerns that the reasons underlying price rises are somewhat opaque. Hence the analysis is not simply a statistical exploration with some economic interpretation- deregulatory strategies are being pursued worldwide in the electricity industry and there is a live policy interest that has at least a European dimension. Through NETA and BETTA the UK has chosen a particular deregulatory path that other countries may choose to follow.
Another important feature of the GB market compared to other large economies is the domination of the retail market by integrated players. The number of firms active in residential power supply has now effectively been reduced to six, who together
1
control over 99% of domestic consumer supply.2 Each of these competes in the 14 regions of the electricity industry. They are British Gas, E.On (formerly Powergen), npower (RWE), EdF, Scottish Power (Iberdrola) and Scottish and Southern.
The third important feature to note is that each company is to a significant, and growing, extent vertically integrated across both generation and supply, principally in gas and coal fired production.3 The major sources of input fuels for power generation in the UK are gas, coal and nuclear energy. E.On and npower are the descendents of the old coal generating companies, British Gas is obviously the owner of a major input (and operates several power stations), EdF is a supplier to the market through the interconnector with France and its own power stations, and early in 2009 took over British Energy, the formerly independent generator based on a fleet of nuclear power stations. In addition the two Scottish firms have both retained a generation wing. The drive to vertically integrate back into generation started around 1998 and has continued for several years. In addition to the vertically integrated firms, there are non-integrated generators, including Drax and International Power. Certain of the supply companies have interests in electricity distribution as well, but these activities are subject to separation and regulatory arrangements and can be viewed as separate.
At the same time, the experiment of introducing NETA cannot be considered as “clean”.4
Since one of the main tasks of suppliers in the market is, in effect, to absorb risk, the drive towards vertical integration across generation and supply and a simultaneous squeeze of independent supply companies may well in part have been a result of the NETA arrangements, or indeed the knowledge that NETA was to happen. Moreover, the process of deregulating competition in supply was still under way in the relevant period. At the wholesale level we tackle this range of effects through a form of difference-in-differences analysis looking before and after NETA‟s introduction. The controls are (i) the situation in Scotland, where unlike England and Wales, an unchanging wholesale regime was in operation until 2005, spanning the
2
We do not examine the industrial power market, where retail as well as wholesale prices are negotiated so that we do not have access to retail price series. Nor do we consider Northern Ireland.
3 Of course, in many other countries there have been trends towards vertical reintegration (Meade and
O‟Connor, 2009).
4
introduction of NETA, and (ii) the wholesale market in gas, which had an unchanging regulatory structure over our entire period. In addition, at the retail level we are able to distinguish between effects on customers of non-incumbents (an unregulated market) versus those of incumbents.
Our analysis is very different in focus from the existing literature in many respects. First, the period- our focus is the period of transition between Pool and NETA during which competition in supply was operative. Second, unlike Bushnell et al, we do not attempt to assess the impact of vertical integration, by itself, on wholesale prices. Wholesale prices might be an appropriate focus if the supply activity was regulated but in the UK (since 1999 in large part, since 2002 in total) it is not.5 We are interested in retail prices and their determinants. Since 1999 retail consumers have all been free to choose their supplier and large numbers have switched. However, until 2001 the tariffs of incumbent suppliers were regulated (at prices generally in excess of entrant offers), at which point incumbent direct debit customers‟ tariffs were freed from regulation. Since 2002, all regulation of domestic consumer tariffs has been removed.
Because vertical integration arose over the same time period as NETA was being discussed and implemented, there are clear difficulties in disentangling the separate effects. However, what we can certainly do is examine whether, in the period over which competition in supply has been in place, the combined impact of NETA and vertical integration has been beneficial on average or not, to final consumers, and our regression analysis does speak to the individual effects. NETA (and also BETTA subsequently) was “sold” by the regulator on the basis that it would improve the operation of the wholesale market and, less obviously, that the market as a whole would be more competitive. Was it the hoped-for success?
We examine this by making comparison between the (relevant dates within the) two years 1999-2001 in which there was competition in supply (for all non-incumbent customers) but there was a wholesale pool and the period of four years 2001-2005 in which NETA operated, but the picture in Scotland remained unchanged. Extending
5 The UK is not of course unique in this respect. See for example Gans and Wolak‟s (2008) analysis of
this to the period after BETTA was introduced would be somewhat more problematic, although terminating in 2005 misses out very significant price hikes. One reason is that there is then no clear end-point, and the empirical pattern of retail and wholesale prices suggests that choosing an end point may have a significant influence on the results.6 A second reason is that, over time but particularly since 2005, a much greater range of retail tariff arrangements has been in place, so that using the standard retail data series is less representative, in particular, of prices the marginal switching consumer will face.
To preview findings, it is clear that NETA succeeded in its primary aim, of reducing margins at the wholesale level, i.e. generation margins. However this did not lead to lower retail prices. Indeed, whilst wholesale margins fell significantly, retail margins rose, we suggest as a side-effect of the introduction of NETA and the forces this unleashed. As a result, the overall impact of market restructuring seems to have been no reduction in retail prices compared with underlying costs, if anything the opposite. As we say in the conclusion, the policy implications are potentially very significant.
In this paper, after describing the data sources in section 2, we consider an appropriate theoretical framework for the analysis (section 3), outline our empirical strategy (section 4), analyse margins at various levels using various cuts of the data (section 5) and then conclude (section 6). A few more technical aspects of the relationships between various wholesale costs are relegated to the Appendix.
2. Data sources
We have access to four major data sources that facilitate this analysis. First, we have a set of time series for domestic retail prices for electricity, collected as current prices from the relevant website (most recently, energywatch, the consumer watchdog disbanded in 2008). For present purposes, we have these data for the period April 1999 to March 2007 inclusive; the data have been collected bi-monthly for the three major bill types across three levels of consumption and the fourteen regions across
6 Margins exhibit significantly more variance after 2005, meaning that an artificial (rather than logical)
which prices differ.7 Second, we have a set of proprietary wholesale data for the period from April 1999 or April 2001 (dependent on series) to March 2007 supplied by Platts, one of the three major energy data information companies. This comprises time series on short-dated forward prices for power, natural gas, gas oil, heavy fuel oil, and coal. The power (electricity) price data is at daily frequency (7-day), whilst the gas, gas oil and heavy fuel oil (hereafter “fuel”) prices were on a working day basis8 and coal appears to be priced weekly (commonly observed on a Monday). Alongside this short-dated data, we also have Platts‟ assessments for week, month, 2-seasons and year –ahead future delivery, for both electricity and gas. Third, in addition we have a series of day averages of spot market settlement prices for baseload power from the UK Power Exchange (UKPX) covering the period from February 1999 to April 2007 (published initially by the Pool as system marginal prices, now by Spectron). Finally, we have distribution costs data for each of the 14 regions (from BERR, formerly DTI, and from April 2006 from the Energy Networks Association) over the entire period, also what limited information is published on suppliers‟ market shares, at the national level for all companies and at the regional level for incumbents (from OFGEM, the regulator), plus some additional institutional information.
3. Theoretical framework for analysis
Our ultimate aims are to examine the behaviour of the whole margin between retail electricity prices and underlying wholesale prices and to make margin comparisons between the market situation post supply competition but prior to NETA with the situation post NETA. Because of the manifold changes taking place in the market, we decide against employing a structural approach to modelling in favour of a difference-in-differences method. A further clear difficulty is that the Pool system involved a single market price whereas the NETA system has no such price, the settlement market being a very small proportion of the total transacted. Indeed once NETA was
7
Distribution costs differ across regions. This means suppliers can, and do, differentiate supply prices across regions to various extents. It should be noted that in the very recent past it has become more common for consumers to be offered “special deals” (such dual fuel deals, internet only tariffs, capped price contracts) via company websites; certain of these retail prices are not available via our data source.
8 There was a slight difference between the included working days between gas and the other two
introduced, supply companies essentially had two tasks to complete. First they need to realise margins between wholesale and retail price (without these of course, they have no business model). Second, they need to engage in risk management since retail prices are fixed for a substantially longer period than are wholesale prices and wholesale prices are subject to significant volatility. We analyse these as two separate issues.
Risk management
Figure 1 panel (a) shows the time path of base-load month-ahead electricity wholesale prices from 2001 onwards. Panel (b) shows the time path of the corresponding average retail supply price (annual bill for medium consumption in pence), facing domestic consumers.9 Clearly, wholesale prices are very significantly more volatile than retail prices. Moreover, it is not technically possible to pass on the volatility in wholesale prices to retail consumers, even if they would be willing to bear it, because current meter technology in domestic supply does not allow it. Therefore, unless a supply company‟s appetite for risk is considerable, it will wish to engage in risk reduction through a portfolio purchase strategy. In response to this demand, markets for contracts of various lengths have developed. In addition to a small spot market, there are day-ahead, month-ahead, year ahead and various other contracts available, including the possibility of long term purchase. Another risk-reducing strategy, of course, is to produce on own-account, on the plausible assumption (examined below) that the costs of this are less volatile than purchase.
Given the range of forward prices on offer, it is unclear which should be viewed as “the” price. However, under certain circumstances the choice is immaterial. Specifically, consider the calendar spread
,
T T
T t t
S p p (1)
where pTis the price at time for delivery of a unit of electricity at time T and θ
measures the distance between two time periods. If this series ST, is stationary then
on average it does not matter whether a purchaser buys the shorter or the longer dated
9
contract, it gives rise to the same expected price. In this case, a company may nevertheless choose to diversify risk by purchasing forward, thereby reducing variance.10
Achievement of margins
We now abstract entirely from the risk aspects discussed above and consider the situation where there are a set I of integrated generator/ suppliers, plus a set U of unintegrated generators. Integrated suppliers can contract ahead their retail commitments. Thus they face a two-stage game, in stage 1 they make their retail commitments (in practice, this means they sign up a number of retail customers, whose consumption is rather inelastic with respect to price), in stage 2 they make production commitments. This means that in determining the optimum for stage 2, stage 1‟s decisions can be considered fixed. This basic setup derives from Bushnell, Mansur and Saravia (2008); we also adopt their assumption of Cournot behaviour at both stages (which may be thought of as precommitment to quantity, with price setting to clear the market). Implicitly, we are also assuming that consumers make rational choices of supplier in aggregate. We suppose for simplicity that there are no costs in the system apart from production costs (we assume, amongst other things, that transmission and distribution costs are given and regulated); hence by assumption no additional marginal costs arise at retail level.
Profit for a typical partially integrated firm, indexed i, in period t can be written:
, , , , , , , , , , , , , ,
( , , ) w( , , )[ r ] r ( r , r ) r ( )
it qi t q i t Qu t p qt i t q i t Qu t qi t qi t pi t qi t q i t qi t Ci t qi t
(2)
Here q (Q) represents firm (group) quantities, with p‟s being prices, profits and C total costs, the superscript r distinguishing retail magnitudes where relevant.11 Solving stage 2, retail commitments have already been made, so
10 Note that this has nothing necessarily to do with liquidity in the forward markets. If the forward
markets are very liquid, arbitrage will make the result true (up to the level of transactions costs), since speculators would otherwise profit from buying and selling different matching lengths of contracts. However, the converse, that if a market is illiquid, the result will not hold, is not necessary, although it could occur. This is relevant because there have been claims that the markets in question are relatively illiquid.
11 A special degenerate case exists where q
i,t = 0. This allows the possibility of unintegrated retail
, '
, , , , , , ,
, ,
( , , ) [ ] ( ) 0
w
i t w r t
t i t i t u t i t i t i t i t
i t i t
p
p q q Q q q C q
q q
(3)
Similarly, for an unintegrated firm (which earns profit only at the production stage), the production commitments stage can be written
, '
, , , , , ,
, ,
( , , ) ( ) 0
w
u t w t
t u t u t I t u t u t u t
u t u t
p
p q q Q q C q
q q
(4)
Notice that here we have allowed for production costs to differ as between integrated and unintegrated firms, but not within those groups, although this would be possible.
At the retail (first, but analysed second) stage, the integrated firms have the following first order condition:
, ,
, ,
, ,
0
r
i t w r r i t
t i t i t
r r
i t i t
p
p p q
q q
(5)
We can now analyse various scenarios. Scenario 0 has a Pool and no integrated firms. With separate retail and wholesale firms, double marginalisation exists as given by equations (4) and (5). Consider next scenario 1 in which there are no unintegrated firms, so equations (3) and (5) are relevant. All the integrated firms are identical in size, as a result of the assumption regarding costs and the fact that electricity is homogeneous. All can pre- commit up to 100% of their output to their own retail customers; alternatively, there may be an active spot market for power (perhaps in a model where there are supply risks and generation plant on occasion fails). Suppose they do pre-commit 100%. Then equation (3) tells us that wholesale price falls to marginal cost. Replacing that in equation (5) and simplifying, employing the Cournot assumption regarding other players‟ reactions, shows that the retail price-cost margin is given by the traditional Cournot formula:
'
, ,
,
(.) 1
r i t i t
r
i t I r
p C
p N
where NI is the number of integrated firms andr is the retail elasticity of demand for electricity. All retail prices will also be identical. In other words, as Bushnell et al. emphasise, the wholesale price is low as a result of integration but, something they do not consider, in our model the integrated firms make their profit at the retail level, having transferred power downstream at marginal cost.12
Scenario 2 is where integrated and unintegrated generators co-exist. This implies equations (3) and (4) both hold true upstream. However, unless integrated firms‟ commitments to the downstream market are substantially below 100%, the cost levels of these two types of firms must be very different. Essentially, integrated firms will want to set wholesale price at less than their marginal cost where their commitments exceed their production, so unintegrated firms will produce at a loss unless their marginal costs are lower than those of integrated firms.13 Retail prices will continue to be governed by a formula like (6), except that the marginal cost will need to appropriately re-interpreted as the average marginal cost an integrated firm faces, taking its relatively higher marginal cost together with unintegrated firms‟ lower marginal costs.
All other things equal, final retail prices may be expected to be lower in scenarios 1 and 2 than in scenario 0, as a result of the precommitments made to final consumers by the integrated firms. A particularly advantageous scenario from consumers‟ point of view is if the retail margin exhibited in (6) is constrained by regulation, by entry, or other controls. However, an alternative position is that the retail margin expands in scenarios 1 and 2 because vertical integration amongst suppliers, together with the absence of a Pool, makes entry at the level of supply only more difficult, so that the existing suppliers find less market pressure on the prices they set. Then, when retail regulation is removed, there is scope to raise retail margins. Certainly in Britain entrant independent suppliers have, after a time, all collapsed. At around the same time as the Pool was being exchanged for NETA, significant vertical integration was taking place in the electricity market and the last significant independent supplier (Independent Energy) left the market. It is unlikely these events were unconnected.
12
Clearly, this is sensitive to our assumption (and the UK reality) that there is no retail price regulation.
13 Notice that a nuclear generator or a particularly efficient conventional power station is likely to have
Let us summarise predictions. Under the assumptions favourable to the reform, wholesale margins decrease a good deal between first and second period, whereas retail margins are static. Therefore, overall margins fall. Under the alternative more pessimistic assumption, whereas the wholesale margins decrease, the retail margin increases due to increased barriers to entry and insufficient competitive/ regulatory pressure at retail level. In consequence, the overall impact is uncertain.
4. Empirical Strategy
Clearly, in testing the implications of the modelling of section 3 we require a baseline. The problem is twofold and relates to the facts (a) that prices for wholesale electricity and its inputs vary all the time and (b) many institutional changes were adopted in the market at quite similar times. First, we need to consider the issue of risk management, and whether there are wholesale prices in the market before NETA which can correspond to prices in the market after NETA. Second, we need some form of control for outside events in the retail market, and an overall view on margins. Here, our approach is to make use of two rather clear controls available to us, namely the institutional settings of the wholesale gas market and of the Scottish electricity market at wholesale and retail, and to measure the impact of the changes in the England and Wales electricity market with respect to these controls.
On the first point, we develop the ideas represented by equation 1. Given the range of forward prices on offer, it is theoretically unclear which should be viewed as “the” price. Indeed, supply companies commonly make claims such as that retail prices cannot drop when wholesale prices drop, because the company has purchased ahead at higher prices. Under this argument, rehearsed for example in OFGEM (2007), it is quite possible for wholesale and retail prices to move in different directions and to bear little relationship to one another. This apparent lack of a relationship is something we demonstrate in the Appendix, using information on returns.
stationarity of these spreads within our period 2001-2007. If the futures markets are efficient and liquid, then arbitrage implies the spreads will be stationary, since otherwise traders can make gains by selling one maturity and buying another if the prices are further apart than available information would suggest is reasonable.14 However, since it is commonly claimed that the markets are not liquid, divergences from stationarity are possible.
To investigate these issues, we perform Dickey-Fuller tests for stationarity. Some results of these are presented in table 1 and an illustrative graph of a calendar spread is shown in figure 2. The results presented in table 1a illustrate links between day-ahead prices and other maturities on which we have data, for the period 2001-2007; we also examined all other combinations of maturities. Essentially, this series of results illustrated by table 1a tell a consistent story- the spreads are stationary in almost every case, meaning that any one series does not, on average, carry different information from any other.
There is a further, extremely important, implication, illustrated in table 1b. The spreads involving the UKPX data and all available maturities of Platts prices show that these spreads are also stationary, in every case. This means that in expectational terms, it does not matter whether a supplier chooses to purchase a future contract some time before delivery, or to purchase very close to delivery. Sometimes, one will turn out ex post as the better strategy, sometimes the other. The importance lies in the fact that when the Pool was in operation, UKPX prices were available but the various maturities of wholesale prices making up the Platts indices were not. If there was no relationship between the UKPX prices and the Platts prices, we could not make comparisons before and after NETA, because of the difference in the underlying wholesale markets. The stationarity result reported in table 1b implies that we can make comparisons in expectational terms between the market situations before and after NETA.
Although the various series are stationary, risk management is still important. In addition, stationarity does not imply that the mean prices are equal. In table 2 we
14 In other words, in the absence of market-affecting news coming between the timing of one security
estimate the mean differences, using the relative wholesale spread [(ukpx – „future‟)/ukpx]15
. The table shows that on a mean-value test near maturities are at a discount of just over 3% to UKPX, with the longer-dated ones at a greater discount.16 Using medians, and the Wilcoxon test, a similar pattern (but slightly smaller discounts overall) is presented.
We now turn to the logic relating to the controls. One of these is the wholesale market for gas. The gas market has a quite different national institutional structure. Gas is a very significant input into electricity generation (approximately 37% of electricity is produced from gas in the UK, the largest proportion of any fuel).17 The wholesale market for gas has not, over the period we are interested in (since 1999), been the subject of any major policy interventions, and gas was privatised and deregulated significantly before electricity. Thus we take as an index for wholesale costs of one MWh of electricity, the cost of that amount of gas which will produce one MWh of electricity. The standard approach we adopt is to use the so-called “spark spread”, the gap between the wholesale cost of electricity and the gas cost to produce it; this concept is standard in the industry as a measure of the potential profitability of electricity generation. We use gas, rather than coal (i.e. the “dark spread”) because coal is markedly more storable so that the price at any time does not fully reflect present conditions. Moreover, as demonstrated in the Appendix, whilst prices in the wholesale gas market and wholesale electricity market appear to be somewhat related, no demonstrable link exists between wholesale electricity and coal (or oil) prices.
Finally, on the retail side, the Scottish market has a very useful feature. It remained a separate vertically integrated market until the BETTA reforms of 2005 (in addition the transmission interconnector between England and Scotland has limited capacity and the penetration of English retailers into the Scottish market is relatively limited). Hence as between the 1999-2001 period and the 2001-05 period, significant changes were taking place in the England and Wales wholesale market but not in the Scottish
15 Here „future‟ means one of the Platt‟s future prices.
16 Supply is extremely inelastic in the short run, less inelastic in the longer run, so this is what we
should expect.
17
The figures (from the Digest of Energy Statistics, 2007) are done on an “electricity supplied” or
wholesale market. Therefore, we can use the Scottish market as a control, to take account of factors that could influence the overall picture which we may have omitted. There is also a comparison available between retail price trends relating to the unregulated non-incumbent versus partly-regulated incumbent supplier tariffs.
5. Margins Analysis
Let us take as given the above results on calendar spreads on different wholesale maturities, and on spark spreads. Our tests of the effects of changes in the market institutions then boil down to a set of simple pairwise comparisons. Do mean margins, of various types, rise or fall as between the pre-NETA (1999-2001) and post-NETA, pre-BETTA (2001-2005) stages?
Generation Margins
To examine trends in generation margins before and after the introduction of NETA, we first require a common wholesale price, before and after NETA. Here, the results of the previous section suggest that in expectational terms, the UKPX series is representative (albeit on the high side) of prices available in the market following NETA, and at the same time is appropriate in the pre-NETA or Pool stage. The other factor required is an appropriate input price. Here we choose to use the (day-ahead) gas price, for reasons discussed above.
Our chosen measure of the generation margin is the “spark spread”, being the difference between the wholesale price of electricity, as defined earlier, and the cost of producing that electricity, using gas.18 We engage in a straightforward comparison of mean relative spark spread [spark spread/electricity price] before and after the point when NETA was introduced. The results are very clear-cut, in line with the prediction, and very striking, as can be seen from table 3. The spark spread is markedly lower in the later period, on average (a 24% markup as against a 44% markup). Thus, the profitability of merchant generators will have suffered, and
18 Here we make the standard assumption about average efficiency of gas generation plant. Because
investment plans for new independent generation plant will have been subject to considerable downward impact.19
Retail Margins
Turning now to retail margins, we utilise a new measure that we call the relative “Retail margin spread”. We define this as [(retail “price” – wholesale price – distribution cost)/retail “price”]. Retail price is the average bill across the companies for a consumer taking an average amount of electricity (3,300kWh per year). Wholesale price is the UKPX figure discussed earlier, for the same quantity. Distribution cost varies by area as well as time. We split up into different types (e.g. areas) somewhat, as described later. Note that we have not included a factor for transmission costs, which are a rather small part of the bill (but also very complex). Apart from this omission, the idea is to subtract from retail price the disbursements the retailer must make. Other costs, for example marketing, billing, metering, etc are somewhat subject to the supplier‟s discretion.
The results of this exercise are shown in table 4. This makes comparison of means between the period in 1999-2001, after retail competition had been instituted but before NETA, and the period in 2001-2005 after NETA but before BETTA. The idea is that whilst Scotland has experienced the same changes on the retail side of the market, it is essentially unaffected by structural reorganisation at wholesale level over this period. Hence it can act as a point of reference. Moreover, consumers in Scotland who are not with their incumbent supplier have no first order impacts on them coming from either supply or wholesale level across the two periods.20
A further point of comparison (either in England and Wales or in Scotland) is between two groups of direct debit customers- those who are with their incumbent supplier and those with an alternative provider, since in the first period prices are regulated for the former, whereas in the later period they are regulated for neither group. The same comparison is also carried out for prepayment meter users, customers that are
19 There is substantial evidence consistent with this- restructuring at British Energy in 2002, following
an approach to the DTI resulting from an inability to meet its liabilities (HC892, July 2007) and at Drax in 2003 (Company website), for example.
20 There may be second-order impacts, because non-incumbent suppliers are likely to base their offer
generally charged higher tariffs than other categories of customers (partly due to the cost of servicing the meters) and who are usually not courted as actively by non incumbent suppliers. Table 4a takes a further segmentation of the market. It shows the results of the same comparisons carried out between the period before the introduction of NETA and the period after April 2002, when retail price controls were removed for all payment methods and most of the consolidation process amongst suppliers had been completed.
Several things stand out from table 4. First, there has been a general drift upward in retail margins as between the two periods. This might be seen as essentially a premium for risk- companies all engage in forward buying to reduce risk and, as we have seen, this comes at a premium. Or there may be non-discretionary cost factor impacts that we do not include in our margin.21 We note that, for the Scottish direct debit non-incumbent customers, this margin rises approximately 5.6%. However, comparing with the Scottish incumbent customers, we see their margin increased by around 10%. More strikingly, the relative retail spreads for prepayment meter users served by non incumbents in Scotland are not statistically different between the two periods, while for those served by the incumbents we observe a significant increase of around 9% between the two periods. This difference is indicative of a rise resulting from relaxed regulation of incumbent prices at supply level. Whether that relaxation of retail regulation (which many observers consider desirable) is later followed by more competitive pricing so that increases in margins for this reason are short-lived, is something we do not examine here.
The difference in difference analysis in the final column shows clearly that retail margins have increased by significantly more in the case of England and Wales, where NETA was introduced. Since the only real difference between countries is the introduction of NETA, the strong suggestion is that NETA has had a strong impact on the rise in margins. Here, non-incumbent direct debit customers see their margin go up by 11.3%, whereas for incumbent customers the rise is 16.3%! As with the impact on wholesale margins, the effects are clear and quite dramatic. The impact of NETA on top of retail relaxation has allowed a greater increase in retail margins in England
21 These exclude carbon costs, which were not instituted until 2005, but there are certain other factors
and Wales than in Scotland. In sum, a combination of NETA, vertical integration and regulatory relaxation has allowed retail margins to drift up a good deal, and each of these appears to have had some impact. As shown in Table 4a, the results are qualitatively very similar when for robustness purposes we compare margin spreads in the period before the introduction of NETA and the period after April 2002.
However, this analysis of differences between means does not explain precisely why retail margins increased. Amongst the possible explanations are the increased vertical integration leading to a lack of transparency over wholesale prices, a lack of liquidity in the wholesale market, and the impact of these factors upon independent supply companies. Independent suppliers may act as a constraint upon the markups that the established major operators can obtain, either by attracting consumers or acting as basing points for established suppliers‟ prices. In order to investigate this issue somewhat further, we regress retail prices on their various potential determinants, including dummies taking the value 1 when the particular independent is in operation.
The results of our estimation along these lines are shown in table 5. These relate retail price (annual bill, pence for a medium consumer taking 3300kWh) to distribution cost (for the same consumer, in pence), wholesale price in pence (again in pence for a medium consumer, instrumented by Brent crude oil price, lagged 6 months), a dummy for the presence of NETA, a broad measure of the degree of vertical integration amongst the big-6 suppliers, instrumented by the 20-year bond yield, and dummies for the presence, as independent entities, of those independents which captured around 100,000 customers or more. We show results both for England and Wales, and somewhat truncated, for Scotland, where NETA and vertical integration were at that stage irrelevant.
£10, ceteris paribus. It is worth noting in addition that the effect on non-incumbent PPM customers seems to have been somewhat different. There is also significant evidence that the independent suppliers on average had a substantial moderating influence (several pounds on the average annual bill)- whilst individual coefficients differ substantially in magnitude and significance, in the case of each subgroup the Wald test implies that there is a significant overall impact. It is also interesting to make comparisons as between incumbent and non-incumbent firm customers. For prepayment customers, non-incumbent customers are less affected by NETA.
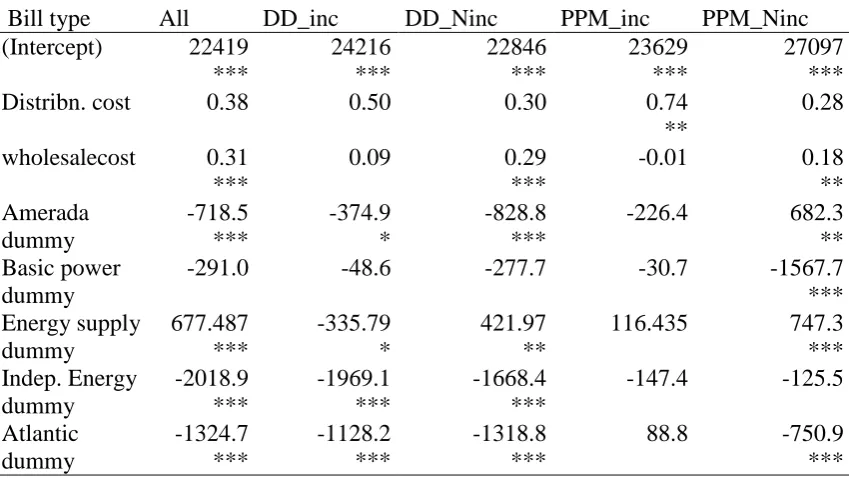
For Scotland, as we would predict, the only significant factors relate to the non-incumbents‟ and independents‟ pricing. Thus the regression results concord with but nuance the simple comparison of means analysis. It does appear that NETA was a catalyst in margins at retail level rising in England and Wales.
Yet, against this conclusion, supply divisions of the “big six” have made claims they earn no money on retail activity. To reconcile these points, note that we are not taking into account the actual transfer price between divisions of an integrated firm. Nor are we including any of the costs in any way under the company‟s own discretion. Whilst some of these are only slightly in the control of suppliers, others such as marketing expenses clearly have more of a discretionary flavour. The second factor is that, in setting retail prices, a supplier will have regard to more than just its costs. Prime amongst these other factors, along with a desire to smooth price fluctuations to domestic customers to a great extent, will be the competitive position in relation to other suppliers.
Arguably though, the relationship between wholesale electricity prices and retail prices for electricity is not something of great public concern if at the same time the wholesale margin with respect to generation costs has fallen, on the assumption that the result is lower retail prices. Therefore to obtain an overall perspective, it is important to look also at the impact of the various changes on retail prices relative to the underlying costs of wholesale gas.
Table 6 displays these results on an aggregate basis. The disappointing truth, for England and Wales, is that the overall margins in the first and second period are too close for the difference to be significant, while we do observe a significant decline in overall margins for Scotland. The most straightforward interpretation of this finding is that the impact of NETA in England and Wales was a reorganisation of where money was made in the system, rather than having any benefit for consumers overall.
6. Concluding Remarks
The direct link between wholesale and retail prices in UK domestic electricity supply is, so far as we can ascertain, not strong. Over time, wide divergences between the trends of these two variables have been observed, so that margins have changed a good deal. It has been argued that this is plausibly related to forward purchasing behaviour rather than, as has also been suggested, a desire to make money at consumers‟ expense. We question this sanguine view. The effects of forward purchasing are apparent in the strong time persistence noted in the data. On the other hand, the accounting analysis of Cornwall et al. (2008) is more consistent with our finding of rather weak links between wholesale and retail prices, and a substantial impact relating to stronger retail positions post-NETA. Cornwall et al observe big changes in supplier profitability over time.
opacity it created and the attendant consequences for the retail market seem not to have been foreshadowed.
References
Bushnell, J., Mansur, E. and C. Saravia. "Vertical Arrangements, Market Structure and Competition: An analysis of Restructured U.S. Electricity Markets." American
Economic Review. Vol. 98, No. 1. March2008.
Cornwallenergy Associates for the National Right to Fuel Campaign (2008) Gas and Electricity Costs to Consumers, Unison
Evans, J. and Green, R. (2003) “Why did British electricity prices fall after 1998?”, Hull University Business School, Research Memorandum 35.
Evans, J. and Green, R. (2005), “Why did British electricity prices fall after 1998?”, Mimeo, University of Birmingham, July.
Federico, G. & Rahman, D. (2003), "Bidding in an electricity pay-as-bid auction," Journal of Regulatory Economics, 24(2), 175-211.
Gans, J S and Wolak, F A (2008) “A comparison of ex ante versus ex post vertical market power: evidence from the electricity supply industry”, mimeo, University of Melbourne.
Green, R J and Newbery, D M (1992) “Competition in the British electricity spot market”, Journal of Political Economy, 100, 929-53.
Littlechild, S (2005) Beyond Regulation, Institute of Economic Affairs.
Meade, R. and S. O‟ Connor (2009) „Comparison of long-term contracts and vertical integration in decentralised electricity markets‟ Robert Schuman Centre for Advanced Studies, European University Institute, working paper No.2009-16
OFGEM (2002) New electricity trading arrangements (NETA)- One year review.
OFGEM (2008) Energy Supply Probe. Initial Findings Report, September
Sweeting, A (2007) “Market power in the England and Wales wholesale electricity market 1995-2000”, Economic Journal, 117, 654-685.
Figures and Tables
Figure 1: Month-ahead wholesale electricity prices (Platts Data) and medium consumption retail prices (in pence for 3300 kWh)
Figure 2: Calendar spreads example: this graph relates to the spread between UKPX and Platts‟ day-ahead assessments.
a) Calendar spreads against day-ahead prices. All series except month-year and 2seasons-year show stationarity at the 1% level.
no constant
no trend constant
constant and trend
Day/week -24.461 -24.503 -24.500
Week/month -11.289 -11.377 -11.461
Day/month -15.891 -15.897 -15.920
Day/2seasons -13.279 -14.095 -15.028
Day/year -12.256 -12.727 -13.158
Week/2seasons -7.874 -8.929 -10.212
Week/year -6.770 -7.297 -7.768
Month/2seasons -3.637 -4.270 -5.006
Month/year -2.754 -3.059 -3.343
2seasons/year -3.561 -3.571 -3.563
(b) Calendar spreads, Platts‟ forward prices against UK Power Exchange prices. All series reject the hypothesis of random walk at the 1% level
no constant
no trend constant
constant and trend
UKPX/ day -31.69 -32.19 -32.26
UKPX/week -27.94 -28 -28.01
UKPX/month -18.98 -19.12 -19.19
UKPX/2seasons -16.09 -17.64 -19.17
[image:27.595.94.436.113.293.2]UKPX/year -15.34 -16.36 -17.13
Table 2: Mean differences between various maturities of wholesale prices based on relative (shifted) spreads. Mean value test. Null hypothesis: mean is zero
series mean t-test p-value lower.value upper.value apx-d.ahead 0.0376 7.5709 0.0000 0.0279 0.0474
apx-w.ahead 0.0485 7.8948 0.0000 0.0365 0.0606
apx-m.ahead 0.0836 12.3976 0.0000 0.0704 0.0968
[image:27.595.98.450.338.451.2]apx-2s.ahead 0.1693 14.9642 0.0000 0.1471 0.1915 apx-y.ahead 0.0971 7.0482 0.0000 0.0701 0.1242
Table 3: Spark spreads (in relative terms), before and after NETA (but before BETTA)
statistic p.value mean period 1 mean period 2 BN-BB_Rel.
spreads 13.9671 0 0.4382 0.2422
BN-BB_Abs.
Table 4: Selected relative retail margins [(retail price-wholesale costs)/retail price] as defined in the text. Null hypothesis: means are equal.
Relative
spreads (margin)
t-stat p- value mean period1
mean
period2 Difference in differences t-stat p-value ALL Engl & Wal -12.31 0.00 0.46 0.51
4.01 0.00
Scotland -7.64 0.00 0.44 0.47
DD_inc Engl & Wal -19.99 0.00 0.46 0.53
5.85 0.00
Scotland -13.79 0.00 0.45 0.5
PPM inc Engl & Wal -18.66 0.00 0.51 0.57
4.20 0.00
Scotland -14.26 0.00 0.48 0.53
DD noninc Engl & Wal -12.89 0.00 0.43 0.48
4.73 0.00
Scotland -7.25 0.00 0.43 0.46
PPM noninc Engl & Wal -8.49 0.00 0.53 0.56
7.26 0.00
Scotland 1.76 0.08 0.52 0.51
Period 1 is the period after introduction of domestic retail competition but before NETA, period 2 is the period between the introduction of NETA and the introduction of BETTA.
Table 4a: Selected relative retail margins [(retail price-wholesale costs)/retail price] as defined in the text. Null hypothesis: means are equal.
Relative
spreads (margin)
t-stat p- value mean period1 mean period2 Difference in differences t-stat p-value ALL Engl & Wal -11.02 0.00 0.46 0.51
3.68 0.00
Scotland -6.66 0.00 0.44 0.47
DD_inc Engl & Wal -18.14 0.00 0.46 0.54
5.85 0.00
Scotland -11.33 0.00 0.45 0.5
PPM inc Engl & Wal -16.61 0.00 0.51 0.57
3.95 0.00
Scotland -12.03 0.00 0.48 0.53
DD noninc Engl & Wal -12.43 0.00 0.43 0.49
4.76 0.00
Scotland -6.68 0.00 0.43 0.46
PPM noninc Engl & Wal -6.00 0.00 0.53 0.56
6.79 0.00
Scotland 3.49 0.01 0.52 0.51
Period 1 is the period after introduction of domestic retail competition but before NETA, period 2 is the
period between April 2002 (removal of all price controls and end of the consolidation periods) and the
[image:28.595.90.501.381.600.2]Table 5. Regression Analysis of determinants of retail price
a) ENGLAND AND WALES- dependent variable, retail price for average consumption
Bill type All DD_inc DD_Ninc PPM_inc PPM_Ninc
(Intercept) 12276.96 *** 14084.35 *** 18042.27 *** 11572.09 *** 21741.88 ** Distribn. cost -1.093
** -1.437 *** -1.271 *** -1.033 * -0.064
wholesale_cost 0.527 *** 0.375 *** 0.306 *** 0.507 *** 0.323 *** Neta dummy 1609.308
** 2315.309 *** 1884.071 *** 1481.903 * -453.749
Vertical Int. 8551.361 *** 9956.116 *** 8922.966 *** 8527.466 ** 3001.426 Amerada dummy -1484.15 *** -1707.16 *** -1452.49 *** -2027.74 *** 205.109 Basic power dummy 1888.799 ** 2162.99 *** 1860.111 *** 1791.585 * 186.681 Energy supply dummy 721.637 ** 538.692 ** 409.591 *
567.867 236.862
Indep. Energy dummy
-461.754 -1713.96 *** -1777.17 *** -996.509 * -524.353 Atlantic dummy
1342.381 1222.865 923.317 1031.443 402.932
wald.test 39.39 68.77 58.07 72.48 18.81
p.value 0.000 0.000 0.000 0.000 0.002
b) SCOTLAND- dependent variable, retail price for average consumption
Bill type All DD_inc DD_Ninc PPM_inc PPM_Ninc (Intercept) 22419
*** 24216 *** 22846 *** 23629 *** 27097 ***
Distribn. cost 0.38 0.50 0.30 0.74
**
0.28
wholesalecost 0.31 ***
0.09 0.29
***
-0.01 0.18
** Amerada dummy -718.5 *** -374.9 * -828.8 ***
-226.4 682.3 ** Basic power
dummy
-291.0 -48.6 -277.7 -30.7 -1567.7
*** Energy supply dummy 677.487 *** -335.79 * 421.97 **
116.435 747.3 *** Indep. Energy dummy -2018.9 *** -1969.1 *** -1668.4 ***
-147.4 -125.5
Atlantic dummy -1324.7 *** -1128.2 *** -1318.8 ***
wald.test 56.395 60.929 75.537 1.3207 44.454 p.value 6.74E-11 7.81E-12 7.19E-15 0.9328 1.87E-08
*** p-value<0.01, ** 0.01<p-value<0.05, * 0.05-p-value<0.1
Note_1: Wholesale cost is wholesale price (for the average consumer bill) instrumented by Brent Oil price lagged 6 months.
Note_2: Vertical Int is measured as the ratio of the annual generating capacity owned by the top 6 energy companies to annual domestic sales, instrumented by the UK government 20-year bond yield, real terms, in percent.
Note 3: All models have been estimated using GLS (Generalized Least Squares) estimators with AR(2) residuals, except for PPM_Ninc (non-incumbent tariffs for prepayment consumers) where residuals have been modelled with an AR(4) structure. This different structure of autocorrelation is needed to obtain residuals with no
evidence of deterministic pattern.
Note 4: The dummies for independent companies take on the value 1 when the firm is operating, 0 otherwise.
[image:30.595.92.442.380.431.2]Note 5: The Wald test relates to the null hypothesis that all four independents have a zero effect on prices, the alternative being that they do affect prices.
Table 6: Selected relative whole retail margins [(retail price-wholesale gas costs-distribution charges)/retail price]
Retail spreads
to gas t stat p value
mean period1
mean period2
ALL England -1.0752 0.2825 0.5681 0.5714
Scotland 6.0181 0 0.546 0.5264
Appendix:
Links between wholesale prices for power and input fuels
We first examine dynamic patterns specific to the UK day-ahead base load power prices, i.e. (i) whether wholesale power prices are autocorrelated, and if so how, and (ii) evaluate their relationship over time with related energy products such as natural gas, gas oil, fuel oil and coal, i.e. whether wholesale power prices depend on other energy prices and if so the strength of that dependence.
An initial graphical inspection of the time series in levels reveals a time trend for all the series which indicates a lack of statistical stationarity. For this reason the statistical analysis of relationships between energy prices below was conducted for the most part in terms of returns (differences in the logarithms of prices between one time period and the next). This approach is not only statistically appropriate but it also allows us to examine the returns to holding the commodity in question for one more period as measured by the log difference of the price today and the price yesterday. Figure A1 illustrates the data series for prices for power (wholesale electricity) and figure A2 converts this into returns.
The graphical analysis of the prices (in levels) reveals the presence of step changes in the price levels of gas oil and heavy fuel oil in late 2004 and a series of extreme values at the end of 2005 and beginning of 2006 for both gas and electricity. Figure A1 illustrates.
The statistical analysis of autocorrelation in the returns observed with daily frequency reveals a pattern of seasonal non-stationarity in the power series, which is not seen in the data for any other energy price observed with the same frequency. An example is shown in figure A3. This pattern implies that there is a strong positive correlation between the returns today and the returns on the same day last week, the week before that etc.22
22
Extending the analysis of the daily time series to the potential correlation across the returns for different energy products, we observe a statistically significant contemporaneous correlation between the two final products (gas and power) and also between heavy fuel oil and gas oil, but none between these two groups, as can be seen in table A1. There is also a much smaller positive correlation between returns on gas yesterday and returns on power today and some negative correlation between gas on earlier days in the week and power today. Figure A4 illustrates this cross-correlation, with the lag length on the horizontal axis and correlations represented on the vertical. Essentially correlations outside the dashed lines may be considered as statistically significant at the 95% level. The other cross correlations, apart from the contemporaneous correlation between gas oil and heavy fuel oil, do not exhibit a similar pattern.
The observed contemporaneous and lagged relationship between gas and power is to be expected since gas and power are to some extent substitutes in production and consumption- they are likely to be influenced by the same shocks and a rise in returns on gas will be followed by an effect on electricity prices. On the other hand the relationship between heavy fuel and gas oil could be explained in terms of the products substitutability in an earlier stage of the energy production process, or shocks to the production or supply of oil. We also observe a statistically significant but small correlation between power and heavy fuel oil. This contemporaneous effect between an input and an output of the energy production process is not observed between the same series when examined at lower frequency.
The statistical analysis of the same sets of time series observed at weekly frequency allows us to make comparisons additionally with coal prices. Table 2 shows the contemporaneous correlations. However it does not provide as much evidence about the autocorrelation and cross-correlation patterns as for the daily data. Indeed the analysis of the series with weekly frequency reveals only a significant negative correlation between this week‟s returns and last week‟s for both power and gas.
As with the daily price series we still find strong statistically significant evidence of a contemporaneous cross-correlation between returns on gas and power and between heavy fuel oil and gas oil, but no significant link between power and other fuel prices. We also observe some smaller and negative correlation between power and gas at various other weekly intervals. This again should reflect the substitutability between these two energy products. Notice that although we observe a price influence both from power to gas and from gas to power the relative sizes of these effects seem to indicate an overall positive effect of gas price variations on power. Finally, there was a slight positive link between coal price and power price around 11 weeks thereafter. This might indicate a relationship between the two, since the coal price is a 90 day forward price, or it might just be a rogue result.
_
Figures A1 and A2: Graphs showing prices (pt) and returns, respectively, for the higher of the two electricity price indices on a daily basis. Returns defined as
_
[image:34.595.99.500.183.571.2]Table A1: Correlation matrix for electricity, gas, fuel and gas oil prices variations (daily prices). p-values are in brackets.
electricity gas fuel gas oil
electricity 1 0.304(0.000)
0.081
(0.002)
0.035
(0.172)
gas 0.304(0.000) 1
0.007
(0.776)
0.026
(0.302)
fuel 0.081 (0.002)
0.007
(0.776) 1
0.639
(0.000)
gas oil 0.035 (0.172)
0.026
(0.302)
0.639
[image:36.595.90.354.122.245.2](0.000) 1
Table A2: This table is the equivalent of table A1 but with a weekly frequency in order to include coal price data.
electricity gas fuel gas oil coal
electricity 1 0.534 (0.000)
0.059 (0.297) 0.035 (0.537) -0.015 (0.797)
gas 0.534 (0.000) 1
-0.036 (0.530) -0.011 (0.850) 0.014 (0.809)
fuel 0.059 (0.297)
-0.036 (0.530) 1 0.652 (0.000) -0.041 (0.473)
gas oil 0.035 (0.537)
-0.011 (0.850) 0.652 (0.000) 1 -0.003 (0.958)
coal -0.015 (0.797)
[image:36.595.91.400.287.439.2]

![Table 4: Selected relative retail margins [(retail price-wholesale costs)/retail price] as defined in the text](https://thumb-us.123doks.com/thumbv2/123dok_us/9724692.473462/28.595.90.501.381.600/table-selected-relative-retail-margins-retail-wholesale-defined.webp)
![Table 6: Selected relative whole retail margins [(retail price-wholesale gas costs-distribution charges)/retail price] Retail spreads mean mean](https://thumb-us.123doks.com/thumbv2/123dok_us/9724692.473462/30.595.92.442.380.431/selected-relative-margins-wholesale-distribution-charges-retail-spreads.webp)


