http://wrap.warwick.ac.uk/
Original citation:Rajpoot, Nasir M. (Nasir Mahmood) and Arif, Muhammad. (2008) Unsupervised shape clustering using diffusion map. Annals of the BMVA, Volume 2008 (Number 5). pp. 1-17.
Permanent WRAP url:
http://wrap.warwick.ac.uk/37083
Copyright and reuse:
The Warwick Research Archive Portal (WRAP) makes this work by researchers of the University of Warwick available open access under the following conditions. Copyright © and all moral rights to the version of the paper presented here belong to the individual author(s) and/or other copyright owners. To the extent reasonable and practicable the material made available in WRAP has been checked for eligibility before being made available.
Copies of full items can be used for personal research or study, educational, or not-for-profit purposes without prior permission or charge. Provided that the authors, title and full bibliographic details are credited, a hyperlink and/or URL is given for the original metadata page and the content is not changed in any way.
A note on versions:
Unsupervised Shape Clustering
using Diffusion Maps
Nasir Rajpoota,? and Muhammad Arifb
a Department of Computer Science, University of Warwick, Coventry CV4 7AL, UK b Department of Electrical Engineering, Pakistan Institute of Engineering &
Applied Sciences (PIEAS), PO Nilore, Pakistan
? Corresponding author’s email address:
[email protected]
Abstract
The quotient space of all smooth and connected curves represented by a fixed number of boundary points is a finite-dimensional Riemannian manifold, also known as ashape manifold. This makes the preservation of locality a critically important issue when re-ducing the dimensionality of shapes on the manifold. We present a completely unsuper-vised clustering algorithm employing diffusion maps for locality-preserving embedding of shapes onto a much lower-dimensional space. The algorithm first obtains a non-linear low-dimensional embedding of shape context features of outer boundary contours of the shapes. Considering the embedded coordinates as a new minimalist representation of shapes, a clustering of shapes is obtained using a finite mixture model. The proposed clustering algorithm is computationally efficient, as it relies on clustering in a very low-dimensional space, and produces much improved results (88.6% for a 7-class dataset) as compared to clustering with conventional linear projections.
1
Introduction
With an ever increasing amount of image data at one’s disposal, aplausibleclustering of the data has become a well sought after goal in recent years. Such a clustering can be applied to data visualisation, data organisation, exploratory data analysis, only to name a few ap-plications. Shape can be used as a vital clue for these applications when the data happens to contain images of objects. The 2D shape, also referred to as simply shape in the remain-der of this paper, of a 3D object is a function of the object’s 3D geometry and its reflectance function or texture (internalparameters) as well as illumination and camera location ( exter-nalparameters). Shape analysis is one of the key problem areas in computer vision with a range of applications in areas such as object recognition, image retrieval, and object-based video coding. Most of the existing literature on shape analysis can be broadly categorised into two classes in terms of representation: (1)landmarkor keypoint based methods, and (2)
c
outercontour based methods. The former kind of techniques face the limitations that they require the keypoints to be marked, manually or automatically, and a correspondence be-tween keypoints of different shapes should be found for analysis purposes. The latter type of methods overcome this limitation by first representing the object’s 2D shape image as a silhouette. Acontour of the outer boundaryis obtained, often by edge detection, and is then regarded as shape of the object. A finite sampling, consisting of saynpoints pi = {xi,yi}
where(xi,yi)are coordinates of the ith boundary point, of the outer boundary can,
there-fore, be used to represent an instance (in<2n) of 2D shape of the corresponding 3D object.
A suitable representation of shapes should be invariant to affine transformations of shape Kendall [1984], Bookstein [1986], in turn requiringnto be large and potentially invoking the
curse of dimensionality. To circumvent this problem, classical shape analysis methods such as Cootes et al. [1995], Leventon et al. [2000] employ principal component analysis (PCA) to reduce the dimensionality of the problem. One of the basic assumptions that these methods make is that the subspace corresponding to the major modes of variation for a particular class of shapes is linearised. The reality, however, is that such subspaces may be far from linear. In fact, the space of all ‘smooth’ connected closed curves is infinite-dimensional and is not a vector space, but locally linear (i.e., amanifold) Michor and Mumford [2003]. And the resulting quotient space is a finite-dimensional Riemannian manifold Michor and Mum-ford [2003], Klassen et al. [2004], Brun [2007], often termed as ashape manifold. For these manifolds, a locality preserving non-linear dimensionality reduction (NLDR) method (see van der Maaten et al. [2008] for a review of recently developed NLDR methods) is required. In this context, we define the problem ofshape clusteringas follows:
Problem Definition: Given a setΩ={Ω1,Ω2, . . . ,Ωc}containing shapes
from c different classes, where Ωi = {Cij},j = 1, 2, . . . ,Ni = |Ωi|, ∑iNi = N, the total number of shapes, andCij ∈ C1is a connected closed
curve, represented bynboundary points of the form{p = (x,y)}in the Euclidean plane, find a non-linear mapping
Ψ :<2n 7→ <m,
wherem<< n, such that clustering in<m yields a plausible grouping of
similar shapes.
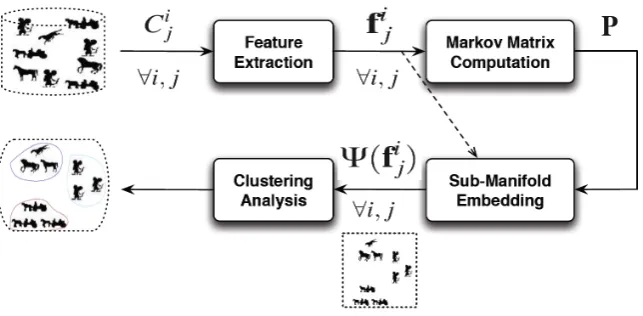
Figure 1: Block diagram of the proposed clustering algorithm.
however, address the clustering problem.
In our earlier work Rajpoot et al. [2007], we have shown a diffusion maps based frame-work for learning the shape manifolds to be significantly more effective than linear subspace projection. In this paper, we extend the framework proposed in Rajpoot et al. [2007] to unsu-pervised clustering of shape manifolds. We conjecture1that an isometry exists betweenΣn2, the space of shapes withnpoints in 2D, and a shape manifold whose exact geometry is un-known to us but whose different sub-manifolds correspond to different shapes. We propose a shape clustering algorithm which employs diffusion maps for non-linear embedding of the feature vectors extracted from a given set of unknown and unseen 2D shapes into a very small dimensional space. It is shown in Section 3 that the low-dimensional embedding pre-serves the locality of shapes on a high-dimensional manifold. Clustering of low-dimensional embedding is obtained using a finite Gaussian mixture model, since the resulting clusters can be of elongated shapes as noted in Yankov and Keogh [2006], and Bayesian information criterion (BIC) Fraley and Raftery [1998] is employed to determine the number of modes in the mixture model. Results of clustering thus obtained can be used for exploratory analysis of a database of shapes and for visualisation purposes.
The remainder of this paper is organised as follows. A description of the proposed clus-tering algorithm is given in the next section, followed by a presentation of the experimental results and their discussion in Section 3. The paper concludes with a summary and some future directions.
2
The Clustering Algorithm
A block diagram of the proposed clustering algorithm is given in Figure 1. Input to the algo-rithm is a dataset consisting of shape images belonging tocdifferent classes. We first extract feature vectors for each of the shape images using shape context, as described in Section 2.1. The feature vectors are used to form a Markov matrix, described below in Section 2.3, with
1This conjecture may be regarded as an extension of Kendall’s theorem in Kendall [1984] which states that an isometry exists betweenΣ3
the help of a shape similarity measure (Section 2.2). Low-dimensional embedding of all the shape images is computed using eigenvectors of the Markov matrix. The embedded coor-dinates are then considered as a minimalist representation of the shapes and a clustering is obtained using finite mixture models, as described in Section 2.5. Clustering by finite mix-ture models takes place by using the Expectation-Maximisation (EM) framework and can be achieved in both semi-supervised and unsupervised manners. In a semi-supervised setting, the algorithm requires the user to input the number of clusters (i.e., modes in the mixture model) to be found in the dataset. In an unsupervised setting, the algorithm determines the number of clusters by finding the number of modes that maximise the BIC Fraley and Raftery [1998].
2.1 Feature Extraction
As mentioned above, a desirable representation of shape should factor out any translation, scale, and rotation transformations. In order to learn the structure of shape manifolds of different classes in an unsupervised manner, it is crucial that such a representation employs features related to a shape that are associated with main shape characteristics. Several fea-tures for shape representation, also known as shape descriptors, have been proposed in the literature (see Zhang and Lu [2004] for a survey on the topic). For a given shape, we first extract its corresponding outer boundaryCwhich consists ofnboundary pointspi = (xi,yi),
fori=1, 2, . . . ,n. The number of boundary pointsnis fixed by employing a cubic spline in-terpolation for re-sampling the boundary points. In our earlier work Rajpoot et al. [2007], we used Fourier descriptors (FDs) to representC. While being simple to compute, just requiring a fast Fourier transform inO(n)time, the FDs are inherently rotation invariant and can be easily made scale invariant by dividing the magnitude of high frequency Fourier coefficients by the DC component.
In this paper, we employ shape context (SC), recently proposed by Belongieet al. Be-longie et al. [2002] as a powerful descriptor for shapes. The main idea of SC is to describe a distribution of points in the log-polar neighbourhood of a given pointpi in the form of a
coarse histogramhicomputed as follows Belongie et al. [2002],
hi(k) =#{q6= pi :(q−pi)∈bin(k)} (1)
∀k = 1, 2, . . . ,K, whereK denotes the total number of bins, which are uniform in the log-polar space. This idea is also illustrated in Figure 2, taken from Belongie et al. [2001]. The histogramhias computed by equation (1) defines the shape context forpi. This rich
descrip-tion of contextual informadescrip-tion about the neighbourhood of a point on the shape boundary lends itself to an efficient solution for the point correspondence problem and proves to be useful for our purpose of shape clustering as well.
Figure 2: Shape context: (a) a character shape; (b) edge image of (a); (c) a point pon shape (a) and all the vectors originating frompto all other points on the edge image; (d) log-polar histogram of the vectors in (c), termed as the shape context of p (reprinted from Belongie et al. [2001]).
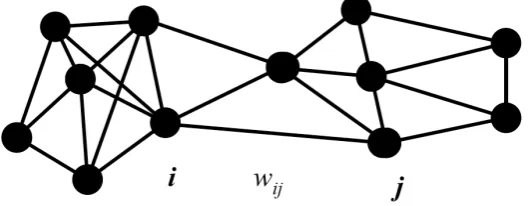
Figure 3: Adjacency graph depicting relationships between different shapes in the database; Nodes of the graph represent shapes and edges represent similarity between nodes with their lengths inversely proportional towij.
2.2 The Shape Similarity Measure
In order to ensure that the low-dimensional embedding will preserve the locality of shapes of different internal and external parameters on the shape manifold, a suitable similarity measure is required. We define the similarity between two feature vectors2, fi andfj,i,j =
1, 2, . . . ,N, using a Gaussian kernel of widtheas follows,
wij =w(fi,fj) =exp −
||fi−fj||2
2e !
. (2)
The above pairwise similarity measure is also used as the main property of an edge between nodesiandjin an adjacency graph, where nodeiof the graph represents feature vector for theith shape image in the dataset, as shown in Figure 3.
2Since our goal in this work isunsupervisedclustering of shapes, without loss of generality we will drop the superscript from the shape contourCiand its corresponding feature vectorfi, as in Figure 1, for the remainder
[image:6.595.171.437.303.406.2]2.3 Markov Matrix
A Markov random walk is defined on the graph by defining the state-transition matrixP = [pij], also known as the Markov matrix, with its(i,j)th elementpijgiven by,
pij =
w(fi,fj)
d(fi)
, (3)
whered(fi)denotes the degree of nodeiin the graph and is calculated as follows,
d(fi) =
∑
z∈Ωw(fi,z). (4)
It is worth noting that unlike most similarity matrices used in other manifold learning meth-ods, such as Isomaps Tenenbaum et al. [2000] and Laplacian eigenmaps Belkin and Niyogi [2003], this matrix is generally not symmetric.
2.4 Embedding in a Low-Dimensional Space
Let{λi}be the sequence of eigenvalues ofPsuch that|λ0| ≥ |λ1| ≥ · · ·, and{ψi}be the cor-responding eigenvectors. A mapping from the shape feature set Ωto a lower-dimensional Euclidean space <m, where m << n is the dimensionality of the lower-dimensional
sub-space, is given by (see Lafon and Lee [2006], Coifman and Lafon [2006] for details),
Ψ :f7−→(λ1ψ1(f),λ2ψ2(f), . . . ,λmψm(f)). (5)
The above mapping gives an initial low-dimensional embedding att = 1. Spectral fall-off is the main factor contributing to dimensionality reduction. The mappingΨevolves as time
t increases. The above mapping at time t > 1 can be computed by scaling the diffusion coordinatesψi(f),i=1, . . . ,m, withλti as follows Coifman and Lafon [2006],
Ψ(t)
:f 7−→ λt1ψ1(f),λt2ψ2(f), . . . ,λtmψm(f). (6)
For large value oft, large-scale structures in the data can be captured with fewer diffusion coordinates Coifman and Lafon [2006].
2.5 Clustering in the Embedding Space
Spectral graph embedding of shapes residing on a very high-dimensional manifold to a much lower-dimensional space using diffusion maps results in a set of elongated clusters, representing shapes of similar kinds, provided an appropriate value is chosen for the Gaus-sian kernel parameter e. We found that a mixture model representation of these clusters
is more effective than the standardk-means (kM) or fuzzyC-means (FCM) clustering algo-rithms. LetFi,i= 1, 2, . . . ,Ndenote embedding of the shape context feature vectors for all
shapes in a given dataset. Using the GMM, the probability mass function of an arbitrary feature vector’s embeddingFis given by,
P(F) = c
∑
j=1
where aj denotes weight of the jth Gaussian gj(F), whose mean vector µj and covariance
matrixΣkdetermine its position and shape. The parametersaj,µj, andΣjare estimated with
the help of EM. Using priorsaj and likelihood p(F|aj,µj,Σj)of an embeddingFfor thejth
Gaussian, its posterior probabilityp(j|F)can be computed. A labelkis assigned to the shape image corresponding toF, wherekmaximises the posterior,
k=argmax
j=1,2,...,c
p(j|F). (8)
In order to determine the number of clusters,c, we utilise the Bayesian information criterion (BIC), as suggested in Fraley and Raftery [1998]. Choosing a value ofc which maximises the BIC value for a range ofc ensures that the sum of squared errors between actual em-beddings and the emem-beddings estimated by GMM is minimised while penalising the model complexity.
3
Experimental Results
Our experimental dataset consisted of a subset of the MPEG-7 core experiment (CE) Shape-1 Part-B dataset and comprised of Shape-140 images of objects from seven classes (20 images per class):apple,car,carriage,device7,flatfish,guitar,teddy. Although the num-ber of classes chosen for our experiments is not very high, it is in agreement with other shape clustering studies found in the literature, such as Yankov and Keogh [2006]. As mentioned earlier in Section 2.1, 18, 000-dimensional shape context feature vectors were extracted per shape image in the dataset. These feature vectors were embedded in<10, a Euclidean space
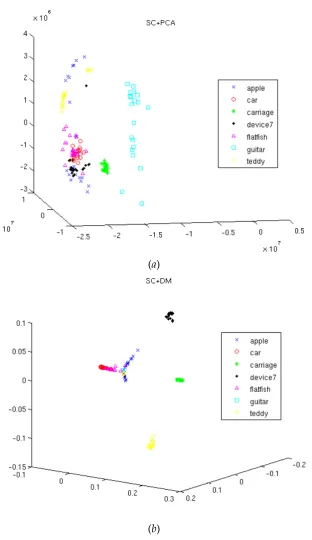
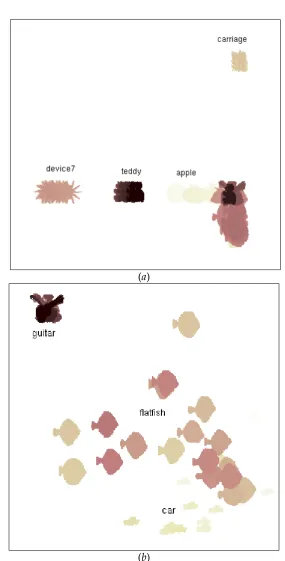
with only 10 coordinates, using both conventional linear projection with principal compo-nent analysis (SC+PCA) and diffusion maps (SC+DM). Figure 4 shows top three coordinates of the embeddings thus obtained. It can be seen from Figure 4(a) that while two of the seven classes, namelycarriageandguitar, are clearly separated using SC+PCA, the remain-ing classes are mixed up in the embeddremain-ing. This is in sharp contrast with Figure 4(b), which shows that most of the classes have not only well separated but also relatively compact clus-ters. In order to illustrate this point clearly, we also show in Figure 5 shape images overlaid onto their embedding using only top two diffusion coordinates. An embedding of this kind can be used for exploratory data analysis, when no prior knowledge about the different kinds of shapes is available, and visualisation of relationships between shapes belonging to different classes. In this Figure, it can be seen that SC+DM effectively separates at least four of the seven classes using just two diffusion coordinates. The remaining three classes (car,
flatfish, and guitar) that appear to be mixed up towards the bottom-right corner of
Figure 5(a) can also be separated to some extent, provided an efficient clustering method is employed. It can also be noted from both Figures 4 and 5 that the resulting clusters in the embedded coordinate space are not necessarily spherical in nature. Therefore, we employ a general elliptical Gaussian mixture model (GMM) in an unsupervised EM framework to assign class labels to all shapes in our dataset.
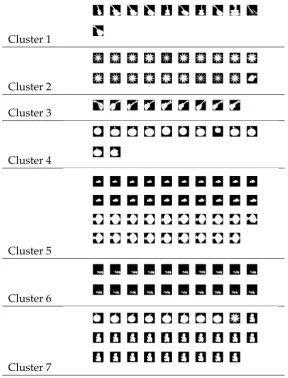
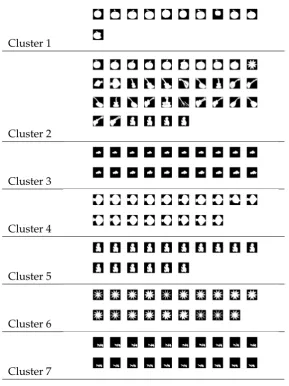
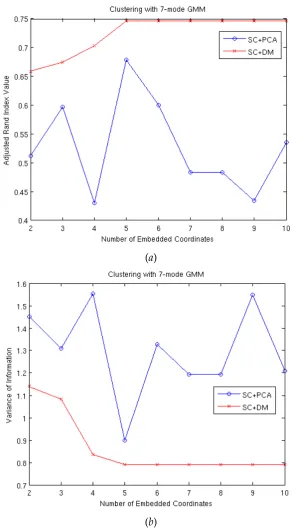
flatfish shapes (cluster 4), SC+DM effectively groups most of the shape images with the exception ofguitar (cluster 2). For an objective comparison, we use two clustering performance measures: adjusted Rand Index (aRI) Martinez and Martinez [2004], which is based on counting pairs of points found in same clusters in two clustering results and those found in different clusters in the two results, and variance of information (VI) Meil˘a [2007], which is an information theoretic metric for comparing two clustering results based on entropies and mutual information of the two associated random variables. A higher value of aRI means better grouping, whereas a lower value of VI implies better clustering. For both the performance measures, clustering results obtained by either of SC+PCA and SC+DM are compared to the ground truth labels. Performance curves with each of the measures plotted against the number of embedding coordinatesm with a fixed number of clusters (c = 7) for both SC+PCA and SC+DM are shown in Figure 8. From this Figure, it can be seen that SC+DM outperforms SC+PCA in terms of both the measures, achieving steady values at
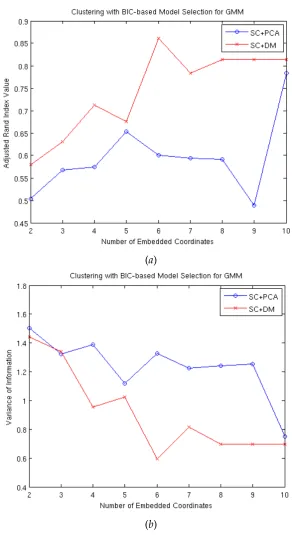
m=5 and suggesting that no further gains are made by adding more projected coordinates. The overall accuracy of SC+DM is 88.6% as compared to 72.9% for SC+PCA. When we utilise the BIC to determine the number of clusters for GMM, better clustering performance with a higher value of aRI and a lower value of VI than the steady-state values found in Figure 8 can be achieved, as shown in Figure 9. Withm =6, we get the minimum value for aRI and the maximum value for VI, suggesting perhaps that this may be the intrinsic dimensionality of the dataset. These results demonstrate the effectiveness of the proposed shape clustering method.
4
Conclusions
In this paper, we have extended the shape manifold learning framework presented in Ra-jpoot et al. [2007] to unsupervised clustering of shapes. The proposed clustering algorithm employs diffusion maps, a nonlinear dimensionality reduction method, to embed the fea-ture vectors of shapes in a given dataset onto lower-dimensional spaces. An unsupervised clustering of the embedding employs the Bayesian information criterion (BIC) to determine the number of clusters and is shown to effectively reveal the prevalent groups of shapes in the dataset. The proposed method is also shown to be significantly more sensitive than PCA for grouping together shapes that may be considered relatively difficult. The method is yet to be tested for a relatively large dataset with large number of classes. Since solving the eigenvalue problem for a large matrix can be highly demanding in terms of computational power and storage requirements, Nyström’s extension can be employed for embedding the shape context feature vectors Lafon et al. [2006]. To the best of our knowledge, selection of kernel width e for diffusion maps is an open question. Finding a suitable answer to this
question and investigating robustness of the proposed algorithm to noise are some of the future directions for this work.
References
M. Belkin and P. Niyogi. Laplacian eigenmaps for dimensionality reduction and data repre-sentation. Neural computation, 15(6):1373–1396, 2003.
contexts. Pattern Analysis and Machine Intelligence, IEEE Transactions on, 24(4):509–522, 2002. URL http://ieeexplore.ieee.org/xpls/abs_all.jsp%3Farnumber%
3D993558.
Serge Belongie, J. Malik, and J. Puzicha. Matching shapes. InProceedings International Con-ference on Computer Vision, volume 1, pages 454–461, July 2001.
F.L. Bookstein. Size and shape spaces for landmark data in two dimensions. Statistical Sci-ence, 1(2):181–242, 1986. URLhttp://www.jstor.org/stable/2245441.
Anders Brun. Manifolds in Image Science and Visualization. PhD thesis, Linköping University, Department of Biomedical Engineering, 2007.
R. Coifman and S. Lafon. Diffusion maps. Applied and Computational Harmonic Analysis, Special Issue on Diffusion Maps and Wavelets, 21:5–30, July 2006.
T. Cootes, D. Cooper, C. Taylor, and J. Graham. Active shape models – their training and applications. Computer Vision and Image Understanding, 61(1):38–59, 1995.
P. Etyngier, F. Segonne, and R. Keriven. Shape priors using manifold learning techniques. In
International Conference on Computer Vision (ICCV), pages 1–8, 2007.
C. Fraley and AE Raftery. How many clusters? Which clustering method? Answers via model-based cluster analysis.The Computer Journal, 41(8):578–588, 1998.
D.G. Kendall. Shape manifolds, procrustean metrics,and complex projective spaces. Bul-letin of the London Mathematical Society, 16(2):81–121, 1984. URLhttp://intl-blms.
oxfordjournals.org/cgi/content/abstract/16/2/81.
E. Klassen, A. Srivastava, W. Mio, and S.H. Joshi. Analysis of planar shapes using geodesic paths on shape spaces.IEEE Transactions on Pattern Analysis and Machine Intelligence, 26(3): 372–383, March 2004. URL http://ieeexplore.ieee.org/xpls/abs_all.jsp?
arnumber=1262333.
S. Lafon, Y. Keller, and RR Coifman. Data fusion and multicue data matching by diffusion maps.IEEE Transactions on Pattern Analysis and Machine Intelligence, 28(11):1784–1797, 2006.
S. Lafon and A.B. Lee. Diffusion maps and coarse-graining: A unified framework for dimen-sionality reduction, graph partitioning, and data set parmeterization. IEEE Transactions on Pattern Analysis and Machine Intelligence, 28(9):1393–1403, September 2006.
M. Leventon, E. Grimson, and O. Faugeras. Statistical shape influence in geodesic active contours. InProceedings International Conference onComputer Vision and Pattern Recognition (CVPR), pages 316–323, 2000.
W.L. Martinez and A.R. Martinez. Exploratory data analysis with MATLAB. Chapman & Hall/CRC, 2004.
M. Meil˘a. Comparing clusterings£an information based distance. Journal of Multivariate Analysis, 98(5):873–895, 2007.
N. Rajpoot, M. Arif, and A. Bhalerao. Unsupervised learning of shape manifolds. In Proceed-ings British Machine Vision Conference (BMVC’2007), pages 312–321, September 2007. URL
http://www.dcs.warwick.ac.uk/~nasir/papers/bmvc07a.pdf.
J.B. Tenenbaum, V. Silva, and J.C. Langford. A global geometric framework for nonlin-ear dimensionality reduction. Science, 290(5500):2319–2323, 2000. URL http://www.
sciencemag.org/cgi/content/abstract/290/5500/2319.
L.J.P. van der Maaten, E.O. Postma, and H.J. van den Herik. Dimensionality reduction: A comparative review. Submitted to Neurorecognition, 2008.
D. Yankov and E. Keogh. Manifold clustering of shapes. InProceedings International Confer-ence on Data Mining (ICDM), pages 1167–1171, 2006. URLhttp://ieeexplore.ieee.
org/xpls/abs_all.jsp?arnumber=4053173.
(a)
[image:12.595.147.460.141.682.2](b)
Figure 4: Embeddings of the SC feature vectors using top 3 coordinates of (a) PCA and (b
(a)
(b)
[image:13.595.157.443.100.662.2]Cluster 1
Cluster 2
Cluster 3
Cluster 4
Cluster 5
Cluster 6
[image:14.595.159.448.232.611.2]Cluster 7
Cluster 1
Cluster 2
Cluster 3
Cluster 4
Cluster 5
Cluster 6
[image:15.595.159.449.228.615.2]Cluster 7
(a)
[image:16.595.150.443.141.670.2](b)
(a)
[image:17.595.150.443.139.675.2](b)