Abstract—This paper presents an application of Monte
Carlo Simulation Method (MCSM) for reliability evaluation of a laboratory-based Micro Grid (LMG) by using of system health, marginal and risk which are the basic system well-being indices. The system well-being analysis is a new approach to evaluate power system reliability. MCSM applied for reliability evaluation of a LMG gives the results not only numerically but also graphically which ensure the opportunity to view the system state more precisely. It is easily understood the failure or derated situation of single generator, or fault in system network. Based on the performed simulation, a laboratory-based Micro Grid reliability evaluation has been obtained on well-being indices and showed its significant efficient by the results.
Index Terms—Micro Grid reliability, Monte Carlo
Simulation, renewable energy resources, well-being analysis
I. INTRODUCTION
he next generation of power systems must change and adapt to environmental factors, customer concerns, and reliability issues. As an environment problem of the global warming, clean energy like wind and solar power can be considered as viable options for future electricity generation, and customer-central concerns will be a driving force for new concepts in demand participation. Additionally, the recent and ongoing challenges related to blackouts and power quality problems are required a new concept of Micro Grid for future electric power supply. A laboratory-based Micro Grid composed of renewable energy resources, wind and solar, diesel generator and storage battery with a constant electrical load is proposed in this study for reliability evaluation.
The utilization of renewable energy resources in the new competitive electric power marketing has gained a great attention in recent years due to the economic and environmental concerns over fossil fuel based! consumption of the electric power system. However, a Micro Grid which composed of renewable energy resources such as wind and solar power generation is not stable and reliable as for as a power supply system, since their generations are influenced by the weather conditions. The
Manuscript received December 30, 2009, revised January 25, 2010. Su Youli is with the Department of Electrical & Electronics Engineering, Tokyo University of Agricultural and Technology, Tokyo 184-8588, Japan (e-mail: suyouli2008@ hotmail.com).
Ken Nagasaka is with the Department of Electrical & Electronics Engineering, Tokyo University of Agricultural and Technology, Tokyo 184-8588, Japan (e-mail: [email protected]).
behavior of Micro Grid should be characterized by the random variables of which the
number increases in proportion to the number of renewable energy resources in the system. There are needed a new approach to assess the reliability of Micro Grid by utilizing of wind and solar power generation as well as diesel generator with storage battery in different configuration for future electric power supply requirement with reliability.
In the last few decades, the power system operators and isolated system planners are used to deal with analytical technique instead of probabilistic method due to the difficulty of interpret a single numerical risk index, such as loss of energy expectation (LOEE) and the lack of system information in a single risk index. System well-being analysis is a new approach which provides a bridge between the deterministic and the conventional probabilistic method that has been successfully used for reliability evaluation of a small system with a constant load using a contingency enumeration approach [1], [2].
In this paper, a Monte Carlo Simulation Method applied for the reliability evaluation of a laboratory-based Micro Grid by using of the system well-being indices is presented. The simulation results show not only numerically but also graphically which ensure the opportunity to view the Micro Grid system states more precisely with easily understood the failure situations of the given laboratory-based Micro Grid.
II. RELIABILITY EVALUATION OF A LABORATORY-BASED MICRO GRID
A conventional deterministic method cannot be used to evaluate a Micro Grid reliability because the technique of the deterministic method associate fixed capacity outputs to generating units, however, the wind and solar power generation which included in a Micro Grid have highly fluctuating capacity outputs. Deterministic methods cannot recognize the random behavior of the system. There are needed a new evaluation method which combined the both of probabilistic and deterministic methods to response these complexities for a Micro Grid reliability evaluation. Submit your manuscript electronically for review.
A system well-being analysis is a new approach which satisfied the conditions mentioned above that to evaluate a laboratory-based Micro Grid reliability using system health, marginal and risk indices are described in the following section.
Monte Carlo Simulation Method Used in
Reliability Evaluation of a Laboratory-based
Micro Grid
Su Youli and Ken Nagasaka, Member, IEEE
T
8760 ) ( ) (
) (
1 × =
∑
=N M t M P
M n
i i
8760 ) (
) (
1 × =
∑
= NR t LOLP
R n
i i
8760
) (
1 × =
∑
=N U EENS
R n
i i
A. Micro Grid system model with well-being Indices A model for reliability evaluation of a Laboratory-based Micro Grid consisting of wind, solar power generation and diesel generator (DG) with storage battery is shown in Fig.1. The performance of the LMG can be monitored using well-being analysis that combines deterministic consideration and probabilistic indices. The LMG reliability can be considered in one of the operating states to be designated as health, marginal and risk states. Reliability of a LMG can be obtained by calculating the well-being indices of health, marginal and risk and some related indices of frequency and duration (F&D).
A system operates in the health state, when it has enough capacity reserve to meet a deterministic criterion such as the loss of the largest unit (total capacity in LMG minus Capacity of the Largest Unit in each contingency State (CLUS)). A system operates in the marginal state is show that the system still has the ability to provide the system requirements, but there is no longer sufficient margin to meet the specified the deterministic criterion. In the risk state, the generating system has an inability to satisfy the load requirements, it is means that the system load exceeds the available capacity in the at risk state.
Fig.1. Model for reliability evaluation of a LMG
The Probability of health P(H), Probability of margin P(M) and Probability of risk P(R), are the probabilities of finding the system in the health, marginal and at risk states respectively. The probability of risk is the conventional loss of load probability (LOLP) which is one of the main reliability indices we want to calculate in this study. The probabilities of health, margin and risk are collectively known as the basis well-being indices can be calculated using MCSM for a LMG reliability evaluation.
B. Monte Carlo Simulation Method for a laboratory-based Micro Grid reliability evaluation
There are two main categories of power system reliability evaluation techniques: analytical and simulation. Analytical techniques represent the system by analytical models and evaluate the reliability indices from these models using mathematical solutions. MCSM estimate the reliability
indices by simulating the actual process and random behavior of the system. The method, therefore, treats the problem as a series of experiments. Analytical method is usually restricted to the evaluation of expected values and a limited range of system parameters. However, there is a frequently a need to know the likely range of the reliability indices, especially, for a Micro Grid system which supply the electricity power to the customers need to know the system’s adequacy of each time therefore to meet a required electricity power supply with reliability.
MCSM can be used to evaluate the well-being indices for a LMG and represent the system states and behavior by simulating the actual process and random behavior of the system. For this purpose, a Monte Carlo Simulation model is modified for a LMG reliability evaluation are proposed and presented by using of system well-being indices. In the approach of MCSM, a LMG is modeled by a set of events where, an event is a random or deterministic occurrence that changes the state of the system. The events recognized by the program “system well-being index computation” and simulation model are the change in load, mean time to failure (MTTF), mean time to repair and the forced outage rate (FOR) of a generating unit. Each system state is characterized in terms of the available margin, which is the difference between the available capacity and the load. C. Reliability Evaluation
Section I: Calculation of reliability indices
A LMG proposed in this study for reliability evaluation has 20 generating units and a total of 2900kW capacity outputs with a constant load. In order to applying a MCSM for a LMG reliability evaluation, a Monte Carlo simulation is modified to include all of the energy sources of the given LMG with storage battery. The Annual peak load used for load calculation is given as 2850kW. The available power from all the generating units of the given LMG are combined to create a generation model, which is compared with the hourly load and the accepted deterministic criterion to identify the system health, marginal and risk states. The system health P(H) and margin P(M); The Loss of Load Probability (LOLP) and Expected Energy Not Supplied (EENS) can be calculated by following (1)-(4) [3, 4]:
(1)
(2)
(3) 8760
) ( ) (
) (
1 × =
∑
=N H t H P
H n
(4) Where,
: )
(H i
t Duration for the ithhealthy states
: )
(M i
t Duration for the ithmarginal states Duration for the ithrisk states
: )
(H
n Total number of healthy states :
) (M
n Total number of marginal states :
) (R
n Total number of risk states
:
i
U Unsupplied energy for duration t(R)i
:
N Total number of simulated years
Section II: Calculation of frequency and duration indices Generally, the analytical methods for evaluating the frequency and duration indices is relatively complex and mathematical methods used are usually a simplification of the actual system. However, these indices can be easily estimated by the MCSM and gives the results as distribution. This is different with the analytical methods which gives the results as single as the expected values. The frequency of health F(H), frequency of marginal F(M) and frequency of risk F(R) states of the proposed a LMG can be expressed as (5)-(7) respectively. Similarly, the duration of health D(H), the duration of marginal D(M) and the duration of risk D(R) can also be expressed and calculated by the Monte Carlo simulation method.
(5) (6)
(7)
III. SIMULATION RESULTS
The generating units in the laboratory-based Micro Grid with their reliability input data are given in Table I. The rating capacity of wind power generations are given as 6×320kW and 2×270kW, the rating capacity of solar power generation is given as 8×30kW and the generations from wind and solar are respectively managed based on the climate data such as wind speed and irradiation data recorded for one year time; the rating capacity of diesel generator is given as 2×120kW with a size of 2×250kW NAS battery for an electricity back-up in the LMG system. The annual weekly peak load curve is shown in Fig.2.
TABLE!I
[image:3.595.310.543.70.182.2]!!RELIABILITY DATA USED IN THE LMG RELIABILITY EVALUATION
Fig.2. Annual weekly peak load curve
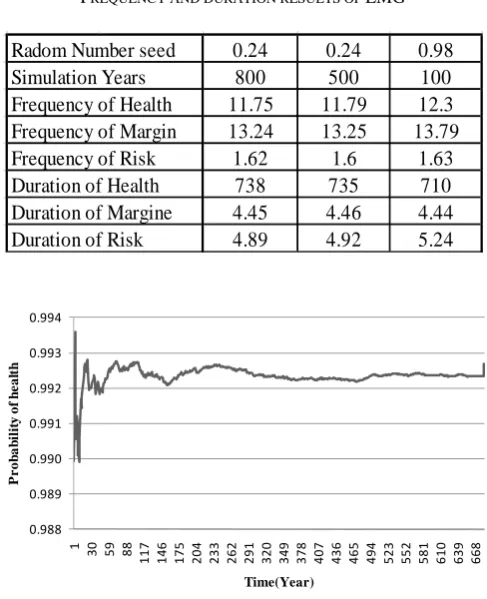
Table II shows the results of the LMG reliability. Table III shows the frequency and duration of the LMG applied for the MCSM. The probability of health states, probability of marginal states and probability of risk states of the proposed Laboratory-based Micro Grid are simulated by MCSM as shown in Fig.3, Fig.4 and Fig.5 respectively.
TABLE II
SIMULATION RESULT OF LMG RELIABILITY EVALUATION
TABLE III
[image:3.595.305.549.456.756.2]FREQUENCY AND DURATION RESULTS OF LMG
Fig.3. Health state probability of LMG
: )
(R i
t
0.0 500.0 1000.0 1500.0 2000.0 2500.0 3000.0
1 3 5 7 9 111315171921232527293133353739414345474951
A
n
nua
lw
e
e
ly
pe
ak
Loa
d
(kW
)
Time(weekly)
Radom Number seed 0.24 0.24 0.98
Simulation Years 800 500 100
Probability of Health 0.9923 0.9923 0.9921
Probability of Margin 0.0067 0.0068 0.0069
0.0009 0.0009 0.0010
EENS (kWh/h) 0.1141 0.1142 0.1465
LOLP
0.24 0.24 0.98
800 500 100
11.75 11.79 12.3
13.24 13.25 13.79
1.62 1.6 1.63
738 735 710
4.45 4.46 4.44
4.89 4.92 5.24
Radom Number seed Simulation Years Frequency of Health Frequency of Margin Frequency of Risk
Duration of Risk Duration of Health Duration of Margine
0.988 0.989 0.990 0.991 0.992 0.993 0.994
1 30 59 88
11
7
14
6
17
5
20
4
23
3
26
2
29
1
32
0
34
9
37
8
40
7
43
6
46
5
49
4
52
3
55
2
58
1
61
0
63
9
66
8
P
r
ob
a
b
il
it
y of
h
e
al
th
Time(Year)
N H n H
F( )= ( )/
N M n M
F( )= ( )/
N R n R
F( )= ( )/
[image:3.595.54.288.702.781.2]Fig.4. Marginal state probability of LMG
Fig.5. Loss of load probability of LMG
IV. CASE STUDIES
We consider a normal and un-normal case of the Laboratory-based Micro Grid fluctuated by the load changes. The capacity of wind and solar power generation are considered as 60kW and 30kW respectively. The capacity of diesel generator is considered as 53kW. The annual weekly peak load is 130kW. By the simulation result, Fig.6 shows a normal case (base case) of the distribution of probability at health state of the LMG, Fig.7 and Fig.8 shows the base case of the distribution of frequency and duration at health state of the LMG respectively. Fig.9 shows the distribution of the expected energy not supplied at health state of the laboratory-based Micro Grid in normal case.
Fig.6. Distribution of probability at health state of LMG Fig.10 shows the distribution of probability at marginal state of the LMG, Fig.11 and Fig.12 shows the distribution of frequency and duration at marginal state of the LMG respectively.
Fig.7. Distribution of frequency at health state of LMG
Fig.8. Distribution of duration at health state of LMG
Fig.9. Distribution of the EENS at health state of LMG
Fig.10. Distribution of probability at marginal state of LMG When the laboratory-based Micro Grid operates in isolation, load tracking problem will arise because diesel generator respond slowly and are inertia-less. For a conventional power system, while a new load comes on line, the initial energy balance is satisfied by the system’s inertia,
0.000 0.002 0.004 0.006 0.008 0.010 0.012
1 30 59 88
11
7
14
6
17
5
20
4
23
3
26
2
29
1
32
0
34
9
37
8
40
7
43
6
46
5
49
4
52
3
55
2
58
1
61
0
63
9
66
8
P
r
ob
a
b
il
it
y
of m
a
rg
in
Time(Year)
0.0000 0.0002 0.0004 0.0006 0.0008 0.0010 0.0012 0.0014
1 30 59 88
117 146 175 204 233 262 291 320 349 378 407 436 465 494 523 552 581 610 639 668
L
o
ss
of
L
o
ad
Prob
a
b
il
it
y
Time(Year)
0.0% 5.0% 10.0% 15.0% 20.0% 25.0% 30.0% 35.0% 40.0%
Fre
q
u
e
n
c
y(
%
)
P(H)
0.0% 10.0% 20.0% 30.0% 40.0% 50.0% 60.0%
Fr
e
q
u
e
n
c
y
(%
)
F(H)
0.0% 10.0% 20.0% 30.0% 40.0% 50.0% 60.0%
F
r
e
q
ue
nc
y
(%
)
D(H)
0.0% 5.0% 10.0% 15.0% 20.0% 25.0% 30.0%
F
r
e
q
ue
nc
y
(%
)
EENS(kWh/y)
0.0% 10.0% 20.0% 30.0% 40.0% 50.0% 60.0%
F
req
u
e
n
c
y
(%
)
which results in a
slight reduction in system frequency. However, for a Micro Grid, it cannot rely on generator inertia and must provide some from storage to insure initial energy balance. In an un-normal case, we considered a possible situation of the laboratory-based Micro Grid that fluctuated by the load changes while the load increased from 10% to 40%.
Fig.11. Distribution of frequency at marginal state of LMG
Fig.12. Distribution of duration at marginal state of LMG For the un-normal case, the simulation result shows that when the load increased from 10% to 20% of the given load, the laboratory-based Micro Grid will be in a marginal state and when it is increased in 40% of the given load, the laboratory-based Micro Grid will be in a risk state. Fig.13 shows the probability of margin, health and risk state of the LMG when the load increased from 10% to 40%. Fig.14 shows the duration of margin and risk state of the LMG when the load increased from 10% to 40%.
For take a supply and demand balance of the LMG, we used NAS battery for electricity energy back up that to insure energy balance when the load increased. Fig.15 shows the reliability index, EENS (kWh/yr) of the LMG using the NAS battery in three case studies.
In the case studies, case1 shows the base case of the LMG which have mentioned in this section and case2 shows the system capacity of wind and solar power generation are 60kW and 30kWØ 2 respectively. The capacity of diesel generator is considered as 53kWØ 2 and the NAS battery is given as 50kWØ 2.
Table IV shows the reliability evaluation of the case studies. From the results, we can know that by installing the
NAS battery to the LMG, the loss of load probability will be improved from 0.08 to 0.0005 and the expected energy not supplied will be down from 13127.2(kWh/yr) to 63.2(kWh/yr) when the annual load increased 40% of the given load, respectively.
Fig.13. Probability of margin, health and risk state of the LMG when load increased from 10% to 40%
Fig.14. Duration of the margin and risk state of the LMG when load increased from 10% to 40%
Fig.15. Expected Energy Not Supplied with load growth
TABLE IV
RELIABILITY EVALUATION OF THE CASE STUDIES
0.0% 2.0% 4.0% 6.0% 8.0% 10.0% 12.0% F r e que nc y (% ) F(M) 0.0% 10.0% 20.0% 30.0% 40.0% 50.0% 60.0% F r e que nc y (% ) D(M) 0.00 0.05 0.10 0.15 0.20 0.25 0.30 0.35 0.40 0.64 0.64 0.64 0.65 0.65 0.65 0.65 0.65 0.66 0.66 0.66
1 14 27 40 53 66 79 92
10 5 11 8 13 1 14 4 15 7 17 0 18 3 19 6 20 9 22 2 23 5 24 8 C o m p ar e o f H e al th M a rg in & R is k St a te
P(M)_40%Load P(H)_40%Load P(R)_40%Load
0.00 2.00 4.00 6.00 8.00 10.00 12.00 14.00 16.00 18.00 18.20 18.40 18.60 18.80 19.00 19.20 19.40 19.60
1 15 29 43 57 71 85 99
113 127 141 155 169 183 197 211 225 239 253
D u ra ti on at th e m a rg in & ri sk stat e w h e n l o ad i n cre as ed 40 % D(M)_40%Load D(R)_40%Load Case1: 2396 Case2: 13127 Case3: 63 0 2000 4000 6000 8000 10000 12000 14000 16000
1 12 23 34 45 56 67 78 89
10 0 11 1 12 2 13 3 14 4 15 5 16 6 17 7 18 8 19 9 21 0 22 1 23 2 24 3 Ex p e ct e d En e rg y Not Su pp lie d(kW h /y
r) Case1 NAS: 0kW, Base case Case2 NAS: 0kW, Load40% increased Case3 NAS: 50kW, Load40% increased
V. CONCLUSION
The rapid growth of renewable energy resources utilization and the great potential for future use in electricity power supply, required and needed a seriously consider for make sure of the supply reliability of a given system. In this paper, a reliability evaluation of a laboratory-based Micro Grid consisting of renewable energy resources such as wind, solar and diesel generator with storage battery is proposed by a Monte Carlo Simulation method which using the system well-being analysis.
System well-being index computation provides a bridge between the deterministic and probabilistic methods and defines indices that can be useful in a practical Micro Grid reliability evaluation. It is can be very useful for those situations in which the conventional probabilistic methods have not been accepted and the deterministic techniques are still applied such as a Micro Grid system. A laboratory-based Micro Grid makes it possible and implement by using the well-being approach not only numerically but also graphically showing the actual features of the proposed laboratory-based Micro Grid reliability.
REFERENCES !
[1] M. Tanrioven, “Reliability and cost-benefits of adding alternate power sources to an independent micro-grid community,” Journal of Power Sources, Vol.150, pp.136-149, Jun. 2005.
[2] R. Billinton and R. Karki, “Application of Monte Carlo simulation to generating system well-being analysis,” IEEE Transactions on Power System, Vol.14, No.3, pp.1172-1177, Aug. 1999.
[3] R. Karki and R. Billinton, “Reliability/ cost implication of PV and wind energy utilization in small isolated power systems, IEEE Transactions on Energy Conversion, Vol.16, No.4, Dec. 2001. [4] R. Billinton and R. Ghajar, “Utilization of Monte Carlo simulation in
generation system adequacy evaluation,” CEA, Mar. 1987.
[5] Y. G. Hegazy, M. M. A. Salam and A. Y. Chikhani, “Adequacy assessment of distributed generation system using Monte Carlo simulation,” IEEE Transactions on Power Systems, Vol.18, No.1, Feb.2003.
Reliability Evaluation Case1 Case2 Case3
LOLP 0.017 0.08 0.0005
EENS(kWh/yr) 2396.6 13127.2 63.2