Optimization Analysis of the Experimental
Parameters on the Extraction Process of
Propolis
Ming-Jyi Jang, Shane-Rong Sheu, Cheng-Chi Wang, Yen-Liang Yeh, and Kun-Huei Sung
phones, television and satellite applications, therefore the Federal Communications Commission agreement states that two frequencies of 0.915 and 2.45GHz are specifically used for microwave heating in order to avoid interference with communications [6]. Microwaves can be used to heat water molecules. When microwaves stimulate molecules they promote molecular rotation and create kinetic energy which in turn releases heat or other forms of energy. As different materials have different dielectric constants, dielectric loss factors, heat and water contents, and different reflection and absorption characteristics in terms of subjection to microwave they can be selectively manipulated through microwave heating. These differential characteristics allow selective heating of the target material while allowing other components to be used as coolant during material processing.
Abstract—This research uses propolis as the raw material. To
study the microwave-assisted extraction technique in combination with a shearing mechanism that is adopted to increase the rate of contact between the solvent and extractive. The shearing mechanism is applied to accelerate the fracturing of the botanic cell walls on plant fiber. And, the integrated circulation system ensures the operating temperature controlled.
Index Terms—microwave 、extraction 、propolis
I. INTRODUCTION
icrowave-assisted extraction (MAE) is a new extraction process method [1]. It uses microwave energy to heat a solvent which contacts the extract. The extract within the base material then attaches to the solvent. This method is characterized by rapid and uniform heating of the extract and solvent, and involves an extraction time of about 15-30 minutes [2]. These quantities are about 10 times smaller than volumes used by traditional extraction techniques, and significantly reduce extraction costs. In addition the microwave-assisted method is also used in environmental analysis [3], dry samples [4], microwave leaching [5] and other fields.
M
The traditional MAE uses microwave heating methods. Specifically this involves electromagnetic energy transmission by radiation. This method allows the heat to be applied directly to the solution or the materials without having to be transferred from the container. This significantly shortens the time required to complete the extraction process. To put it simply, microwave energy heats the solvent directly which is already in direct contact with the sample base material. However, high temperatures can easily degrade the active ingredients during this process. This is compensated for by the addition of a temperature control module that can accurately maintain the specified necessary temperature.
Microwave energy is an electromagnetic radiation with wavelengths between 1mm to 1m and frequencies in the range of 300 MHz to 300 GHz. This range is most used as the
frequency for communications, in particular the radar, cell Propolis is a substance produced by bees. It is made from elements of specific plant buds or bark juice which are mixed with bee secretions, pollen and beeswax. It has a gun like consistency and can be used to inhibit the reproduction of micro-organisms and the maintenance of an aseptic cellular state [7]. In addition, propolis contains many other natural ingredients: including gum (resin), wax, essential aromatic oils, pollen, various other substances and organic debris. Propolis does not dissolve in water, but is easily soluble in ethanol solution. Burdock [8] found that the main ingredient within the class of Propolis Flavonoids, have the ability to target and destroy cancer cells as well as strengthen the immune system.
Ming-Jyi Jang is with the Department of Automation and Control Engineering, Far East University, Taiwan (corresponding author to provide phone: 886-6-5979566 ext 7223; fax: 886-6-5977115; e-mail: [email protected]).
Shane-Rong Sheu is with the Department of Automation and Control Engineering, Far East University, Taiwan (corresponding author to provide phone: 886-6-5979566 ext 7991; fax: 886-6-5977990; e-mail: [email protected]).
Cheng-Chi Wang is with the Department of Mechanical Engineering, Far East University, Taiwan (corresponding author to provide phone: 886-6-5979566 ext 7211; fax: 886-6-5977115; e-mail: [email protected]).
Yen-Liang Yeh is with the Department of Automation and Control Engineering, Far East University, Taiwan (corresponding author to provide phone: 886-6-5979566 ext 7275; fax: 886-6-5977115; e-mail: [email protected]).
Flavonoids are the largest single substance in a propolis sample. They make up between of 30-40% of propolis. Flavonoids including flavones, flavonols, flavanones and
that offer the substantial pharmacological and antioxidant properties [9]. Flavonoids compounds have anti-oxidation properties in that they remove free radicals, reduce blood pressure and reduce vessel thrombosis. In addition, the caffeic acid phenethyl ester of Propolis also has anti-cancer[10], virus inhibiting, anti-oxidant, anti-inflammatory, and hypoxic brain injury prevention properties.
Some common Propolis extraction methods are the ethanol extraction method, back extraction method and acetone extraction method.The ethanol method is relatively simple, and doesn’t require a high operating temperature.Although there is some volatile activity and the effective loss of flavonoids is not easy to control, the limited extraction time reduces these effects [11]. Back extraction takes less time and the extraction rate rises with a rise in temperature, however, with an increase in temperature some of the active components or flavonoids can be destroyed. The acetone method uses a solution of 70% acetone to 30% water to extract flavonoids. Although this is a very effective method it is not common because of the more expensive price of the solvent and is not used in food production because the process leaves a residual solvent.
This experiment will compare the extraction methods of the major components of propolis. Specifically it will explore the efficacy of various MAE conditions on the concentrations of ingredients within an extract.
II. METHOD OF EXPERIMENT
This experiment uses microwave energy to speed up the rotation and vibration of the polar molecules (water-soluble components) of a base material. This process further accelerates the solvent’s ability to quickly dissolve in the solution. Together these properties increase the extraction rate. The process also involves an accurate temperature control of the circulatory system in order to avoid destruction of active ingredients. The process is further enhanced by a mechanical shearing module which uses physical force to fracture the plant fiber’s cell walls. This speeds up the dissolution of the cells’ active ingredients within the solution. The double affect obtained by the use of microwave energy in combination with a shearing mechanism, significantly increases the efficiency of the mixing of non-polar and polar components during the extraction process.
A. Materials of the Experiment:
TABLEI
MATERIAL TABLE OF EXPERIMENT
Type
Project
Material Name Material Varieties
1 Propolis Brazil
2 Ethanol 95%(Food Level)
B. Equipment of Experiment:
TABLEII
EQUIPMENT TABLE OF EXPERIMENT
Type
Project
Equipment Name Equipment Model
1 Microwave Module RE-0902R
2 Shear Module DIAX900
3 Temperature Control
Module MU-02-110
RI Delector HITACHI L-2490
Diode Array
Delector HITACHI L-2450
Column Over HITACHI L-2300
Auto Sampler HITACHI L-2200 4 HPLC
Pump HITACHI L-2130
C. Structure of Extraction System:
This experiment used an extraction system of three main modules, including(1)Microwave Module(2)Shear Module
(3)Temperature Control Module. Its functions are as follows:
(1)Microwave Module: This includes a magnetron capable of producing microwaves of 2450 MHz at a maximum of 800 Watts. Through this process electrical energy produces microwaves in the magnetron which are then focus on the metal wall of the furnace. These microwaves are then reflected within the metal chamber and evenly heat the extract and solvents to the required temperature. Using glass vessels, that do not restrict microwave penetration, allows polar molecular rotation, vibration and molecular inter collision to further speed up the extraction effect.
(2)Shear Module: This motor-driven component uses a moving Shear Module. It is comprised of an internal moving rotor, and a fixed external stator, as show in Figure 2. The difference in speed between the fixed stator and spinning rotor create a great shear. In addition to making the solution more uniform it also generate tremendous effect on the flow. This further increases the extraction speed. An additional benefit is that the rotor generated flow field makes the microwave generated heat more evenly distributed throughout the solution. A uniform temperature throughout the mixture means a more accurate temperature control.
Fig. 1 Schematic of Extraction System Equipment
Fig. 2 Shear Module
D. Process of Experiment:
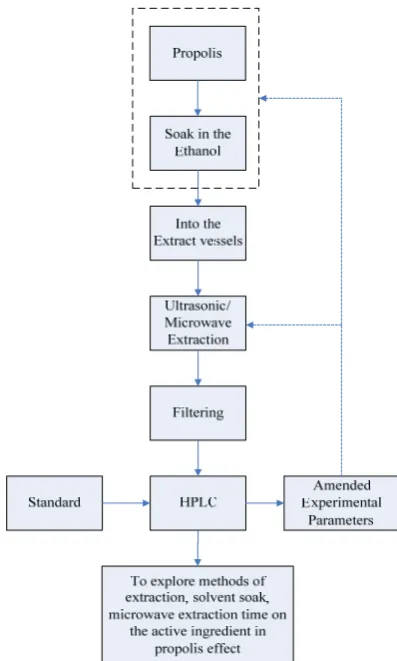
This experiment used propolis soaked in ethanol as a base solution for extraction. The ethanol/propolis is mixed to a ratio of 1 gram of propolis to 9 cc of ethanol. For this experiment the propolis/ethanol solutions were then saturated for either 12 hours or 14 days. The solutions were then placed in the extract vessels and subjected to the ultrasonic and microwave-assisted extraction methods shown in figure 3. The extract is then filtered before an HPLC analysis is conducted. The parameters of the experiment were set by processing a standardized propolis solution with known quantities of Artepillin C, CAPE, Quercetin and Rutin. Then, HPLC is analyzed for the quantity of compared with standard samples these active ingredients, Process of Experiment shown in Figure 4.
Propolis : Ethanol 1:9
Microwave Extraction 15 minutes (Sample No.5) Ultrasonic
Extraction 3 hours (Sample
No.2)
Microwave Extraction 15 minutes (Sample No.3) Propolis
Mixture Without Extraction (Sample No.1)
Microwave Extraction 30 minutes (Sample
No.4)
Microwave Extraction 30 minutes (Sample
[image:3.595.53.277.55.199.2]No.6) Soak 12 hours Soak 12 hours Soak 14 days Soak 14 days Soak 12 hours Soak 12 hours
Fig. 3 Conditions of Experiment
Fig. 4 Process of Experiment
III. RESULTS AND DISCUSSION
A. Analysis of HPLC:
[image:3.595.36.288.548.658.2]Minutes
0 10 20 30 40 50 60
0 10 20 30 0 10 20 30 CA P E Ar te p ill in C
Multi-Chrom 1 (1: 320 nm, 4 nm) 1-D100-2008-8-10 ? ? 10-21-53.dat
Name
(a)
Minutes
0 10 20 30 40 50 60 0 25 50 0 25 50 Ru tin Qu e rc e ti n
Multi-Chrom 2 (2: 260 nm, 4 nm) 1-D100-2008-8-10 ? ? 10-21-53.dat
Name
(b)
Fig. 5 Chromatogram of Propolis Mixture
B. Comparison of Ultrasonic and Microwave extractions:
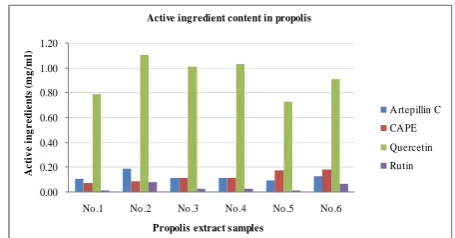
Fig.6-9, show that sample no.2 generated a higher concentration of active ingredients than sample no.1. However, the component of CAPE in samples no.3-4 and no.5-6 by MAE process produce a concentration of ingredients that are 1.2 and 2 times greater than the sample no.2 by ultrasonic extraction process. Also, the time of extraction is 11 times less than sample no.2. These results illustrates dramatically that MAE process for extracting CAPE is much more efficiency.
C. The influence of Soaking time on the Active Ingredient
concentration:
After being subjected to the same 15-minute MAE process, our two samples that had been soaked for either 14 days or 12 hours gave the following results respectively: the Artepillin C concentrations were 0.1123 and 0.0943 mg/ml; the CAPE concentration were 0.1128 and 0.1784 mg/ml; the Quercetin concentration were 1.0083 and 0.7282 mg/ml, the Rutin concentration were 0.0285 and 0.011 mg/ml. Other than the results for CAPE, the remaining ingredients which were soaked for 14 days indicated a higher concentration of extract. A longer soaking time before processing for the extraction of the active ingredients in most cases has a positive impact on the concentration levels.
As shown in Figure 7, after being soaked for 14 days the MAE process actually results in a lower concentration of CAPE than that of the sample that was only soaked for 12 hours. These results might be explained by the break down and dissolution of CAPE during a longer soaking time. This illustrates that the process component extraction requires a careful consideration of the soaking times which are dependant on the components being extracted.
D. The effect of time by MAE for Active Ingredient
[image:4.595.41.282.59.295.2]concentration:
Figure 6, 7, 8, and 9 illustrate the concentrations of Artepillin C, CAPE, Quercetin and Rutin, respectively. (the conditions under which each sample was processed are noted in Figure 3). These results indicate that the duration of the microwave processing is relevant to the concentrations derived from samples that are soaked for the same period. This is particularly evident in the samples that had been saturated for 14 days.The samples that were soaked 12 hours and underwent a microwave processing of time of either 15 or 30 minutes produced Artepillin C concentrations of 0.0943 and 0.1268 mg/ml respectively. Of particular note were the results of the Rutin extractions in the samples that had been soaked for 12 hours. The sample that had a 15 minute microwave processing produced a concentration of 0.011 and that which had a 30 minute processing produced a concentration of 0.0689 mg/ml. There is nearly 5 times the difference between the 15 and 30 minutes processing times.。
The experiment’s data shows that an extraction time of 15 and 30 minutes on 12 hour saturation sample produced difference in the CAPE concentration of 2.8 %. in contrast the difference between an time extraction of 15 and 30 minutes on a sample that had been saturated for 14 days produced a smaller difference of 1.7 % in the CAPE concentration. As there is not a substantial difference in the results generated by either sample, this would indicate that the extraction time has little impact of the CAPE concentrations extracted.
Artepillin C 0.00 0.02 0.04 0.06 0.08 0.10 0.12 0.14 0.16 0.18 0.20
No.1 No.2 No.3 No.4 No.5 No.6
Propolis extract samples
[image:4.595.323.552.405.522.2]A c tiv e in gr e d ie n ts ( m g /m l)
Fig. 6 Active ingredients of Artepillin C with different Propolis extract samples
CAPE 0.00 0.02 0.04 0.06 0.08 0.10 0.12 0.14 0.16 0.18 0.20
No.1 No.2 No.3 No.4 No.5 No.6
Propolis extract samples
[image:4.595.323.548.550.668.2]A c tiv e in gr e d ie n ts ( m g /m l)
REFERENCES
Quercetin
0.00 0.20 0.40 0.60 0.80 1.00 1.20
No.1 No.2 No.3 No.4 No.5 No.6
Propolis extract samples
Ac
ti
v
e
i
n
g
r
e
d
ie
n
ts
(m
g
/m
l) [1] K. Ganzler and A. Salgó: Microwave-extraction -a new method
superseding traditional Soxhlet extraction. Journal of Z Lebensm Unters
Forsch, 184, (1987), 274-276.
[2] C.S. Eskilsson and E. Bjo¨rklund: Analytical-scale microwave-assisted extraction. Journal of Chromatography A, 902, (2000), 227-250. [3] Zs. Czégény, B. Berente, M. Óvári, M. García Tapia and Gy. Záray:
Microwave-Assisted Vapor-Phase Acid Digestion of Cellulose Nitrate Filters for Elemental Analysis of Airborne Dust Samples. Journal of
MICROCHEMICAL, 59, (1998), 100-106.
[4] A.E. Drouzas and H. Schubert: Microwave application in vacuum drying of fruits. Journal of Food Engineering, 28, (1996), 203-209.
[image:5.595.56.282.58.172.2][5] M. Al-Harahsheh and S.W. Kingman: Microwave-assisted leaching—a review. Journal of Hydrometallurgy, 73, (2004), 189-203.
Fig. 8 Active ingredients of Quercetin with different Propolis extract samples
[6] E.T. Thostenson and T.-W. Chou: Microwave processing: fundamentals and applications. Journal of Composites: Part A, 30, (1999), 1055-1071.
Rutin
0.00 0.01 0.02 0.03 0.04 0.05 0.06 0.07 0.08 0.09
No.1 No.2 No.3 No.4 No.5 No.6
Propolis extract samples
A
c
ti
ve
i
n
gr
e
d
ie
n
ts
(
m
g/
m
l) [7] A. Salatino, É.W. Teixeira, G. Negri and D. Message: Origin and chemical
variation of Brazilian propolis. Journal of Advance Access Publication, 2, (2005), 33-38.
[8] G.A. Burdock: Review of the biological properties and toxicity of the bee propolis(propolis). Journal of Food and Chemical Toxicology, 36, (1998), 347-363.
[9] J. Peterson and J. Dwyer: Flavonoids: dietary occurrence and biochemical activity. Journal of Nutri. Res, 18, (1998), 1995-2018.
[10] Y.J. Lee, P.H. Liao, W.K. Chen and C.C. Yang: Preferential cytotoxicity of caffeic acid phenethyl ester analogues on oral cancer cells. Journal of Food Cancer Letters, 153, (2000), 51-56.
[image:5.595.52.282.199.316.2][11] M.C. Marcucci: Propolis: chemical composition, biological properties and therapeutic activity. Journal of Apidologie, 26, (1995), 83-99.
Fig. 9 Active ingredients of Rutin with different Propolis extract samples
Active ingredient content in propolis
0.00 0.20 0.40 0.60 0.80 1.00 1.20
No.1 No.2 No.3 No.4 No.5 No.6
Propolis extract s amples
A
c
ti
ve
i
n
gr
e
d
ie
n
ts
(
m
g/
ml
)
A rtepillin C
CA PE
Quercetin
Rutin
Fig. 10 Distribution of Propolis Mixture the Active Ingredients Content
IV. CONCLUSION
From the experimental results, it is observed that the time of soaking and the duration time of the MAE process are two important parameters. The best efficiency of extract about Quercetin is 57 % as shown in figure 10. The results show that the extraction time of CAPE by microwave was shortened by 12 times of the ultrasonic process, and the concentration of ingredients improved nearly 2.25 times. If the cost of time is considered, ultrasonic method is not a very efficient process. So, the active ingredients in propolis extracted by MAE are indeed worthy of studying for more advanced research and follow-up applications in extraction.
ACKNOWLEDGMENT
[image:5.595.53.281.341.460.2]