Abstract—Metaheuristics are sequential processes that perform exploration and exploitation in the solution space aiming to efficiently find near optimal solutions with natural intelligence as a source of inspiration. One of the most well-known metaheuristics is called Ant Colony Optimisation, ACO. This paper is conducted to give an aid in complicatedness of using ACO in terms of its parameters: number of iterations, ants and moves. Proper levels of these parameters are analysed on eight noisy continuous non-linear continuous response surfaces. Considering the solution space in a specified region, some surfaces contain global optimum and multiple local optimums and some are with a curved ridge. ACO parameters are determined through Modified Simplex, MSM and Steepest Ascent methods, SAM, including their hybridisation. SAM was introduced to enhance a performance of MSM via the statistically significant regression analysis and Taguchi’s signal to noise, S/N, ratio to recommend preferable levels of parameters. A series of computational experiments using each algorithm were conducted. Experimental results were analysed in terms of design points, best so far solutions, mean and standard deviation including S/N ratio. It was found that the results obtained from hybridisation were better than those using single algorithm itself. However, the average execution time of experimental run and number of design points using hybridisation were longer than those using a single method. Finally they stated a recommendation of proper level settings of ACO parameters for all eight functions that can be used as a guideline for future applications of ACO. This is to promote ease of use of ACO in real life problems.
Index Terms—Ant Colony Optimisation, Modified Simplex, Taguchi’s Signal to Noise Ratio, Steepest Ascent and Response Surface Methodology.
*J. Ratanaphanyarat is with the Industrial Statistics and Operational Research Unit (ISO-RU), Department of Industrial Engineering, Faculty of Engineering, Thammasat University, 12120, THAILAND [Phone: (662)564-3002-9; Fax: (662)564-3017; e-mail: [email protected], [email protected]].
S. Chunothaisawat, N. Rungruengsattaya, S. Tunsiriroongruang, K. Sriwannusorn are with the Industrial Statistics and Operational Research Unit (ISO-RU), Department of Industrial Engineering, Faculty of Engineering, Thammasat University, 12120, THAILAND.
P. Luangpaiboon is an Associate Professor, ISO-RU, Department of Industrial Engineering, Faculty of Engineering, Thammasat University, 12120, THAILAND.
This Research is sponsored by Lee Sae Import (1975) Ltd., Rungrojwattana
I. INTRODUCTION
Optimisation algorithms can be categorised as being either conventional or approximation optimisation algorithms [1]. Conventional optimisation algorithms are usually based upon mathematical procedures. However, the applications of these methods might need exponentially computational time in the worst cases. This becomes an impractical approach, especially for solving a very large size problem.
Alternative approaches that can guide the search process to find near optimal solutions in acceptable computational time are therefore more practical and desirable. Metaheuristics iteratively conduct stochastic search processes inspired by natural intelligence. They can be categorised into three groups: physically-based inspiration such as Simulated Annealing [2]; socially-based inspiration for instance Taboo Search [3]; and biologically-based inspiration e.g. Ant Colony Optimisation [4], Artificial Immune System [5], Genetic Algorithm [6], Memetic Algorithm [7], Neural Network [8], Particle Swarm Optimisation [9], and Shuffled Frog Leaping [10]. These alternative approaches have been widely used to solve large-scale combinatorial optimisation problems [11]— [14].
Response Surface Methodology (RSM) is a bundle of mathematical and statistical techniques that are helpful for modeling and analysing problems. A response of our interest is influenced by several predictor variables. An objective is to optimise this response. For example, suppose that a process engineer wishes to find the levels of temperature (x1) and pressure (x2) that maximise the yield (y) of a process. The process yield is a function of levels of temperature and pressure; y = ƒ(x1, x2) + ε [15].
Where ε represents the level of noise (standard deviation) or error observed in the response y. If we denote the expected response by E(y) = ƒ (x1, x2) = η, then the surface represented by; η = ƒ (x1, x2). So, it is called a response surface.
A response surface above describes how the yield of a process varies with changes in k independent variables. Estimation of such surfaces, and hence identification of near optimal settings for predictor variables is an important practical issue with interesting theoretical aspects. Many systematic methods for making an efficient empirical investigation of such surfaces have been proposed in the last fifty years. These are generally referred to as evolutionary
A Hybrid of Modified Simplex and Steepest
Ascent Methods with Signal to Noise Ratio for
Optimal Parameter Settings of ACO
operation (EVOP). RSM is used to improve the current operating conditions until the conditions of optimal yield are satisfied. In most RSM problems, a form of the relationship between the response and the independent variables is unknown. Thus, the first step in RSM is to find a suitable approximation for the true functional relationship between y and the set of its independent variables. Usually, a low-order polynomial in some region of the independent variables is employed [15]. If the response is well modeled by a linear function of the independent variables, then the approximating function is the first-order model.
Metaheuristics are more complicated due to constraints of the algorithm itself not of the question. These constraints or their parameters are needed to be initialised to optimise the outcome of the solution, or in other word, constraints directly affect the quality of the solution. So it is in turn inspiring an objective of this paper to examine the relation of constraints adjacent to the quality of solution of a chosen metaheuristic algorithm, Ant Colony Optimisation (ACO) in the context of Response Surface Methodology. A hybrid algorithm to determine the optimum of surfaces consists of two treatments; Modified Simplex Method (MSM) and Steepest Ascent Method (SAM).
Inspection and analysis are used to determine a recommendation on the proper levels of parameter settings for eight non-linear continuous mathematical models within three main classes; unimodal, multimodal and curve ridge including a combination of multimodal and curve ridge functions. Eight non-linear continuous mathematical models are considered being complicated optimisation problems when applied to real industrial processes.
This paper is organised as follows. Section II describes the selected metaheuristic; Ant Colony Optimisation (ACO) and its pseudo code. Sections III and IV are briefing about algorithms of Modified Simplex and Steepest Ascent, respectively. Sections V and VI are presenting Taguchi methodology and a hybrid algorithm of MSM and SAM, respectively. Section VII illustrates tested functions. Section VIII shows design and analysis of computational experiments for comparing the performance of the proposed methods. The conclusion is also summarised and it is followed by acknowledgment and references.
II. ANT COLONY OPTIMISATION ALGORITHM (ACO) Ant algorithm was first proposed by Dorigo and his colleagues [4] as a multi-agent approach to optimisation problems, such as a travelling salesman problem (TSP) and a quadratic assignment problem (QAP). There is currently a lot of ongoing activity in the scientific community to extend or apply ant-based algorithms to many different discrete optimisation problems. Recent applications cover problems like a vehicle routing, a plant layout and so on. Ant algorithm is inspired by observations of real ant colonies. Ants are social insects and they live in colonies. Behaviour is direct more to the survival of the colony as a whole than to that of a single individual component of the colony. Social insects have captured the attention from many scientists because of a
structure of their colonies, especially when compared with a relative simplicity of the colony’s individual. An important and interesting behaviour of ant colonies is their foraging behaviour and in particular how ants can find shortest paths between food sources and their nest [9], [16].
While walking from food sources to the nest and vice versa, ants deposit on the ground a substance called pheromone, forming a pheromone trail. With ants ability to smell pheromone they tend to choose a path marked by strong pheromone concentrations with the higher probability. The pheromone trail allows the ants to find their way back to the food source and vice versa. It can be also used by other ants to find the location of the food sources found by their nest mates [10]. The pseudo code is used to briefly explain to all the procedures of ACO shown in Fig. 1.
Procedure ACO Metaheuristic()
While (termination criterion not satisfied)– (line 1) Schedule activities
ants generation and starting point; makes path or step for each ant compare response function
if no improvement of response function then communication with best ant response function make path or step from local trap to best ant else
if ant found the better response function then go to line 5.
else
wait for best ant communication end if
end if
end schedule activities end while
end procedure
Fig. 1 Pseudo Code of ACO Metaheuristic.
III. THE SIMPLEX & MODIFIED SIMPLEX METHOD (MSM) The basic shape (design) is called the simplex [17]. The simplex design in a problem with k variables consists of k+1 design points (vertices) but it is not necessary to have a property of equidistance. There are many extensions on the rigid simplex algorithm. One of the well-known is a modified simplex method (MSM) of Nelder and Mead [18].
In the MSM an expansion or contraction of the reflection is allowed at each step. Although there are many possible stopping criterions for simplex algorithms, this study follows Nelder and Mead and includes the standard deviation of the estimated yields at the vertices of the simplex. Various stopping rules and one based on the sample range were also tried on the literatures, but they appeared to offer no advantage over the stopping rule based on the standard deviation of process yields.
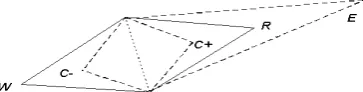
simplex consists of VH, VS, and VSH, or vertices of highest yield, second least yield and second highest yield, respectively [19], [20]. The new design point can be extended (E) in the direction of more favourable conditions, contracted (C- or C+) if a move is taken for least favourable conditions, and shrunk toward best vertex if a contracted vertex is still the least but not less than the rejected trial condition (Fig. 2). The next run is carried out with variables set at values correspondi
n
g to this new design point. This MSM terminates, and the finishing strategy is applied. An idea of MSM’s logical decision is shown in Fig. 3.Fig. 2Different Simplex Moves from the Rejected Trial Condition (W). R = Reflection, E = Expansion, C+ = Positive Contraction and
C- = Negative Contraction.
Procedure of MSM ()
While (termination criterion not satisfied)– (line 1) Schedule activities
Reflection of least yield W is processed Compute R and f(R)
Compare response function
if f(R) is highest then
extension E will be processed else
if R and f(R) continue to be the least then reflect backward to prior point
recalculate W and f(W) or
contraction C or shrinking S will be processed recalculate f(C) or f(S)
else go to line 3. end if end if
end schedule activities end while
end procedure
Fig. 3 Pseudo Code of MSM.
IV. STEEPEST ASCENT METHOD (SAM)
The procedure of SAM is that a hyperplane is fitted to the results from the initial 2k factorial designs. The data from these
design points are analysed. If there is an evidence of main effect(s), at some chosen level of statistical significance and no evidence of curvature, at the same level of significance, the direction of steepest ascent on the hyperplane is then determined by using principles of least squares and experimental designs. The next run is carried out at a point, which has some fixed distance in this direction, and further runs are carried out by continuing in this direction until no further increase in yield is noted. When the response first decreases and no improvement of two more verified yields, another 2k factorial design will be carried out, centered on the
preceding design point. A new direction of steepest ascent is estimated from this latest experiment. Provided at least one of the coefficients of the hyperplane is statistically significantly different from zero, the search continues in this new direction (Fig. 4). Once the first order model is determined to be inadequate, the area of optimum is identified via a second order model or a finishing strategy.
Procedure of SAM ()
While (termination criterion not satisfied)– (line 1)
Schedule activities(whenRegression verification criteria not satisfy) Determine significant first order model from the factorial design points Schedule activities
Move along the steepest ascent’s path with a step length (∆) Compute response functions
if new response function is greater than the preceding then move ahead with another ∆
else
calculate two more response function to verify the descending trend
if
one of which response function turn out to be greater than preceding coordinate’s response function then
use the biggest response function to continually move along the same path
else
use closest preceding point as a centre for new 23 design
end if end if
end schedule activities end schedule activities end while
end procedure
Fig. 4 Pseudo Code of SAM.
V. TAGUCHI METHODOLOGY
This method is created to propose understanding and alternative resolutions to manufacturing qualities. The fundamental concepts are a consequence of variations. The three main statistic contribution theories are loss function, off-line and design of experiments.
Consequence of qualities in this case is marked by Signal to Noise ratio (S/N), which will present sensitivity of response to noises or uncontrollable factors. This ratio is used to point out stability of the design system and quality of chosen design’s factors. A philosophy of off-line quality control, designing products and processes are insensitive to parameters outside the design engineer's control. Taguchi’s robust design of experiment with an advantage of S/N is encompassing both internal and external arrays within the improving assessment process [19].
The S/N provide a standard index for data comparison, while having noises contributing the sets of n data. Consequently, the method will be more comprehensive to extend the process design to quality control. Signal to noise ratio consists of;
S/N = 10Log [( n 1 y )/n]
1 i
2 i
10
∑
=
− (Maximisation)
S/N = 10Log [( n (y ))/n]
1 i
2 i
10
∑
=
[image:3.595.82.264.225.271.2]VI. HYBRID OF MSM AND SAM
Iterative strategies of MSM and SAM have S/N as a moving trigger rather an ordinary yield. Parameters are8 unit3 of the volume of the factorial design; 5 units of the step length; 10% of the significance level for tests of significance of slopes; Ants, Moves and Iterations. If conditions were satisfied by SAM, MSM will be then continued. The iterations replicate until the termination criteria is at the satisfaction state. Whilst continually checking stopping criteria in section VIII, following steps below would be carried out;
Step 1a: Perform a 23 design at a random centre point go to
Step 2, or,
Step 1b: Perform a 23 design at a maximal S/N point from preceding design.
Step 2: Fit a regression plane to S/N so that the fitted model has the form,
y
ˆ
= β0 + β1Iterations+ β2Ants + β3Moves.Step 3: Test whether there is evidence that either β1, β2 or β3 is
different from zero at the 10% level of significance.
Step 4: If the result is significant, move one step along the path of steepest ascent (the fitted regression line).
Step 5: Perform k+1 design points at the highest S/N vertex from the last SAM design plus one movement.
Step 6: Fit a regression plane to the k+1 design points plus the centre coordinate.
Step 7: Test for a significance level of the design vertices plus one centre coordinate.
Step 8: If the result is significant, a reflection or an extension will be carrying out, while omitting the regression plane and applying ordinary MSM motions.
Step 9: Return to Step 1b.
Stopping Criteria for a Hybrid Algorithm;
• Parameter default rule – when the coordinates escape from the first quadrant of ACO parameters or the upper or lower limit, or,
• Dispersion rule – when the best four S/N’s meet the preset standard deviation (SD); 0.0005 for no noise operation, 0.005 for noise equal to one and 0.05 for noise equal to three, and,
• Regression verification rule – when a significance level of the regression of SAM or MSM is more than 0.1.
VII. TESTED FUNCTIONS
In this paper, eight non-linear continuous mathematical functions were used to test performance measures of the related methods whilst searching for proper ACO parameter settings.
A. Parabolic Function
) 100 / x (x 12 ) x , f(x 2 2 2 1 2
1 = − +
B. Branin Function
10] )) cos(x π)) 4 / (5 ((10 6) x π) / ((5 x ) π 4 / (5.1 [(x log 5 ) x , f(x 1 2 1 2 1 2 2 10 2 1 + − + − + − − =
C. Camelback Function
1)] (x x 4 x x ) x ) 3 / 1 ( x 2.1 (4 [x log 10 ) x , f(x 2 2 2 2 2 1 4 1 2 1 2 1 10 2 1 − + + + − − =
D. Goldstein-Price Function
))}] 27x x 36x 48x 12x 32x (18 ) 3x (2x (30 * )) 3x x 6x 14x 3x 14x (19 ) x x (1 [1/{(1 log 10 ) x , f(x 2 2 2 1 2 2 1 1 2 2 1 2 2 2 1 2 2 1 1 2 2 1 10 2 1 + − + + − − + + + − + − + + + + =
E. Styblinski Function
] 3 ) 2 / ) x 5 x 16 ((x ) 2 / ) x 5 x 16 ((x [ 275 ) x ,
f(x1 2 = − 14− 12+ 1 + 42− 22+ 2 +
F. Rastrigin Function
))] x π cos(2 ) x π 10(cos(2 x x [20 80 ) x ,
f(x 2 1 2
2 2 1 2
G. Rosenbrock Function 10 ] 170 / 150] }] ) ) 7 / (x ) 6 / ((x ) 7 / x {(1 20 [[[ 70 ) x ,
f(x 22
1 2 2 1 2 1 + + − + + − − − =
H. Shekel Function
) ) 7 (x ) 6 (x /(6 1 ) ) 8 (x ) 8 (x /(11 1 ) ) 3 (x ) 8 (x /(14 1 ) ) 0 (x ) 0 (x /(20 1 ) ) 6 (x ) 4 (x /(9 1 [ 100 ) x , f(x 2 2 2 1 2 2 2 1 2 2 2 1 2 2 2 1 2 2 2 1 2 1 − + + + + − + − + + + + − + + − + + + + − + − + =
VIII. EXPERIMENTAL DESIGN AND ANALYSIS In this work, a computer simulation program was developed using Matlab 2006v.7.3B, and EVOPtimiser v.1.1.0. A Laptop computer DV2000 HP Pavilion was used for computational experiments. The proposed method is designed to use S/N as improving trigger, rather than ordinary yield.
If the range of factorial design points from SAM or simplex design points from MSM led to significant effect of β1, β2, or
β3 (Table I). The design shape will move one step forward.
The precedent is followed by analysing the current design shape plus one move and a maximal design point will be used as a vertex for the next design method.
Countering the latter if P-value exceeds the preset value of significance level, there’s no effect of regression coefficients. Accordingly to noises, operating points from either simplex or factorial design may need to duplicate and measure yields to satisfy Regression verification rule. If Dispersion rule is not satisfied but Regression verification rule is met, a replication from the last three realisations will be chosen from the least significance level without a consideration of the preset value. The algorithm does proceed to the next design method and the only chosen one will be attributed to the prior-best-four calculation.
It is also stated that ACO’s parameters have to only be positive integers. Consequently the process will confront with round-up error that would probably create a premature stop. On the early phase, MSM are more efficient for some surfaces. When levels of noises increase in the system, computational time taken is also longer due to complexities of
ACO algorithm [22]. Some non-linear continuous functions have effects of keen peak, zig-zag and multi local optimum. These effects and the nature of the algorithm can terminate the final results uncertainly. However, the results did show the high level of the spread of yields. The performance of the MSM algorithm was then enhanced via SAM and Taguchi’s S/N.
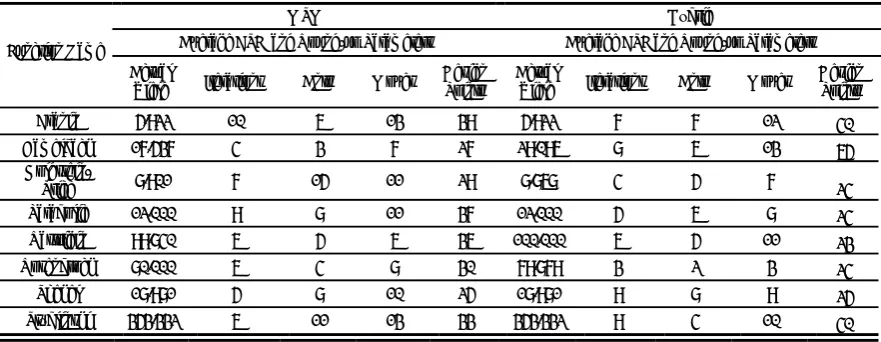
When there is no noise (Table II) the performance of pure MSM brought the same level of average yields. However, the hybrid algorithm seems to be better in terms of the number of design points. The performances of the hybrid continue to be more preferable when levels of noises increase in the system, (Tables III and IV). Number of design points is taken more when compared.
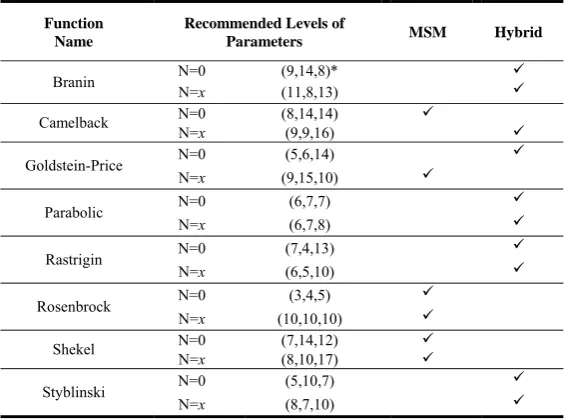
From Table V, preferable levels of parameters found by the pure MSM and hybrid algorithms are determined and are set to be suggested levels for ACO’s parameters, to promote an ease of use in all classes of equations. Under a consideration of recommended levels of its parameters, those may bring the benefit to solve industrial processes via ACO when the nature of the problems can be categorised as unimodal, multimodal or curve ridge including the mixed nature of multimodal and curve ridge response surface.
An extension on super modified simplex method could be applied to enhance the performance of MSM [17] when computational processes exceed the upper or lower limit (Parameter default rule). For SAM, a polynomial of higher degree function may be used if there is an evidence of curvature in the system. Hybrid algorithm would be more efficient in terms of Best So Far (BSF) solutions if the preset SD was set at lower level than what had been presented. Number of motions by each method could be enlarged to speed up the process improvement. Moreover, it tends to increase chances of moving directly toward the optimal direction by a regression path of SAM. For MSM the enlargement would probably lead to an increase in capability of local searches.
TABLE I
Analysis of Variance (ANOVA) and Regression Coefficients and their Significance for Parabolic Function without Noise.
Sources of Variation Df SS MS F P-value
Regression 3 0.93 0.31 11.03 0.021001
Residual 4 0.11 0.03
Total 7 1.05
Coefficients t Stat P-value
Iterations,β1 0.118 1.992 0.117
Ants,β2 0.085 1.427 0.227
TABLE II
Experimental Results Obtained from Related Methods on each Tested Function without Noise.
MSM Hybrid Average BSF and Round-up Parameters Average BSF and Round-up Parameters
Function Name
Actual
Yield Iterations Ants Moves Design
Points
Actual
Yield Iterations Ants Moves Design
Points
Branin 5.922 7 12 10 49 5.922 9 14 8 25
Camelback 28.252 8 14 14 55 26.286 10 7 11 156
Goldstein-Price 8.901 9 15 19 47 8.901 5 6 14 82
Parabolic 12.000 6 7 6 31 12.000 6 7 7 39
Rastrigin 100.000 7 8 13 33 100.000 7 4 13 66
Rosenbrock 80.000 3 4 5 21 80.000 6 4 8 24
Shekel 18.981 7 14 12 27 18.980 4 8 9 40
Styblinski 353.332 6 5 9 40 353.332 5 10 7 24
TABLE III
Experimental Results Obtained from Related Methods on each Tested Function with Noise Standard Deviation of 1.
MSM Hybrid Average BSF and Round-up Parameters Average BSF and Round-up Parameters
Function Name
Actual
Yield Iterations Ants Moves Design Points Actual Yield Iterations Ants Moves Design Points
Branin 5.922 7 20 11 36 5.922 14 8 13 114
Camelback 30.280 13 11 13 31 36.526 11 11 19 122
Goldstein-Price 8.901 10 14 9 35 8.901 11 11 16 105
Parabolic 12.000 8 8 10 43 12.000 6 7 8 24
Rastrigin 99.644 4 4 6 46 99.913 5 4 8 24
Rosenbrock 80.000 13 16 12 26 80.000 6 6 7 24
Shekel 18.981 10 11 23 28 18.979 6 6 8 50
Styblinski 353.332 11 9 12 35 353.332 6 9 9 24
TABLE IV
Experimental Results Obtained from Related Methods on each Tested Function with Noise Standard Deviation of 3.
MSM Hybrid Average BSF and Round-up Parameters Average BSF and Round-up Parameters
Function Name
Actual
Yield Iterations Ants Moves Design Points Actual Yield Iterations Ants Moves Design Points
Branin 5.922 10 6 13 39 5.922 7 7 12 40
Camelback 17.537 4 3 7 27 29.096 8 6 13 65
Goldstein-Price 8.901 7 15 11 29 8.868 4 5 7 24
Parabolic 12.000 9 8 11 37 12.000 5 6 8 24
Rastrigin 99.840 6 5 6 36 100.000 6 5 11 23
Rosenbrock 80.000 6 4 8 30 79.879 3 2 3 24
Shekel 18.981 5 8 10 25 18.981 9 8 9 25
TABLE V
Recommended Levels of Parameter Settings without Noise (N=0) and with Noise (N=x).
Function Name
Recommended Levels of
Parameters MSM Hybrid
N=0 (9,14,8)* 9
Branin N=x (11,8,13) 9
N=0 (8,14,14) 9
Camelback
N=x (9,9,16) 9
N=0 (5,6,14) 9
Goldstein-Price
N=x (9,15,10) 9
N=0 (6,7,7) 9
Parabolic
N=x (6,7,8) 9
N=0 (7,4,13) 9
Rastrigin
N=x (6,5,10) 9
N=0 (3,4,5) 9
Rosenbrock
N=x (10,10,10) 9
N=0 (7,14,12) 9
Shekel
N=x (8,10,17) 9
N=0 (5,10,7) 9
Styblinski
N=x (8,7,10) 9
Note: (a,b,c)*: a = (Average) Iterations, b = (Average) Ants, c = (Average) Moves
ACKNOWLEDGMENT
The authors wish to thank P. Sermpattarachai for the early phase of this research. The last author wishes to thank the Faculty of Engineering, Thammasat University, THAILAND for the financial support.
REFERENCES
[1] C. Blum and A. Roli, "Metaheuristics in Combinatorial Optimisation: Overview and Conceptual Comparison". ACM Computing surveys, vol.
35, no. 3, pp. 268-308, 2003.
[2] S. Kirkpatrick, C.D. Gelatt and M.P. Vecchi, "Optimisation by Simulated Annealing". Science, vol.220, no. 4598, pp. 671-679, 1983. [3] F. Glover, "Tabu Search - part i". ORSA Journal on Computing, vol. 1,
no. 3, pp. 190-206, 1986.
[4] M. Dorigo and T. Stutzle, Ant Colony Ooptimisation. Massachusetts, Bradford Book, 2004.
[5] E.A. Hart and J. Timmis, "Application Areas of AIS: The Past, the Present and the Future". Applied Soft Computing, vol. 8, no. 1, pp. 191-201, 2008.
[6] D.E. Goldberg, Genetic Algorithms in Search, Optimisation and machine learning. Massachusetts, Addison-Wesley, 1989.
[7] P. Merz and B. Freisleben, 1999. "A Comparison of Memetic Algorithms, Tabu Search, and Ant Colonies for the Quadratic Assignment Problem", presented at the 1999 Congress on Evolutionary Computation.
[8] S. Haykin, Neural Networks: A Comprehensive Foundation (2nd ed). NJ: Prentice Hall, 1999.
[9] J. Kennedy and R.C. Eberhart, Swarm Intelligence. San Francisco, CA: Morgan Kaufmann Publishers, 2001.
[10] M. Eusuff, K. Lansey and F. Pasha, "Shuffled Frog-Leaping Algorithm: A Memetic Metaheuristic for Discrete Optimisation". Engineering Optimisation, vol. 38, no. 2, pp. 129-154, 2006.
[11] H. Aytug, M. Knouja and F.E. Vergara, "Use of Genetic Algorithms to Solve Production and Operations Management Problems: A Review".
International Journal of Production Research, vol.41, no. 17, pp. 3955– 4009, 2003.
[12] S.S. Chaudhry and W. Luo, "Application of Genetic Algorithms in Production and Operations Management: A Review". International Journal of Production Research, vol.43, no. 19, pp. 4083-4101, 2005. [13] D. Dasgupta, Artificial Immune Systems and their Applications.
Springer-Verlag, 1998.
[14] M. Dorigo and C. Blum, "Ant Colony Optimisation Theory: A survey".
Theoretical Computer Science, vol. 344, no.2-3, pp. 243-278, 2005. [15] G.E.P. Box and N.R. Draper, Empirical model-building and response
surfaces. John Wiley & Sons, Inc., 1987
[16] P. Ittipong, P. Luangpaiboon and P. Pongcharoen, 2008. "Solving Non-Linear Continuous Mathematical Models Using Shuffled Frog Leaping and Memetic Algorithm". Presented at the 2008 Operations Research Network Conference, Bangkok, Thailand.
[17] W.G.R. Spendley, G.R. Hext, and F.R. Himsworth, "Sequential Application of Simplex Designs in Optimisation and Evolutionary Operation". Technometrics,vol. 4, no. 4, pp. 441-461, 1962.
[18] J.A. Nelder and R. Mead, "A Simplex Method for Function Optimisation", Computer Journal, vol. 7, pp. 308-313, 1965.
[19] J.A.M. Pulgarin, A.A. Molina and M.T. Alanon Pardo, "The Use of Modified Simplex Method to Optimise the Room Temperature Phosphorescence Variables in the Determination of Antihypertensive Drug", Talanta, vol. 57, pp. 795-805, 2002.
[20] F.H. Walters, L.R. Parker, S.L. Jr.,Morgan and S.M. Deming,.
Sequential Simplex Optimisation. CRC Press, Inc., Boca Raton, 1991. [21] G. Taguchi and Y. Wu, “Introduction to Off-Line Quality Control”,
Central Japan Quality Control Association, Nagoya, Japan, 1980. [22] S. Chunothaisawat and P. Luangpaiboon, 2009, "A Comparative Study