Original Article
Establishment of rat models for screening
slow-acting drugs of hyperuricemia
Jiao Huo1, Hua Yang2, Yedan Lu1, Sijia Ma1, Weibo Cheng2, Xiaomeng Li1, Jinyao Chen1, Lishi Zhang1 1West China School of Public Health/Food Safety Monitoring, Risk Assessment Key Laboratory of Sichuan
Prov-ince, Chengdu, China; 2Analytical and Testing Center of West China School of Public Health, Sichuan University,
Chengdu, China
Received June 25, 2017; Accepted September 28, 2017; Epub February 15, 2018; Published February 28, 2018
Abstract: Hyperuricemia, caused by dietary, environmental and genetic factors, has been recognized as a high risk factor for gout, cerebrovascular and cardiovascular diseases. Most hyperuricemic animal models were carried out on rats with short-term treatment (<1-15 days), which were not suitable for screening of agents with long-term effect and mechanisms of action, especially for traditional Chinese medicines. In this study, several combinations of two types of model drugs were adopted to establish a stable model of hyperuricemia in rats during 15-45 days. Results showed that either co-administration of adenine plus oteracil potassium or administration of toteracil potassium
alone was able to increase serum uric acid levels in a time dependent manner. Allopurinol significantly decreased
elevated serum uric acid levels in all models, while benzbromarone only took effect in the model using oteracil po-tassium alone. In addition, prominent macroscopic and microscopic abnormity of kidney were observed in adenine-treated groups and appreciably attenuated by allopurinol, which suggested that morphologic indexes or enzyme
parameters regarding renal injury may have the potential to be an indicator of drug efficacy. The test platform we
established based on different approaches may play an important role in screening for the majority slow-acting antihyperuricemia agents acting by different mechanisms.
Keywords: Hyperuricemia, animal model, rat, drug screening, kidney injury
Introduction
Hyperuricemia, defined as a serum urate con
-centration higher or equal to 6.8 mg/dL (0.408 mmol/L), is strongly associated with the risk of gout [1]. During the last few years, a growing body of evidence demonstrated that high se- rum uric acid levels with or without gout are both associated with kidney diseases [2] and cardiovascular diseases (e.g. hypertension, co- ronary heart diseases and peripheral vascular diseases) [3], although it was unclear whether serum uric acid is an independent risk factor. Despite the current in-depth knowledge of the pathophysiological role of hyperuricemia in human diseases and the availability of valid therapeutic options, the management of hyper-uricemia still largely relies on the pharmaceuti-cal approaches [4]. However, the target serum urate goals are not always achieved by using
fist-line agents, including allopurinol and febux
-ostat, due to multiple factors. And varying de- grees of side effects such as gastrointestinal reactions and liver injury have been frequently reported during medication application [5]. In addition, the key point about the management of hyperuricemia is lowering serum urate be- low saturation concentrations in long-term, but some patients will develop drug resistance in the medication process.
Some traditional Chinese medicine (TCM) and
many natural plants-origin products (e.g. the water extract of Leonurus artemisia) have been
proved efficient in down-regulating uric acid
levels [6, 7]. Data from a recent meta-analysis of eleven randomized controlled clinical trials
showed that TCM had a similar effect compared
with western medicine for treatment of hy- peruricemia, but with fewer side effects [8]. Besides, the moderate time-effect courses of
TCM may be more appropriate for serum urate
hyperurice-mia. Animal models play an important role in pilot screening of antihyperuricemic agents and preliminary exploration of the mechanisms of action. It should be noted that most animal models established before were with short time treatment for both modeling and intervention [9-11], which was less suitable for the
screen-ing for slow-actscreen-ing agents such as TCM. In this study, in an effort to explore the effica-cy evaluation profiles of natural products with
long-course treatment, different doses and combinations of several hypericemia-inducing drugs were adopted to establish an ideal model for hyperuricemia in rats. Analysis of kidney
injury and the efficacy of positive control drugs were also discussed in this paper. This study
was set up to establish the test platform in
which the efficacy of slow-acting agents, e.g.
several traditional Chinese herbs will be thor-oughly evaluated.
Materials and methods
Reagents
Oteracil potassium (CAS No. 2207-75-2) was purchased from Jinan Chenghui Shuangda Chemical Co., Ltd. (Jinan, Shanghai, China). Ad- enine (CAS No. 73-24-5) was purchased from Amresco L.L.C. (Solon, OH, USA). Allopurinol
(CAS No. 315-30-0) was purchased from
To-kyo Kakoki Co., Ltd. (Kamiina, Nagano, Japan). Benzbromarone (CAS No. 3562-84-3) and So- dium carboxymethyl cellulose (Na-CMC, CAS No. 9004-32-4) were purchased from Sigma-Aldrich Inc. (St. Louis, MO, USA). All chemicals used were of analytical grade.
Test animals
SPF-grade male Sprague-Dawley rats (6-week of age) were procured from Dashuo Labora- tory Animal Reproduction Center (Chengdu,
Sichuan, China) (Certificate No. SCXK2013-24). The rats were kept at the Animal Laboratory
Center of West China School of Public Health
(Chengdu, Sichuan, China) (Certificate No.
SC-XK2013-11). Five rats were housed in each cage and were given free access to standard commercial rodent feed and drinking water.
The animals were acclimatized for 7 days
be-fore treatment. Standard ethical guidelines of the Ethical Committee for Research on La- boratory Animals of Sichuan University were followed.
Experimental approach
To eliminate the interference from the extreme
values, rats of which serum uric acid (UA) were out of range of 95% baseline (P2.5-P97.5) at
day-1 were excluded. The rats were randomized
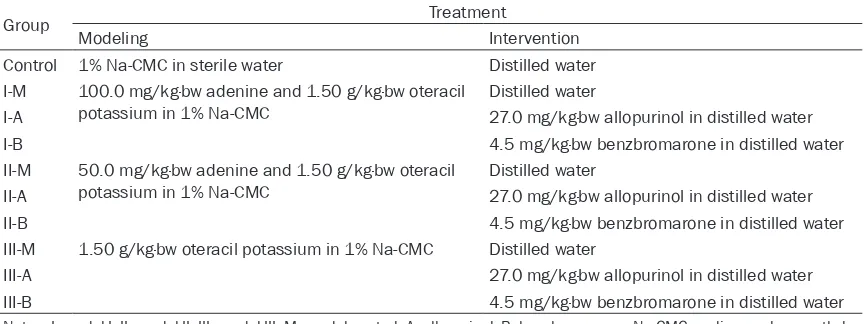
to nine treatment groups (n=13 in each group) according to serum UA, i.e. a control group, 3 model groups (model I, II, III) and 6 positive groups (allopurinol and benzbromarone inter-vention groups in each model). Model drugs, dose levels, vehicles employed and other rele-vant information are summarized in Table 1.
The animal doses of allopurinol and benzbro
-marone were extrapolated from human doses by a conversion based on body surface area
[12]. The model drugs were administrated at
9:00 am and the positive control drugs were administrated at 3:00 pm in all groups for con-Table 1. Treatment Groups (n=13)
Group Treatment
Modeling Intervention
Control 1% Na-CMC in sterile water Distilled water
I-M 100.0 mg/kg·bw adenine and 1.50 g/kg·bw oteracil
potassium in 1% Na-CMC Distilled water
I-A 27.0 mg/kg·bw allopurinol in distilled water
I-B 4.5 mg/kg·bw benzbromarone in distilled water
II-M 50.0 mg/kg·bw adenine and 1.50 g/kg·bw oteracil
potassium in 1% Na-CMC Distilled water
II-A 27.0 mg/kg·bw allopurinol in distilled water
II-B 4.5 mg/kg·bw benzbromarone in distilled water
III-M 1.50 g/kg·bw oteracil potassium in 1% Na-CMC Distilled water
III-A 27.0 mg/kg·bw allopurinol in distilled water
III-B 4.5 mg/kg·bw benzbromarone in distilled water
[image:2.612.91.525.86.248.2]tinuous 45 days (days 1-45). All treatments were via oral gavage in a volume of 10 mL/ kg·bw. Body weight was measured and
record-ed before treatment on the first day of dosing
and twice per week thereafter and prior to necropsy.
Blood collection and measurement
The rats were fasted eight hours prior to blood
collection with free access to water. Peripheral blood was collected on day -1 (as baseline), 15, 30 and 45. On day -1, 15 and 30, blood was obtained by nicking a lateral tail vein with a
sur-gical blade after animals were warmed briefly
under a heat lamp. At the end of the
experi-ment, all animals were sacrificed and the
ab-dominal aorta blood samples were collected. After centrifugation at 1300 g for 10 min, the serum was isolated and stored at -80°C for
fol-lowing detection. The serum creatinine (Cr),
urea nitrogen (UN) and uric acid were all deter-mined by an autoanalyzer (Beckman Coulter AU480, USA). For six treatment groups, the percentage of decrease in uric acid in positive groups compared with corresponding model groups was calculated using the following equa-tion on day 15, 30 and 45:
percentage of decrease in uric acid (%)
UA in model groups
(UA in model groups UA in positive groups) 100% =
-#
Necropsy
After the blood samples were collected, the livers and kidneys were excised and weighed.
Relative organ weights [(organ/body weight) × 100%] were calculated for all organs.
Histopathology and image analysis
Livers and kidneys were fixed in 10% buffer-ed formalin, embbuffer-eddbuffer-ed in paraffin and stainbuffer-ed
with hematoxylin and eosin (H&E). Light micros-copy studies were done under a photomicro-scope (Olympus BX50F4, Japan).
The extent of the damage was evaluated by the
Image-Pro Plus System 5.0 (Media Cybernetics
Inc., Silver Spring, MD, USA). The images of
whole tissue sections from all animals were
captured under × 200 optical magnification. Successive fields of each slide (ten to fifteen
images) were then analyzed with the software above. For each image, positive staining was measured as a percentage of the area of total
image. The calculation was performed as fol
-lows: (a) define the area to be analyzed, (b) set the colors that identified the positive, and (c)
automatically measure by computer. All histo-logical determinations were done by a blinded observer.
Statistical analyses
Results were expressed as mean values with standard deviations (mean ± S.D.). Statistical analysis was performed using Statistical Pro- duct and Service Solutions (SPSS, Chicago, IL,
USA) Version 11.0, and the level of significance
[image:3.612.92.523.97.252.2]was set at alpha = 0.05. For all data one-way analysis of variance (ANOVA) was used after Table 2. Final body and relative organ weights for male rats treated with modeling and intervention drugs for 45 days (n=13)
Group Body weight (g) Liver weight (g) Liver weight/Body weight Kidney weight (g) Kidney weight/Body weight
Control 458.0 ± 21.8 13.58 ± 0.88 2.97 ± 0.20 2.74 ± 0.28 0.60 ± 0.05
I-M 434.7 ± 36.4 12.71 ± 1.69 2.92 ± 0.21 4.70 ± 0.49▲▲ 1.08 ± 0.04▲▲
I-A 446.9 ± 25.0 12.69 ± 1.67 2.83 ± 0.27 3.85 ± 0.46* 0.86 ± 0.08**
I-B 436.1 ± 26.2 12.33 ± 1.05 2.83 ± 0.18 4.85 ± 0.56 1.11 ± 0.11
II-M 448.1 ± 19.4 13.37 ± 1.27 2.98 ± 0.23 3.37 ± 0.25▲▲ 0.75 ± 0.06▲▲
II-A 458.1 ± 22.7 13.78 ± 1.37 3.00 ± 0.27 3.29 ± 0.55 0.72 ± 0.10
II-B 447.4 ± 25.2 13.90 ± 1.34 3.11 ± 0.22 3.60 ± 0.39 0.81 ± 0.09
III-M 457.8 ± 31.8 12.81 ± 2.53 2.79 ± 0.47 2.85 ± 0.42 0.62 ± 0.07
III-A 463.5 ± 26.1 12.80 ± 1.47 2.76 ± 0.28 2.93 ±0.39 0.63 ± 0.07
III-B 465.1 ± 32.7 13.38 ± 2.46 2.87 ± 0.48 2.99 ± 0.43 0.64 ± 0.09
Notes: I, model I; II, model II; III, model III; M, model control; A, allopurinol; B, benzbromarone. ▲▲Significantly different from the
control value at the levels of P<0.01. *,**Significantly different from the corresponding model value at the levels of P<0.05,
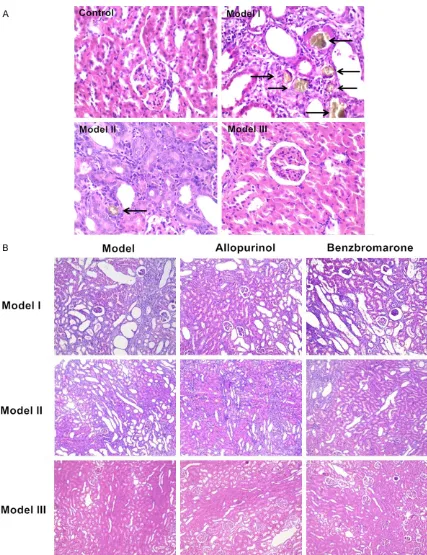
Figure 1. Hematoxylin & Eosin stains of kidney sections. A: Images from control and 3 model groups (i.e. model
I, model II and model III) under × 400 magnification. Tubulointerstitium appeared normal in control and model III rats, while prominent injuries including severe inflammatory cell infiltration, vascular congestion, interstitial fibrosis
and crystalline-type deposit were shown in model I and II. Kidney stones were indicated by arrows. B: Images from
all groups under × 200 magnification. In model I and II, the injuries were appreciably attenuated by allopurinol,
checking for homogeneity of variance, or the Kruskal-Wallis rank sum test was performed. Comparison between groups was undertaken with a Dunnett’s test while P ≤ 0.05 in ANOVA.
Results
General behavior, body weight and organ weight
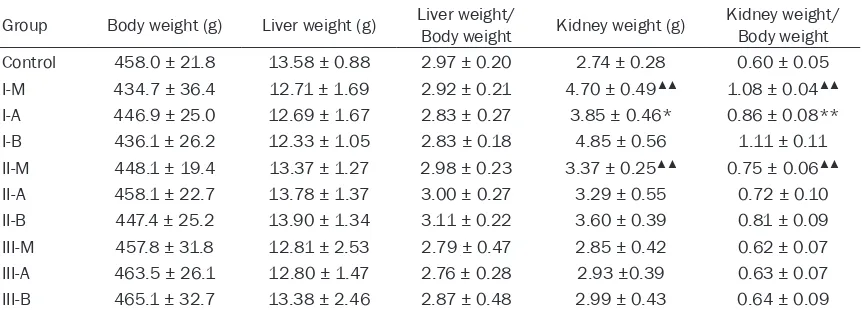
No rat died during the experiment. Later in the 45 consecutive days, yellow and clutter in furs, apathetic and burnout in spirit were observed in animals in adenine feeding groups (model I and II), while neither of the symptoms were observed in model III and control group. Animals in model I and II gained less weight than control animals, but the differences were
modest and did not reach statistical signifi
-cance (P>0.05, Table 2).
Significant increase (P<0.05) of absolute and
relative kidney weights was observed in rats treated with adenine (model I and II) compared to those of controls, and the increase was more
profound at 100.0 mg/kg·bw. There was no sig
-nificant difference (P>0.05) in absolute and
relative organ weights in rats treated with oter-acil potassium alone (model III) compared with those of controls. In model I, allopurinol decre- ased both absolute and relative kidney weights as compared to those of the corresponding model group (P<0.05), but benzbromarone had
no such effects. Slight but non-significant (P>
0.05) reduction in the absolute and relative kid-ney weights was observed in allopurinol inter-vention group of model II (Table 2).
Necropsy and histopathologic findings
At the time of autopsy, marked renal swelling, white discoloration and granular change were observed in the gross morphology of kidney in model I and II, whereas none of those abnormal changes were found in control and model III. On H&E stains of kidney section slides (Figure 1A), both tubulointerstitium and glomeruli of rats in control and model III appeared normal, while rats in model I and II had considerable renal damage. Kidney slices of model I and II showed different amounts of crystals in tubular lumina and interstitium. Furthermore, scattered dila-tion and obstrucdila-tion of tubular lumina, forma-tion of foreign body granuloma, subsequent degeneration and necrosis of tubular epithelia
were found. There were no macroscopic and microscopic findings of livers in rats from all
groups considered to be related to treatment.
Quantified analysis was performed as previ
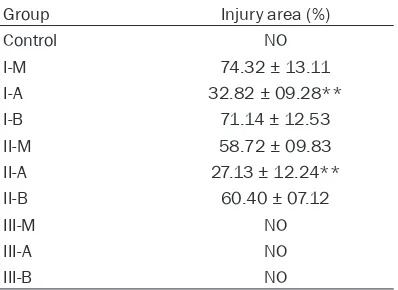
-ously described on H&E stains of kidney sec-tions (Table 3 and Figure 1B). There were no
renal damages in control and model III gro- ups. Renal injury was extensive in two adenine treated model groups (model I and II), and inju-ry area on average was 74.32% at dose of 100.0 mg/kg·bw larger than 58.72% at 50.0 mg/kg·bw (P<0.05). In model I and II, the inju-ries were appreciably attenuated in allopur- inol intervention groups (P<0.05), whereas sim-ilar effects were not observed regarding benz- bromarone.
Serum uric acid, creatinine and urea nitrogen levels
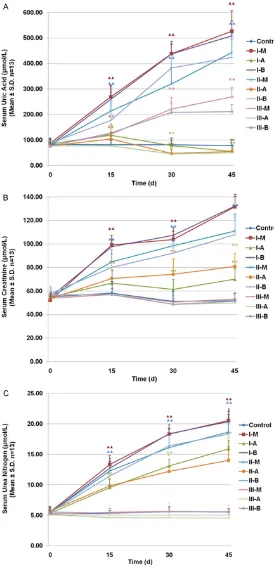
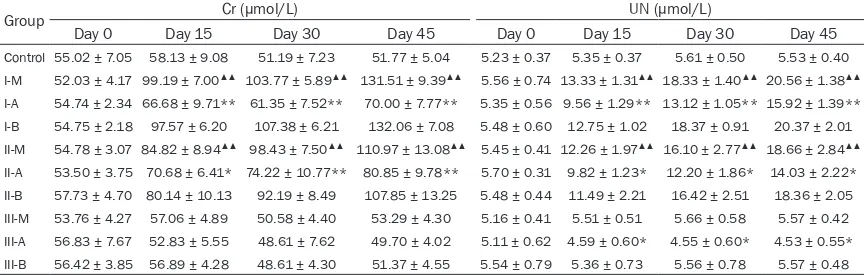
Measurements of serum UA, Cr and UN were performed on day 0, 15 d, 30 d and 45 d (Figure 2; Tables 4 and 5). The two dose of adenine (model I and II) induced a statistically signifi -cant increase in serum UA, Cr and UN, as early as day 15, with further increases at day 30 and 45 (P<0.05). Oteracil potassium alone (model
III) also induced a statistically significant
incre-ase in UA (P<0.05) in a time-dependent man-ner. In contrast to co-treatment of adenine plus oteracil potassium, the increase of Cr and UN levels in the model group used oteracil potas-Table 3. Injury severity of kidney sections
evaluated by the Image-Pro Plus System on H&E stains (n=13)
Group Injury area (%)
Control NO
I-M 74.32 ± 13.11
I-A 32.82 ± 09.28**
I-B 71.14 ± 12.53
II-M 58.72 ± 09.83
II-A 27.13 ± 12.24**
II-B 60.40 ± 07.12
III-M NO
III-A NO
III-B NO
[image:5.612.91.290.109.254.2]sium alone was not observed at any time point.
For all 3 models, the level of UA decreased after treatment with allopurinol compared wi- th corresponding model gro- ups at any time point from day 15 to day 45 (P<0.05, Figure 2A and Table 4). Meanwhile, the percentage of decrease in UA was gradually increased over time. Allopurinol also in- duced decreases in serum Cr and UN levels in model I and II (P<0.05, Figure 2B, 2C and Table 5), whereas only the de- crease of UN levels was sh- owed in model III (P<0.05).
There was no significant dif
-ference in treatment with ben-zbromarone in attenuating the increase in UA levels in model I and II (P>0.05), and the UA levels was not attenuated un- til day 45 in model III (Figure 2A and Table 4). There was
likewise no significant differ
-ence in treatment with benz-bromarone in both UN and Cr responses among the three model groups (P>0.05, Figure 2B, 2C and Table 5).
Discussion
[image:6.612.93.367.73.640.2]Uric acid in most mammalian species is converted to allan-toin by uricase, which is lack-ing in the higher apes and human [13]. Hence, inhibitors of the uricase (e.g. oxonic ac- id) [14], and precursors of uric acid (e.g. adenine) [15] have generally been adopted as modelling agents for animal hyperuricemia, while transge- nic rat [16] and fructose [17] have also been employed. Pre- vious studies on animal hyper-uricemia models showed that daily ingestion of uricase inhi- bitors and precursors of uric acid may lead to morphologi-cal alter in renal structure as-
Figure 2. Time courses of responses for different treatments in hyperurice
-mic rats. The response of (A) serum uric acid levels, (B) serum creatinine
levels, and (C) serum urea nitrogen levels for 45 days. Notes: I, model I; II, model II; III, model III; M, model control; (A) allopurinol; (B) benzbroma-rone. ▲▲Significantly different from the control value at the levels of P<0.01.
*,**Significantly different from the corresponding model value at the levels
sociated with the molding mechanisms of hy- peruricemia. In animal models induced by uri-case inhibitors, serum UA was increased by a competitive-inhibition of the UA transformation.
Therefore, kidney injury in this model was
cau-sed by the separation and deposition of urate crystals [18], which was similar to the renal injury of primary hyperuricemia implicated in pathological states such as gout and inherited purine disorders. On the contrary, the crystal kidney stones deposited in tubular lumina in adenine induced models were oxidized adenine (i.e. 2,8-dihydroxyadenine) [19], followed by the increase of UA level as a result from kidney
dys-function. The renal injury in adenine-induced
animals was analogous to those in secondary hyperuricemia.
Some researchers have suggested that renal diseases possibly implicated the progression hyperuricemia [20]. Ma et al. [21] and Wang
et al. [22] have used renal histopathological
changes to reflect drug efficacy in
fructose-induced or oxonate-fructose-induced hyperuricemia res-
pectively. Therefore, we tested the hypothesis
that the attenuation degree of renal injury may
be an indicator of drug efficacy in two types of
hyperuricemia models. In this study, rats co-treated with adenine at 50 mg/kg·bw or 100 mg/kg·bw plus oteracil potassium developed
crystal-related kidney inflammation and injury.
[image:7.612.92.522.98.266.2]Allopurinol could ameliorate elevated UA levels and renal injuries in both two co-treated mod-els, while those improvements were not obse- rved in benzbromarone intervention groups. Table 4. Serum UA and percentage of decrease in UA of rats treated with modeling and intervention drugs during 45 days (n=13)
Group UA (μmol/L)
Percentage of decrease in UA (%)
Day 0 Day 15 Day 30 Day 45 Day 15 Day 30 Day 45
Control 82.86 ± 15.70 80.89 ± 13.80 80.83 ± 20.03 77.54 ± 17.97 - -
-I-M 87.98 ± 13.51 268.92 ± 36.06▲▲ 438.32 ± 34.00▲▲ 527.16 ± 66.18▲▲
I-A 84.12 ± 12.53 118.52 ± 9.76** 77.45 ± 15.64** 54.84 ± 13.16** 55.93 82.33 89.60
I-B 80.68 ± 15.47 259.59 ± 44.84 437.02 ± 42.28 508.67 ± 48.84 3.47 0.30 3.51
II-M 80.92 ± 12.35 213.79 ± 59.88▲▲ 320.00 ± 55.01▲▲ 443.55 ± 64.21▲▲ - -
-II-A 76.74 ± 8.41 103.66 ± 17.33** 46.99 ± 11.91** 55.27 ± 6.80** 51.51 85.32 87.54
II-B 87.59 ± 11.08 177.47 ± 64.42 382.18 ± 41.81 423.97 ± 59.13 16.99 -19.43 4.41
III-M 78.07 ± 10.83 123.05 ± 27.90▲▲ 221.28 ± 37.15▲▲ 269.35 ± 29.84▲▲ - -
-III-A 76.61 ± 09.41 76.32 ± 13.80** 45.21 ± 16.38** 49.68 ± 15.87** 37.98 79.57 81.56
III-B 75.69 ± 10.06 127.41 ± 29.56 208.28 ± 28.88 211.15 ± 24.58* -3.54 5.87 21.61
Notes. I, model I; II, model II; III, model III; M, model control; A, allopurinol; B, benzbromarone; UA, uric acid. Percentage of de-crease in serum uric acid was calculated by the formula listed in the text. ▲▲Significantly different from the control value at the
levels of P<0.01. *,**Significantly different from the corresponding model value at the levels of P<0.05, P<0.01, respectively.
Table 5. Serum Cr and UN of rats treated with modeling and intervention drugs during 45 days (n=13)
Group Cr (μmol/L) UN (μmol/L)
Day 0 Day 15 Day 30 Day 45 Day 0 Day 15 Day 30 Day 45
Control 55.02 ± 7.05 58.13 ± 9.08 51.19 ± 7.23 51.77 ± 5.04 5.23 ± 0.37 5.35 ± 0.37 5.61 ± 0.50 5.53 ± 0.40 I-M 52.03 ± 4.17 99.19 ± 7.00▲▲ 103.77 ± 5.89▲▲ 131.51 ± 9.39▲▲ 5.56 ± 0.74 13.33 ± 1.31▲▲ 18.33 ± 1.40▲▲ 20.56 ± 1.38▲▲ I-A 54.74 ± 2.34 66.68 ± 9.71** 61.35 ± 7.52** 70.00 ± 7.77** 5.35 ± 0.56 9.56 ± 1.29** 13.12 ± 1.05** 15.92 ± 1.39** I-B 54.75 ± 2.18 97.57 ± 6.20 107.38 ± 6.21 132.06 ± 7.08 5.48 ± 0.60 12.75 ± 1.02 18.37 ± 0.91 20.37 ± 2.01 II-M 54.78 ± 3.07 84.82 ± 8.94▲▲ 98.43 ± 7.50▲▲ 110.97 ± 13.08▲▲ 5.45 ± 0.41 12.26 ± 1.97▲▲ 16.10 ± 2.77▲▲ 18.66 ± 2.84▲▲ II-A 53.50 ± 3.75 70.68 ± 6.41* 74.22 ± 10.77** 80.85 ± 9.78** 5.70 ± 0.31 9.82 ± 1.23* 12.20 ± 1.86* 14.03 ± 2.22* II-B 57.73 ± 4.70 80.14 ± 10.13 92.19 ± 8.49 107.85 ± 13.25 5.48 ± 0.44 11.49 ± 2.21 16.42 ± 2.51 18.36 ± 2.05 III-M 53.76 ± 4.27 57.06 ± 4.89 50.58 ± 4.40 53.29 ± 4.30 5.16 ± 0.41 5.51 ± 0.51 5.66 ± 0.58 5.57 ± 0.42 III-A 56.83 ± 7.67 52.83 ± 5.55 48.61 ± 7.62 49.70 ± 4.02 5.11 ± 0.62 4.59 ± 0.60* 4.55 ± 0.60* 4.53 ± 0.55* III-B 56.42 ± 3.85 56.89 ± 4.28 48.61 ± 4.30 51.37 ± 4.55 5.54 ± 0.79 5.36 ± 0.73 5.56 ± 0.78 5.57 ± 0.48
[image:7.612.90.522.336.474.2]We were also able to induce hyperuricemia by oteracil potassium alone, but the kidneys were devoid of crystals and were normal by light
microscopy. The failure of observation of renal
injury was probably attributed to that light mi- croscopy was not sensitive enough to detect the small injuries and animals were not treated for long enough. Elevated UA levels were also attenuated by allopurinol in this model. Nota-
bly, benzbromarone was found to significantly
decrease the UA levels at day 45 in this model, in contrast with its null effect in other two co-treated models.
It can be deduced that the variation of drug
efficacy of allopurinol and benzbromarone
ob-served in two types of hyperuricemia models was associated with their mechanisms of ac- tion. Adenine and benzbromarone are repre-sentative agents of xanthine oxidase inhibitors and uricosurics, two main categories for antihy-peruricemia drugs, respectively. Allopurinol is
a nonspecific competitive xanthine oxidase
in-hibitor [5]. Some researchers have suggested that allopurinol is able to slow the progression of renal diseases and improve kidney function
in hyperuricemic patients [23]. These effects
were validated in our study in the models
co-treated of adenine plus oteracil potassium. The
precise mechanism is currently unknown, but probably related to alleviation in endothelial dysfunction [24]. By contrast, benzbromarone takes effect by increasing renal urate excre- tion mediated by selective inhibition of organic anion transporters [5], and this might be the reason why benzbromarone did not work on animals with kidney dysfunction.
Moderate degree of hepatic damages induced by adenine was reported by Al Za’abi et al. [25] and Song et al. [26]. In the former study that Wistar rats were treated with adenine at the dose of 0.25% (w/w) for 35 days, liver tissue
showed infiltration of inflammatory cells under light microscopy, and significant elevations in
some plasma enzymes were also observed [25]. In the latter study that used adenine at the dose of 10 mg/kg·bw for 14 days in Wistar rats, Song et al. [26] also reported significant
increases in some enzymes. Dark grain mate-rial and increase of lysosome were observed under ultra microstructure. However, in con-trast with the observation reported by the two studies listed above, no liver abnormities sho- wed up by histological analyses in our study.
Currently, the courses of TCM therapy of hyper
-uricemia usually last for 20-30 days [27, 28], and the patients with comorbidities such as renal impairment need to receive treatment for even longer periods (56-90 days) [29, 30]. Hence, we adopted the administration time of 15-45 days, which was appropriate for screen-ing the majority slow-actscreen-ing drugs relative to human medication period. Our study provided evidence that either co-administration of ade-nine plus oteracil potassium or using oteracil potassium only was available to establish a stable hyperuricemia model in rats during 15-
45 days. The former model was similar to sec
-ondary hyperuricemia in human, and it was able to screen xanthine oxidase inhibitors but
uricosurics. The latter model was similar to
primary hyperuricemia, which was suitable for screening both classes of antihyperuricemic agents. Considering that severe renal injury may affect enzyme activity in drug action, treat-ing with adenine at the dose of 50.0 mg/kg·bw was recommended rather than that at 100.0 mg/kg·bw.
In this study, treatment with adenine plus oteracil potassium or oteracil potassium alone was both able to establish stable hyperurice-mia animal models during 15-45 days,
provid-ing a valuable platform for efficacy screenprovid-ing
of slow-acting antihyperuricemia agents,
espe-cially for TCM. The kidney injury induced by
adenine mitigated by allopurinol may play an important role in screening for agents as
xan-thine oxidase inhibitors. In addition, these find
-ings supported the need for additional studies to clarify the mechanistic pathways of crystal-line deposition induced by adenine for better
understanding of the profile and efficacy of
antihyperuricemic agents. It is promising that animal models established in this study will serve as a valuable research tool in this area of effective agents screening.
Acknowledgements
This work was supported by science and tech
-nology projects for youth of traditional Chinese
medicine, Sichuan province (Grant Number
20-16Q045).
Disclosure of conflict of interest
Address correspondence to: Drs. Jinyao Chen and Lishi Zhang, Department of Nutrition, Food Safety and Toxicology, West China School of Public Health, Sichuan University, 16 Third Section, South Renmin
Road, Chengdu, Sichuan, China. Tel: 86-13518-161420; E-mail: [email protected] (JYC); Tel:
86-13808071034; E-mail: [email protected] (LSZ)
References
[1] Choi HK, Mount DB and Reginato AM. Patho-genesis of gout. Ann Intern Med 2005; 143: 499-516.
[2] Tsai CW, Lin SY, Kuo CC and Huang CC. Serum
uric acid and progression of kidney disease: a longitudinal analysis and mini-review. PLoS One 2017; 12: e0170393.
[3] Kuwabara M. Hyperuricemia, cardiovascular disease, and hypertension. Pulse (Basel) 2016; 3: 242-252.
[4] Grassi D, Pontremoli R, Bocale R, Ferri C and Desideri G. Therapeutic approaches to chronic
hyperuricemia and gout. High Blood Press Car-diovasc Prev 2014; 21: 243-250.
[5] Sattui SE and Gaffo AL. Treatment of hyperuri -cemia in gout: current therapeutic options, lat-est developments and clinical implications.
Ther Adv Musculoskelet Dis 2016; 8: 145-159.
[6] Wang HQ, Zhan J, Wang XB and Zou L. Re-search progress in treatment of hyperuricemia with active ingredients of traditional Chinese
medicine. Chin J Pharm Toxicol 2015; 29:
471-476.
[7] Hao S, Zhang C and Song H. Natural products improving hyperuricemia with hepatorenal du- al effects. Evid Based Complement Alternat Med 2016; 2016: 7390504.
[8] Lin J, Chen S, Li S, Lu M, Li Y and Su Y. Efficacy
and safety of Chinese medicinal herbs for the treatment of hyperuricemia: a systematic re-view and meta-analysis. Evid Based Comple-ment Alternat Med 2016; 2016: 2146204. [9] Li M, Yang D, Mei L, Yuan L, Xie A and Yuan J.
Screening and characterization of purine nu-cleoside degrading lactic acid bacteria isolated from Chinese sauerkraut and evaluation of the serum uric acid lowering effect in hyperurice-mic rats. PLoS One 2014; 9: e105577. [10] Haidari F, Rashidi MR, Keshavarz SA, Mahboob
SA, Eshraghian MR and Shahi MM. Effects of onion on serum uric acid levels and hepatic xanthine dehydrogenase/xanthine oxidase ac-tivities in hyperuricemic rats. Pak J Biol Sci 2008; 11: 1779-1784.
[11] Chen GL, Wei W and Xu SY. Effect and mecha -nism of total saponin of dioscorea on animal experimental hyperuricemia. Am J Chin Med 2006; 34: 77-85.
[12] Reagan-Shaw S, Nihal M and Ahmad N. Dose translation from animal to human studies re-visited. FASEB J 2008; 22: 659-661.
[13] Johnson WJ, Stavric B and Chartrand A. Uri-case inhibition in the rat by s-triazines: an ani-mal model for hyperuricemia and hyperuricos-uria. Proc Soc Exp Biol Med 1969; 131: 8-12. [14] Kocic G, Pavlovic R, Nikolic G, Veljkovic A, Pan
-seri S, Chiesa LM, Andjelkovic T, Jevtovic-Sto
-imenov T, Sokolovic D, Cvetkovic T, Stojanovic
S, Kocic H and Nikolic R. Effect of commercial or depurinized milk on rat liver growth-regula-tory kinases, nuclear factor-kappa B, and en-donuclease in experimental hyperuricemia: comparison with allopurinol therapy. J Dairy Sci 2014; 97: 4029-4042.
[15] Liu Z, Chen T, Niu H, Ren W, Li X, Cui L and Li C. The establishment and characteristics of rat
model of atherosclerosis induced by hyperuri-cemia. Stem Cells Int 2016; 2016: 1365257. [16] Sato M, Wakayama T, Mamada H, Shirasaka Y,
Nakanishi T and Tamai I. Identification and
functional characterization of uric acid trans-porter urat1 (Slc22a12) in rats. Biochim Bio-phys Acta 2011; 1808: 1441-1447.
[17] Chen G and Jia P. Allopurinol decreases serum
uric acid level and intestinal glucose transport-er-5 expression in rats with fructose-induced hyperuricemia. Pharmacol Rep 2016; 68: 782-786.
[18] Mazzali M, Hughes J, Kim YG, Jefferson JA, Kang DH, Gordon KL, Lan HY, Kivlighn S and
Johnson RJ. Elevated uric acid increases blood pressure in the rat by a novel crystal-indepen-dent mechanism. Hypertension 2001; 38: 1101-1106.
[19] Tamura M, Aizawa R, Hori M and Ozaki H. Pro -gressive renal dysfunction and macrophage
infiltration in interstitial fibrosis in an
adenine-induced tubulointerstitial nephritis mouse model. Histochem Cell Biol 2009; 131: 483-490.
[20] Kang DH and Nakagawa T. Uric acid and chron -ic renal disease: possible impl-ication of hyper-uricemia on progression of renal disease. Se-min Nephrol 2005; 25: 43-49.
[21] Ma CH, Kang LL, Ren HM, Zhang DM and Kong LD. Simiao pill ameliorates renal glomerular injury via increasing Sirt1 expression and
sup-pressing NF-kappaB/NLRP3 inflammasome
activation in high fructose-fed rats. J Ethno-pharmacol 2015; 172: 108-117.
[22] Wang R, Ma CH, Zhou F and Kong LD. Siwu de-coction attenuates oxonate-induced
hyperuri-cemia and kidney inflammation in mice. Chin J
Nat Med 2016; 14: 499-507.
[23] Krishnamurthy A, Lazaro D, Stefanov DG, Blu
-menthal D, Gerber D and Patel S. The effect of
[24] Mallat SG, Al Kattar S, Tanios BY and Jurjus A.
Hyperuricemia, hypertension, and chronic kid-ney disease: an emerging association. Curr Hypertens Rep 2016; 18: 74.
[25] Al Za’abi M, Shalaby A, Manoj P and Ali BH. The
in vivo effects of adenine-induced chronic kid-ney disease on some renal and hepatic func-tion and CYP450 metabolizing enzymes. Physi-ol Res 2017; 66: 263-271.
[26] Song YJ, Yu WS, Yin F and Song Y. Studies of hepatic lesion on hyperuricemia rat-model in-duced by adenine and guanine. Med Innov China 2016; 13: 013-016.
[27] Xu H, Chen J, Liu HL, Dai N, Fan ZM and Wei Y.
Clinical efficacy and safety evaluation of tradi -tional Chinese medicine niao suan li xian for-mula granules in treatment of hyperuricemia.
Chin Arch Tradit Chin Med 2013; 2285-2288.
[28] Chen BC, Wu QY and Zhou Y. Randomized
dou-ble-bind clinical trial on efficacy of xuezhikang
capsule on hyperuricemia and its safety. Chin J
Inf Tradit Chin Med 2006; 13: 6-8.
[29] Zheng DP, Zou SL and Huang L. Clinical investi-gation on the treatment of chronic uric acid nephropathy by integrated medicine. Chin J
In-tegr Tradit Western Nephrol 2003; 4: 644-646.
[30] Ma M. Clinical observation of “Xiezhuo Jiang-suan Decoction” in treating uric acid