Labour Productivity and Foreign Direct
Investment in Irish Manufacturing Industry:
A Decomposition Analysis*
FRANCES RUANE and ALI UG˘ UR
Institute for International Integration Studies at Trinity College Dublin.
Abstract: Overall labour productivity in the Irish manufacturing sector increased by 158 per cent between 1991 and 1999. This paper examines the components of this labour productivity growth in the period 1991-1999, using a decomposition analysis based on plant level data. In order to account for the large presence of foreign plants we carry out our analysis separately for foreign and domestic plants, as well as for four ownership subgroups, four sectoral subgroups, and two time sub-periods. Our results show that although the main drivers of average labour productivity growth in all groups arise within plantand from plant entry, there are marked differences in the relative sizes of these effects across ownership/sector/time-period.
I INTRODUCTION
O
ver the 1990s, the Irish economy experienced high rates of economic growth and low unemployment rates relative to other European Union (EU) and OECD countries. The increase in the real Gross Domestic Product (GDP) reached double-digits in the period 1995-2000 compared to growth rates of between 2 and 3 per cent in the EU and OECD countries. The success in achieving high growth rates of output and employment was accompanied by19
* We wish to acknowledge help with the provision of data from the Irish Central Statistics Office as well as financial support from the IIIS (under funding from DEPFA BANK PLC) and grants from Forfás, Enterprise Ireland and IDA Ireland. We have benefited from useful comments by John Sutton, Richard Harris and participants in CAED 2003 Conference organised by ONS and Irish Economic Association Conference 2004, as well as by the Review’s referee. All remaining errors are our own.
substantial increases in the general level of labour productivity in the economy, as output growth exceeded employment growth.
The overall growth in labour productivity was reflected in the growth of labour productivity in the Irish manufacturing sector, which increased by 158 per cent between 1991 and 1999.1This growth in labour productivity coincided with strong employment growth during the same period, in stark contrast to the experience of other European countries, where employment in manufacturing declined in the 1990s.2 Although growth patterns in employment and output at an aggregate level are most often the focus of discussions of productivity growth, it is increasingly recognised that we get a better understanding of these changes by studying individual plants rather than sectors. In recent years there has been a growing body of research into productivity growth at the plant level, with the increasing interest in industry dynamics and the greater availability of data at plant level. Many of these studies examine the origins of productivity growth, by using total factor or labour productivity at the plant level. They conclude that plant performance is heterogeneous and that net changes observed in aggregate data are marked by large increases at some plants and decreases at others. Theoretical explanations behind this heterogeneity include innovation and creative destruction (Schumpeter, 1942), passive learning (Jovanovic, 1982) and active learning (Erickson and Pakes, 1995).3
This paper examines the factors that affect the growth of labour productivity in the Irish manufacturing sector over the 1990s using a decomposition analysis. Section II reviews the methods used to analyse the decomposition of productivity growth in the literature, and summarises the results from studies across a range of developed and developing countries. Section III outlines the methodology adopted in the decomposition analysis of labour productivity growth in Irish manufacturing and the data used in the analysis.
A distinguishing feature of the Irish manufacturing sector is the large presence of foreign plants – in 1999 foreign plants accounted for 85 per cent of net output and 49 per cent of employment in the sector. In the light of this, Section IV presents ownership decomposition results for both foreign and domestic plants, as well as for four different foreign nationality groups. It also presents results separately for 1991-1995 and 1995-1999, because of the very different growth rates in labour productivity in these two sub-periods. This analysis also serves to test the robustness of overall results to different time periods.
1Based on own estimates from CSO data used in this paper – see Section III below. 2See Scarpetta et al.(2000).
A key part of the focus of Irish policy has been the restructuring of manufacturing out of traditional and into high-tech sectors. In Section V we present results for four (OECD) sectoral groups in order to examine the contribution of different factors at a more disaggregated sector level. Finally, Section VI contains a brief summary and some conclusions.
II DECOMPOSING PRODUCTIVITY CHANGE
Studies within the literature that investigate the role of resource allocation in productivity change begin with a decomposition analysis that expresses the aggregate productivity in a given sector by a weighted average of each plant’s productivity in that sector, i.e.,
Pt= SitPit (1)
it
where Pt is an aggregate productivity measure, which can be labour productivity (LP) or total factor productivity (TFP) for the sector at time t; Sit is the share of plant i in the given sector at time t; and Pitis a productivity measure of an individual plant i at time t.4In the literature, employment is typically used in weighting LP and output share is used to weight TFP.5
In an early empirical study Baily, Hulten and Campbell (1992) explore heterogeneity among plants to see how productivity of individual plants changes within an industry, which plants account for the productivity growth, and how important entry and exit are to productivity growth in the industry. Their decomposition analysis begins with a calculation of TFP of each plant. The level of productivity in an industry in year t is expressed as an index:
ln TFPt= Sitln TFPit (2) i
where Sitis the share of the i-th plant in industry output in current dollars. Baily et al. (1992) decompose the industry productivity growth into the contributions of the continuing plants (C), the entrants (N) and the exiting plants (X) using
4The choice between LP and TFP is mainly data driven. Arguably TFP is the better measure of
productivity, since it takes other factors of production, specifically capital stock, into account when calculating changes in productivity. In this study we focus on changes in labour productivity due to data limitations on capital stock, which do not allow us to estimate TFP on such a short time series.
∆ ln TFPt=
(Sit–k∆ ln TFPit) + ln TFPit ∆Sit iC iC(3) +
Sitln TFPit– Sit–kln TFPit–kiN iX
The contribution of continuing plants can be divided into two parts. The first term is the within-effect, which evaluates the contribution of productivity growth in the continuing plants holding their shares constant in the base year. The second term, which is denoted as the between-effect, measures the contribution of changes in the shares of plants, holding productivity measure constant in the base year. This value will be positive if there is an increase in the shares of high-productivity plants or a decrease in the shares of low-productivity plants. The last two terms give the contribution of entering and exiting plants to overall productivity growth.
Using data from the Longitudinal Research Database (LRD) for the years 1972, 1977 and 1982 they examine the decomposition of productivity growth in US manufacturing industry for the 1972-77, 1977-82 and 1982-87 periods. They find that for the 1972-77 and 1982-87 periods, within plant productivity determines the performance of the overall growth, whereas for the 1977-82 period the between-effect accounts for most of the overall productivity growth. The entry and exit terms play only a minor role and the values are small.6 They find that in the periods of growth in the manufacturing sector there is a small negative effect of entry and exit, whereas in the recession periods they observe a small positive contribution from entry and exit.7
Griliches and Regev (1995) in their analysis of the productivity growth in the Israeli manufacturing industry propose an alternative method of decomposition. They include the deviation of plant level productivity from the industry average over the base and end years in the between, entry and exit terms.8Their decomposition method is given as
within
between
entry
exit6They report the contribution of entry and exit together as a net entry effect.
7Although they do not include average industry productivity in their decomposition method, they
interpret the results of the net entry effect in the growth period due to the entrants being below average productivity. Likewise they argue that in the recession period, there was less entry and more exit of low productivity plants leading to a positive net entry contribution.
8It is also argued in later studies that this method is less sensitive to random measurement errors
∆ Pt=
S–i∆pit+ ∆Sit(p–i– P–) iC iC(4) +
Sit(pit– P–
) – Sit–k(pit–k– P – ) iN iX
where a bar over a variable indicates the average of the variable over the base and end years, p is plant productivity, P is sector productivity and S is the plant share in the industry.9They use labour productivity as their productivity measure and employment as their share measure. Griliches and Regev (1995) find that most of the labour productivity in the Israeli manufacturing sector over the 1979-88 period occurs within plant.
Foster, Haltiwanger and Krizan (1998), following Baily et al. (1992) and Griliches and Regev (1995), apply their decomposition method to the measurement of labour productivity. They argue that the Baily et al. method of decomposition could lead to a negative net entry effect, even when the entrants are more productive than exiters. They suggest that this may not reflect the true net entry contribution, if the market share of entrants is very low and the market share of exiters is very high. They further suggest that the Griliches and Regev (1995) method obscures the within- and between-effects. In order to overcome these problems, they propose a modified version of both decompositions given as:
∆Pi =
Sit–k∆Pit + (Pit–k– P––t––k) ∆Sit + ∆Sit ∆Pit iC iC iC(5)
+
Sit(Pit– P––t––k) – Sit–k (Pit–k– P––t––k) iN iXwhere Ptis defined as labour productivity in industry, Sitis a plant’s share of employment at time t and Pitis a plant’s labour productivity at time t.
within
between
entry
exit
within-firm between-firmcontinuing - firms
cross-effect
entering exiting
In this decomposition, for the between, entry and exit terms, Foster et al. (1998) use the deviation of individual plants’ productivity from the base year industry average instead of using the average of base and final year values as proposed by Griliches and Regev (1995).
In Equation (5) the within-effect captures the contribution from labour productivity changes within existing plants, holding employment shares constant at their base period level. This term removes the contribution to the productivity growth of changes in employment shares, giving a pure interpretation of productivity change within the existing plants.
The between-effectmeasures the contribution from changes in employment shares, holding constant the labour productivity level of each plant, relative to the group average in the base period. Disney et al.(2003) argue that a positive contribution from the between-effect suggests that market selection is generating faster growth among more productive establishments. This term will be positive for (a) plants that have above-average labour productivity in the base period and gain employment share and (b) for plants that have below average productivity and lose employment share during the period. Correspondingly, it will have a negative effect on overall productivity growth if plants with below (above) average labour productivity in the base period gain (lose) employment share.
The cross-effect is a covariance term from the specification of the within and between plant effects and it takes account of the interaction of changes in employment shares and labour productivity. If this value is positive then it reflects gains in productivity (a) from plants, which are both gaining market share and increasing their productivity, or (b) from plants whose productivity levels decrease along with their market share. On the other hand if this value is negative and average productivity growth is positive, it shows that on average, continuing plants increase their productivity levels while downsizing. The entry and exit of plants involves a movement of resources including capital and labour. If plants that enter are more productive, on average, than plants that are already in operation, this contributes positively to labour productivity growth. If the plants that exit have lower labour productivity than those that continue to operate, this again improves average labour productivity.
Using Census of Manufactures plant level data for the US manufacturing industry Foster et al. (1998) first examine the aggregate productivity change over the ten-year period 1977 to 1987. In their analysis they use both multifactor productivity and labour productivity.10For shares, they use
level gross output with multifactor productivity measure, and both plant-level employment and gross output with labour productivity measure although they argue that for labour productivity, the appropriate share measure is employment. For the period 1977-1987, their analysis shows that the within component accounts for 48 per cent and 74 per cent of average industry multifactor productivity and labour productivity per worker measures respectively.11 Net entry accounts for 26 per cent and 29 per cent of the average industry change for multifactor and labour productivity measures respectively. They also carry out their analysis in five-year periods for 1977-82, 1982-87 and 1987-92 to test the robustness of their results for a shorter time horizon. They find that cyclical variation in productivity growth plays a dominant role in the overall pattern. Their analysis also shows that the net entry contribution is greater in cyclical downturns and the within-plant contribution is large and positive for high productivity growth periods.12 Recent studies have followed these manufacturing sector studies, using previously unavailable plant level panel data for a variety of other countries.
Ahn (2000), using plant level data on the Korean manufacturing sector for the period 1990-1998, analyses the micro dynamics of entry, exit and productivity growth. He uses the Baily et al.decomposition method in which betweenand cross-effectterms are combined. Ahn uses TFP as the productivity measure and presents results for 1990-95 and 1995-98 periods separately; he points out that the 1995-98 period was marked by a downturn in Korean manufacturing industry. The results for 1990-95 show that within plant effects account for about 60 per cent of manufacturing productivity growth, while this effect is actually slightly negative during the 1995-98 period.13The effect of entry and exit on aggregate productivity growth is more than 40 per cent for 1990-95 and around 65 per cent for 1995-1998. This effect is consistent with the Foster et al., findings that net entry term has a greater effect in downturns.14Overall the study shows that the entry and exit effects were the most important factors contributing to productivity growth in the Korean manufacturing sector over the period 1990-1998, playing a particularly important role in the recession period of 1995-98.
11The values of some individual components in the decomposition analysis can be greater than
100 per cent due to possible negative contribution of other components.
12 Foster et. al., also present results for eight 4-digit industries in the auto repairs sector to
examine the effects of different factors of productivity decomposition in a service industry.
13This is consistent with output declining at plant level while employment stays constant. 14He also presents results for thirteen 2-digit sectors; these show that within-effect is important
A recent multi-authored OECD (2001) study, that is part of an ongoing project on plant-level data, analyses labour productivity decompositions for eight countries.15The periods of analysis differ due to data availability across countries, but in general the results cover the period between 1985 and 1995. The study analyses both labour productivity and, where available, multifactor productivity growth.16They find that for all countries in the analysis, labour productivity growth is largely accounted for by gains within individual plants; in effect the within component accounted for three-quarters or more of productivity growth. The results show that the between-effect varies significantly across countries and over time, but is generally small and, in some cases, even negative.17 The net contribution of the entry and exit of plants is positive in most countries, with the exception of West Germany,18and accounts for between 10 per cent and 40 per cent of productivity growth. They also find that in cases where the net entry effect is positive and the coefficient is large, exits made most of the contribution, i.e., the closure of inefficient plants.
In years of expansion, the within plant effect makes a stronger contribution to overall productivity growth, while in slowdowns the contribution is mostly from the exit of low-productivity plants. The contribution of entry is significantly influenced by the horizon over which productivity is measured, the contribution becoming greater the longer the horizon considered. They argue that this is due to the increased share of activity for entrants in the end year over the time period examined. This contrasts with the results of studies on US data, where analyses on longer time periods find a higher contribution of entry than those using shorter time periods.19 Although the components of the decomposition analysis differ significantly across countries, the OECD study finds that in the industries that are more closely related to information and communication technologies, the entry component makes a stronger contribution to labour productivity growth.20
15The countries included are Canada; Finland; France; Germany; Italy; Netherlands; Portugal,
United Kingdom and the United States.
16Due to data availability they carry out the decomposition of multifactor productivity analysis
only for Finland, France, Italy, Netherlands and the UK.
17Since this study uses the Griliches and Regev (1995) decomposition method, between-effect
results are mixed since they reflect both between and cross terms from the Foster et al. (1998) method.
18Data for Germany refer to West Germany.
19See Baily et al. (1992), Haltiwanger (1997) and Foster et al.(1998).
20Although the study does not give results for the individual sectors, electrical and optical
In the case of multifactor productivity growth, the OECD results show that the within plant contribution is smaller than for labour productivity growth, with the between plant and net entry effects being more important. Combining these two results on labour and multifactor productivity decompositions, the OECD study concludes that incumbent plants, in a number of European countries, increased their labour productivity by mainly substituting capital for labour. 21
Baldwin and Gu (2002) examine the contribution of plant turnover to labour productivity growth in the Canadian manufacturing sector over the three periods, 1973-79, 1979-88 and 1988-97, using Annual Surveys of Manufacturers. They measure labour productivity of a plant as real gross output per worker.22They use the decomposition methods proposed by Foster
et al. (1998) and Griliches and Regev (1995).23 Their results show that productivity growth within continuing plants is the predominant source of labour productivity growth in Canadian manufacturing, where the within -plant component of the decomposition ranges from 40 per cent to 100 per cent of aggregate productivity growth. They find that the between-effect, which explains the shift towards more productive plants, accounts for 30-70 per cent of labour productivity growth in the 1973-79 period but has a negligible effect after that. The net entryeffect contributes 25 per cent of productivity growth in the 1973-79 period, but this contribution declines after that.24The results of the decomposition of productivity growth in 22 manufacturing industries at the 2-digit level show that plant turnover, i.e., entry and exit effects, contribute positively to labour productivity growth in nearly all of the industries, though the within-effect is the dominant contributor. They also carry out a decomposition analysis for domestic and foreign-controlled plants separately.25Results show that the growth of the within-plant component is considerably higher in the foreign sector after 1979. It accounts for 40 per cent of overall withingrowth in the 1970s and this rises to over 55 per cent of the total in the 1990s. They also show that foreign plants are an important source of net entry, representing 60 per cent of the contribution from the total net entry effect.
21They support this with results from studies showing that in many European countries high
labour productivity growth was accompanied by reduced employment.
22They also report similar results using value added per worker.
23In addition to the main two methods used in the literature, they use two alternative methods
proposed by Baldwin and Gorecki (1991) and Baldwin (1995). They argue that entering plants replace exiting plants and suggest two methods where they replace the average productivity of an industry with that of exiting plants’ average productivity in both Foster et al.(1998) and Griliches and Regev (1995) methods.
24It is 20 per cent in 1979-88 and 15 per cent in 1988-97.
25 To our knowledge this is the only study in the literature that examines decomposition of
Disney, Haskel and Heden (2003), using UK Census of Production data, analyse the determinants of productivity growth in UK manufacturing industry. Their data set covers the period 1980-1992. By using the decomposition methods suggested by Foster et al. (1998) and Griliches and Regev (1995), they examine the contribution of within, between, cross, entry and exiteffects on the overall productivity growth in UK manufacturing. They measure both labour and total factor productivity and use employment and gross output alternatively as shares in the decomposition analysis. They find that net entry accounts for around 50 per cent of productivity growth for both labour productivity and total factor productivity measures. They also find that crossand betweenterms are important when they use TFP, whereas the within term is important for labour productivity.26 They argue that the stronger
withincontribution to labour productivity growth of continuing firms is driven by capital-labour substitution.27 On the other hand they find similar entry and
exit effects, irrespective of the use of TFP or labour productivity. They also consider three sub-periods, 1980-82 and 1989-92 as recession periods and 1982-89 as a boom period. Their results show that within-effect is more important in the boom period, with net entrybeing less important.28
Overall, results from studies on decomposition of productivity growth in the manufacturing sectors in different countries show that the within-effectis the most important factor in determining the overall change in labour productivity growth, although this effect is smaller when explaining the change in total factor productivity growth. In comparing results from different countries one has to be alert to differences in data sources, time periods and more, importantly, different decomposition methods used in these studies. These differences make simple direct comparisons difficult.
III DECOMPOSING LABOUR PRODUCTIVITY CHANGE IN IRISH MANUFACTURING
3.1 Approach of Decomposition
The Irish manufacturing industry has experienced exceptional economic performance during the 1990s, both in terms of increasing output and employment levels. Although employment creation and increased output
26It accounts for 48 per cent of productivity growth in their study.
27 They also argue that much of the difference could be due to measurement error in the
construction of the capital variable in measuring TFP.
28The short recession period makes the interpretation of results sensitive. The authors also note
through exports has been the priority for industrial policy for many decades, recently the focus has shifted towards labour productivity. In this section we explain how we propose to examine the changes in labour productivity using the decomposition methods outlined in Section II.
Foreign plants, mainly drove the growth in the employment and net output levels in Irish manufacturing industry in the 1990s. They accounted for 85 per cent of total manufacturing net output and 49 per cent of total manufacturing employment in 1999. Thus, in addition to the overall results, we present results for foreign and indigenous plants separately and also for four different nationality groupings, among foreign plants. In order to check the sensitivity of our results for selected time periods, we also decompose labour productivity growth separately for 1991-95 and 1995-99. The latter half of the 1990s, from 1995, shows persistent output and employment growth for both foreign and domestic plants, whereas in the first half of the period many domestic plants experienced both increases and decreases in employment in different years.29
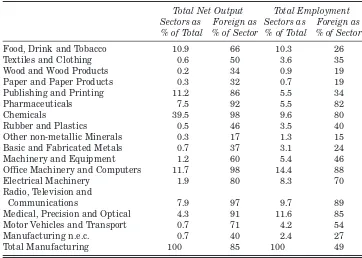
An overall examination of Irish manufacturing industry, in terms of decomposing labour productivity growth, gives an understanding of the different factors that contribute to this growth; however, it can miss the structural differences that exist in different individual industries that make up the overall. For example, although foreign plants account for 85 per cent of total manufacturing net output in 1999, as can be seen from Table 1, this share differs considerably across individual 2-digit sectors ranging from 17 per cent in Other Non-Metallic Minerals to 98 per cent in Chemicals. We can see the same structural difference in terms of the share of employment, with foreign plants accounting for 49 per cent of total manufacturing employment overall, though this value ranges from 15 per cent in Other Non-Metallic Minerals industry to 89 per cent in the Radio, Television and Communications sector. Hence it is necessary to carry out a more detailed examination of labour productivity growth at sectoral level. We carry out this analysis by dividing the individual industries into four main groups, according to OECD classification, namely, high-tech, medium high-tech, medium-low tech and low-tech industries.
3.2 Methodology and Data
We use the Foster et al. (1998) method in our analysis of the decomposition of labour productivity growth in the Irish manufacturing sector over the period
29Overall labour productivity grew by 38 per cent during the 1991-95 period, with increases of 6
1991-1999, since it is the most comprehensive method in terms of analysing the effects of changes in continuing plants and the contribution of entering and exiting plants. In addition to the comprehensiveness of this method, our analysis benefits from having a data set that is free of the complexities of changing sampling procedures, as it is based on the full population of manufacturing plants.
[image:12.498.71.433.97.355.2]The data used for our analysis come from the Irish Census of Industrial Production (CIP).30 This census is carried out annually by the Central Statistics Office of Ireland and covers allindustrial local units with 3 or more persons engaged. As such it is the only fully representative survey of plants in Ireland. The variables on which data are collected are those standard for such Censuses – output (gross and net), sales, employment, wages, capital additions, sectoral and regional classification as well as nationality of ownership. In the CIP, the classification by nationality of ownership is determined by the nationality of the owners of 50 per cent or more of the share Table 1: Significance of Foreign Plants in the Irish Manufacturing Sector, 1999
Total Net Output Total Employment Sectors as Foreign as Sectors as Foreign as
% of Total % of Sector % of Total % of Sector
Food, Drink and Tobacco 10.9 66 10.3 26
Textiles and Clothing 0.6 50 3.6 35
Wood and Wood Products 0.2 34 0.9 19
Paper and Paper Products 0.3 32 0.7 19
Publishing and Printing 11.2 86 5.5 34
Pharmaceuticals 7.5 92 5.5 82
Chemicals 39.5 98 9.6 80
Rubber and Plastics 0.5 46 3.5 40
Other non-metallic Minerals 0.3 17 1.3 15
Basic and Fabricated Metals 0.7 37 3.1 24
Machinery and Equipment 1.2 60 5.4 46
Office Machinery and Computers 11.7 98 14.4 88
Electrical Machinery 1.9 80 8.3 70
Radio, Television and
Communications 7.9 97 9.7 89
Medical, Precision and Optical 4.3 91 11.6 85
Motor Vehicles and Transport 0.7 71 4.2 54
Manufacturing n.e.c. 0.7 40 2.4 27
Total Manufacturing 100 85 100 49
30 These confidential data were accessed and analysed under “safe-setting” conditions at the
capital.31 The analysis is for the period 1991-99, and covers an average of 4,600 companies, of which more than 3,800 are Irish-owned.32
Labour productivity is measured as the ratio of net output to total employment in each plant, where value added figures are expressed in real terms using the producer price indices published by the CSO.33 Following Haskel and Barnes (2000), we removed all observations where either net output or employment data were missing or had a zero value, in order to deal with missing or spurious observations.34Also the top and bottom percentiles of the net output were dropped to remove potential outliers.35In addition to examining within, between, cross, entryand exit effects on overall productivity growth for all plants, we carry out the decomposition separately for foreign and domestic plants because of the importance of foreign plants in Irish manufacturing industry. Although it is possible to examine the contribution of different factors for foreign and domestic plants in the same equation, this approach can cause problems in the Irish manufacturing industry where general labour productivity levels in individual industries are likely to be biased upwards due to the transfer pricing activities of some foreign plants. We follow Foster et al.(1998), decomposing productivity growth using:
∆Pi =
Sit–k∆Pit + (Pit–k– P––t––k) ∆Sit + ∆Sit ∆Pit iC iC iC(5)
+
Sit(Pit– P––t––k) – Sit–k (Pit–k– P––t––k) iN iX
within-firm between-firmcontinuing-firms
cross-effect
entering exiting
31FDI policy in Ireland does not require minimum domestic equity participation as is the case in
many developing countries, and most FDI is in the form of green-field investment with 100 per cent foreign ownership. The CIP does not provide any information on actual foreign ownership levels in individual plants.
32Plants that changed nationality during the study period were removed from the analysis; this
amounted to less than 1 per cent of total number of plants.
33The classification system of manufacturing industries in these indices is the NACE 70 where
sector codes are different than NACE Rev. 1 classification system that the CIP adopted in classifying plants to different industries after 1991. We mapped the available information at 2-digit and where possible at 3-2-digit level between the NACE 70 and NACE Rev. 1 classifications.
34In order to remove the potential effect of spurious entry/exit rates due to the inclusion of plants
with zero employment or net output figures, these identified plants were removed from 1991, 1995 and 1999 waves accordingly. This led to a decrease of 169, 163 and 158 in the number of observations for 1991, 1995 and 1999 respectively. This decrease in the number of observations is less than 2 per cent of total number of observations in each year.
35Removing the top and bottom percentiles of the net output variables resulted in a loss of 80
where i is the i-th plant and t is the time period, C, N and X correspond to continuing, entering and exiting plants respectively. Since our analysis adds another dimension in which we examine the decomposition of labour productivity for different nationality groups, the industry averages that we use in calculating between, entry and exit terms in the decomposition refer to the corresponding groups’ mean values of productivity in the industry. So, for example, when calculating the contribution of different components to overall productivity growth in Irish plants, we calculate the industry averages as the average productivity of Irish plants in the corresponding sector. This allows us to compare the individual plant productivity levels from the corresponding sector average for each nationality group.
IV DECOMPOSITION OF PRODUCTIVITY GROWTH BY OWNERSHIP
4.1 Overall Decomposition, 1991-1999
Table 2 presents the results for labour productivity decomposition using Equation (5). Labour productivity growth over the period 1991-1999 was 158 per cent. The results for all manufacturing plants indicate that continuing plants and those new entrants whose productivity is above the industry average, have contributed significantly to this labour productivity growth. Within and entry effects accounted for 55 per cent and 29 per cent of overall growth, respectively. The cross-effect, showing the contribution of plants with above industry productivity and employment growth is also positive, reflecting the positive trend of both employment and productivity growth in the manufacturing sector during the period.
4.2 Ownership Decomposition, 1991-1999
[image:14.498.73.436.447.516.2]Next we turn to examine labour productivity growth for foreign and domestic plants separately. Table 2 shows the much higher growth rate in productivity in foreign compared to domestic plants, i.e., 185 per cent and 37 per cent respectively. Obviously some of the difference between the growth rates of productivity of domestic and foreign plants can be attributed to the
Table 2: Labour Productivity Decompositions, 1991-1999
Labour Productivity Net
Growth (%) Within Between Cross Entry Exit Entry
All 158 55 6 7 29 –2 32
Irish 37 73 8 –10 32 3 29
transfer pricing activities of foreign plants, which we cannot estimate. However, while transfer pricing means that the data do not give us reliable estimates of the productivity levels in foreign plants, we do not expect it to have any impact on the decomposition of labour productivity in such plants.36 Productivity growth of Irish plants comes mainly from the within(73 per cent) and net entry(29 per cent) effects. The results for foreign plants also show a similar pattern, but the withinproductivity contribution is much lower (55 per cent) for foreign plants. For both domestic and foreign plants the net entry effect arises mainly from the entry of above average productivity plants.37The
between-term effect, which shows the market share reallocations between continuing plants, is more important for domestic compared with foreign plants, reflecting the structural change within the domestic part of the manufacturing industry during this period.
Since the composition of direct foreign investment changed over the 1990s, with increased extra-EU investment and much less intra-EU investment, it is insightful to look at the differences in their productivity growth rates and the contributing factors. The UK dominates intra-EU investment in Ireland, and the US accounts for almost all of the extra-EU investment.38To reflect this, we decompose intra- and extra-EU investment in Irish manufacturing industry into four categories – UK, Other-EU, US and Other Non-EU.
The most striking result in Table 3 is the extent to which the productivity growth of US plants exceeds that of the other nationality groups. The within-plant effects differ in magnitude three-fold across nationality groups, with a high of 73 per cent for the UK, which is identical to that of domestic plants. The net entry term’s contribution also varies even more widely across nationality groups, reaching a high of 76 per cent (Other Non-EU).39Although it has a similar effect (30 per cent) for UK and US plants, the entry term accounts for all of it for US plants whereas the exit of less productive plants contributes significantly to the UK net entry term.40 Uniquely, the cross effect
36In this paper our primary concern is with the sources rather than the magnitude of productivity
growth, although we do note the differences in the levels of productivity growth across different categories (sectoral groups, ownership) and over time.
37The exit of less productive plants contributes positively to foreign plants whereas, for domestic
plants the exit of more productive plants brings a negative contribution to overall productivity growth.
38The differences between the different nationality groups in Irish manufacturing industry are
outlined in Ruane and Görg (1997). UK plants are mainly engaged in traditional sectors, whereas US plants are mostly in high-tech industries. This forms the basis for our grouping of different nationality of plants.
39 The only negative effect coming from the entry term is in the Other-EU category but its
contribution is negligible.
40 This difference is not surprising given that there are many more UK plants in traditional
term for US plants is positive, reflecting the expansion of US plants that showed increased productivity levels.41 We also see that in Other EU and Other Non-EU plants there is a relatively larger between-effect, reflecting the greater employment share reallocation between plants in these two groups.
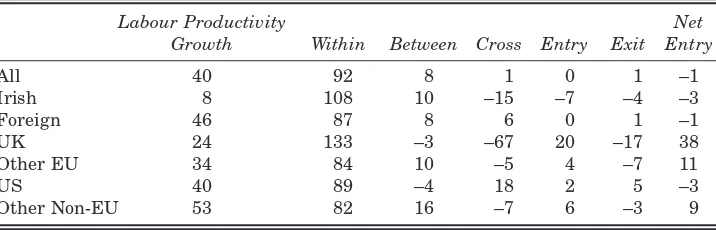
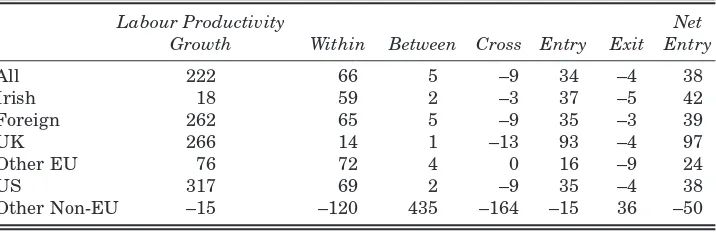
4.3 Ownership Decomposition, 1991-1995, 1995-1999
Foster et al. (1998) argue that the time horizon used in productivity decomposition studies can have an effect on the relative contribution of each of the components. To test whether our results are dependent on the time-period selected, we carry out separate decomposition analyses for the time-periods 1991-95 and 1995-99. Another factor in the choice of these two periods is the growth rates of net output and employment in the Irish manufacturing sector. Table 4 presents percentage changes of net output and employment for both domestic and foreign plants in Irish manufacturing industry for the 1991-95 and 1995-99 periods. Although the whole 1991-1999 period has shown substantial growth in terms of output and employment, the second half of the 1990s saw a greater increase in values, except for employment in foreign plants. Employment levels in Irish plants actually decreased between 1992 and 1994, which were described as the “jobless growth years” in some studies.42
[image:16.498.72.434.151.285.2]Tables 5 and 6 show the decomposition of labour productivity growth by nationality groups for the 1991-95 and 1995-99 periods respectively. Comparison of the two tables reveals that, for both foreign and domestic plants, most of the labour productivity growth occurred after 1995. While the growth rates in productivity in Irish plants were less than in foreign plants, Table 3: Labour Productivity Decompositions for Foreign Plants by
Nationality, 1991-1999
Labour Productivity Net
Growth (%) Within Between Cross Entry Exit Entry
Foreign 185 55 5 10 28 –2 31
UK 55 73 10 –13 20 –10 30
Other EU 71 63 25 –1 –3 –15 12
US 185 55 3 14 29 0 29
Other Non-EU 91 25 15 –15 50 –26 76
41The negative cross effect coefficient for other groups, including Ireland, implies that some of
their productivity growth occurred in plants that were downsizing.
the inter-period differences in growth rates were even more marked, with labour productivity trebling in Irish plants and doubling in foreign plants. These higher second period growth rates must be seen in the context of substantial employment growth for both domestic and foreign plants in the 1995-99 period compared to virtually no change in the 1991-95 period.43The productivity growth differed across nationalities, and it is clear that the US productivity growth dominates the foreign-owned sector in the second period. The rate of productivity growth of all other foreign groups was broadly similar to that of domestic industry in this period.
Table 5:Labour Productivity Decompositions, 1991-1995
Labour Productivity Net
Growth Within Between Cross Entry Exit Entry
All 40 92 8 1 0 1 –1
Irish 8 108 10 –15 –7 –4 –3
Foreign 46 87 8 6 0 1 –1
UK 24 133 –3 –67 20 –17 38
Other EU 34 84 10 –5 4 –7 11
US 40 89 –4 18 2 5 –3
[image:17.498.68.426.455.570.2]Other Non-EU 53 82 16 –7 6 –3 9
Table 4: Percentage Changes in Net Output and Employment in Irish Manufacturing Sector, 1991-99
Net Output (%) Employment (%) All
1991-95 55 12
1995-99 111 13
1991-99 227 26
Irish
1991-95 12 6
1995-99 40 9
1991-99 57 15
Foreign
1991-95 73 20
1995-99 131 18
1991-99 300 41
43In effect both foreign and domestic plants on average were able to increase their productivity
Next we turn to examine the decomposition of labour productivity changes and attempt to ascertain these factors behind the different growth rates for the two periods. In Table 5 we see that in the 1991-95 period, in line with the results from the 1991-99 period, the within effect is the most significant contributor to labour productivity growth for both domestic and foreign plants and the foreign plants drive the overall results in the decomposition analysis. The entry term is negligible overall and negative for Irish plants, in contrast to the strong positive contribution for the whole period in Table 2. We also see that for Irish plants, exit of below average productivity plants was the main positive contributor to the net entry term.
[image:18.498.73.436.97.212.2]Table 6 presents the results of the labour productivity decomposition analysis for 1995-99 period. Within and entry terms are the most important contributors to overall labour productivity growth, with foreign plants once again dominating the overall pattern of results. For foreign plants, comparison of the results for the two periods reveals that the cross term had a positive effect in the first period of the analysis, whereas this effect was negative, on average, in the second half of the period. This shows that foreign plants were more successful in improving their productivity and increasing their employment levels in the first half of the 1990s than in the second half of the period. The higher effect of betweenand entryterms in the second period than in the first period reflects the fact that more efficient plants were able to gain greater market share in terms of employment and that entrants were more productive in the 1991-1995 period than in the 1995-1999 period. The negative cross term in the second half of the period and its positive effect in the first period for US plants, shows that continuing US plants with increasing productivity were able to increase their employment shares in the first half of the analysis whereas, their shares declined in the second half of the period. This can be explained by the much higher contribution of entry of above average productivity plants in this group in the period.
Table 6:Labour Productivity Decompositions, 1995-1999
Labour Productivity Net
Growth Within Between Cross Entry Exit Entry
All 84 64 24 –22 29 –6 35
Irish 27 57 4 –3 38 –5 43
Foreign 95 62 29 –24 24 –8 33
UK 25 92 8 4 1 5 –3
Other EU 28 121 –15 –8 32 30 2
US 104 68 30 –30 24 –8 32
V SECTORAL DECOMPOSITION
In this section, we divide the manufacturing sector into four main groups, based on the OECD classification of plants at the two/three digit level: high-tech, medium high-high-tech, medium low-high-tech, and low-tech. We undertake a decomposition analysis for each of these sectoral groups and we present results separately for foreign and domestic firms.
High-Tech Sectors:
We can see from Table 7 that in the high-tech sectors, overall crossand net entry effects are more substantial than the within-effects reported for aggregate manufacturing in Tables 2 and 3. The positive contribution of cross effect, which is much higher in foreign plants than in domestic ones, suggests that much of the productivity growth occurred in plants that were upsizing. This effect was higher in US and Other-EU plants, implying that these have been more successful in combining increased productivity with increased employment levels. The net entry effect plays an important role for both indigenous and foreign plants and virtually all of the net entryeffect derives from the entry of above average productivity plants.44
[image:19.498.68.427.364.477.2]Overall, results for the high-tech sector show that as opposed to the dominance of within effect in the aggregate results, the entry term is a relatively more important role in this sector. This is in line with the results from the OECD (2001) study, which shows that entry plays a more important role in determining the labour productivity growth in sectors related to information and communication technology.
Table 7:Labour Productivity Decompositions by OECD Sectoral Classification, High-Tech 1991-1999
Labour Productivity Net
Growth Within Between Cross Entry Exit Entry
All 98 10 10 40 38 –2 41
Irish 89 28 –1 7 66 0 66
Foreign 101 10 10 37 39 –4 43
UK 606 1 –2 3 96 –1 98
Other EU 104 79 11 11 –1 0 –1
US 74 12 7 52 26 –3 29
Other Non-EU 159 –21 2 5 104 –10 114
Note: The sectors in the high-tech category are Pharmaceuticals, Office Machinery and Computers and Radio, Television and Communications.
Medium High-Tech Sectors:
The most striking result from Table 8 is that overall productivity decreased for Other Non-EU plants during the period, in contrast to substantial increases in other categories. This decrease has been mainly due to the between-effect,45which reflects the fact that the employment share of the plants that were above average productivity declined in this category during the period. In the medium high-tech sectors overall productivity growth mainly comes from the within and net entry terms, and results from Table 8 show that foreign plants determine the overall average given their strong presence in these sectors.
For domestic plants the main contributing factor to productivity growth in terms of net entrycomes mainly from the exit of below average productivity plants. For all different groups of foreign plants, the between-effectmakes a positive contribution towards their corresponding overall productivity growth, showing that the market shares of above-average productivity plants increased; this effect is strongest for the Other-EU category. In UK plants the net entryeffect accounts for nearly all of the productivity growth, whereas for US plants, within-plant and entry of above average productivity plants are both important.
45When overall productivity growth is negative the interpretation of the effects of different factors
[image:20.498.76.434.251.367.2]in the decomposition analysis changes. So a positive sign in this case would be contributing to this decline in productivity whereas a negative sign will be acting in the opposite direction, in other words improving productivity.
Table 8:Labour Productivity Decompositions by OECD Sectoral Classification, Medium High-Tech 1991-1999
Labour Productivity Net
Growth Within Between Cross Entry Exit Entry
All 222 66 5 –9 34 –4 38
Irish 18 59 2 –3 37 –5 42
Foreign 262 65 5 –9 35 –3 39
UK 266 14 1 –13 93 –4 97
Other EU 76 72 4 0 16 –9 24
US 317 69 2 –9 35 –4 38
Other Non-EU –15 –120 435 –164 –15 36 –50
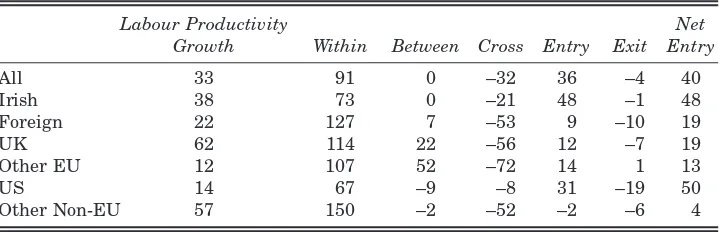
Medium Low-Tech Sectors:
Table 9 shows that labour productivity growth has been higher in domestic plants than in foreign plants in medium low-tech sectors in the 1991-99 period. In contrast to the domination of foreign plants in the overall figures for the high-tech and medium high-tech sectors, domestic plants drive the overall results in this category. The within-effect is much higher for foreign plants whereas the net entrydriven by the entry factor is higher for domestic plants. The negative sign of the cross-effect in this sector reflects the fact that productivity growth is coming from downsizing plants. The between term contributes positively to overall growth for UK and Other-EU plants whereas it has a negative effect for US and Other Non-EU plants. This reflects the fact that above average productivity plants in the former group increased their employment share whereas in the latter group the employment shares of above average productivity plants decreased.46
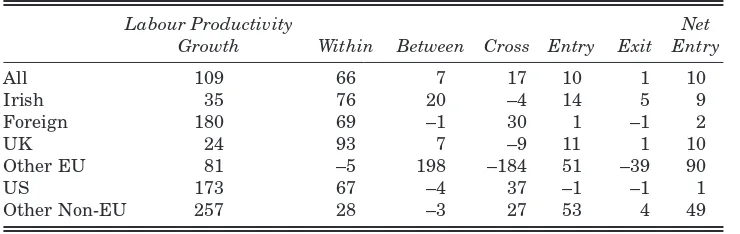
Low-Tech Sectors:
Table 10 presents results for the low-tech sector where within-effects and cross-effects were the main factors driving overall productivity growth. In this sector we again observe that foreign plants dominate the pattern of the contribution of different factors to overall productivity growth. Here the sign of cross-effect is negative only for UK and Other-EU plants, reflecting the fact that productivity growth came from plants that were downsizing in this category. On the other hand the positive and significant contribution of the
46In US plants in the medium low-tech sector, as is the case in the previous two sectors, the within
[image:21.498.67.431.301.417.2]and entry effects account for most of the overall productivity growth.
Table 9:Labour Productivity Decompositions by OECD Sectoral Classification, Medium Low-Tech 1991-1999
Labour Productivity Net
Growth Within Between Cross Entry Exit Entry
All 33 91 0 –32 36 –4 40
Irish 38 73 0 –21 48 –1 48
Foreign 22 127 7 –53 9 –10 19
UK 62 114 22 –56 12 –7 19
Other EU 12 107 52 –72 14 1 13
US 14 67 –9 –8 31 –19 50
Other Non-EU 57 150 –2 –52 –2 –6 4
between-effect in US and Other Non-EU plants shows that these two groups enjoyed both productivity and employment growth in the low-tech sectors. In contrast to the other OECD sectors, entry does not play a significant contributory role to US productivity in this sector. In Other-EU plants, the within-plant effect is actually negative, but this is offset by the huge between-effect, suggesting that the decline in the withinplant productivity is offset by the increase in the market share of above-average productivity plants. In this category we also see the downsizing in the high productivity plants form the negative cross-effect. The main contributing factor in the productivity growth in Other Non-EU plants mainly come from the entry of above average productivity plants and the expansion in the employment levels of high productivity plants.
Overall:
[image:22.498.72.442.107.224.2]Results for the four OECD sector groups show that the within-effect contributes most to overall labour productivity growth in all but one sector, namely, the high-tech sector. In that sector the net entry(driven mainly by the entry of high productivity plants) and cross-term effects contribute most. In the other three sector groups the results show that withinand entryterms, in line with the empirical results from other studies, account for most of the productivity growth. There are differences across nationality groups and these are more prominent between foreign and domestic plants across different sectors. Foreign plants dominate the overall average in all but one sector, medium low-tech sector where we also see that domestic plants’ productivity increase has been greater than that of foreign plants. The cross term is Table 10: Labour Productivity Decompositions by OECD Sectoral
Classification, Low-Tech 1991-1999
Labour Productivity Net
Growth Within Between Cross Entry Exit Entry
All 109 66 7 17 10 1 10
Irish 35 76 20 –4 14 5 9
Foreign 180 69 –1 30 1 –1 2
UK 24 93 7 –9 11 1 10
Other EU 81 –5 198 –184 51 –39 90
US 173 67 –4 37 –1 –1 1
Other Non-EU 257 28 –3 27 53 4 49
negative for all nationality groups in medium-high and medium-low sectors, showing that continuing plants, on the average, increased their productivity levels by downsizing.
VI CONCLUSIONS
Studies that examine the origins of productivity growth (using both total factor and labour productivity) at plant level find that plant performance is heterogeneous and that net changes observed in aggregate data are marked by large differences in productivity performances across plants.
Overall labour productivity in the Irish manufacturing sector increased by 158 per cent between 1991 and 1999; it simultaneously enjoyed strong employment growth in contrast to other European countries. In order to investigate the microeconomic productivity dynamics that took place in Irish manufacturing industry during the 1990s, this paper utilised a labour productivity decomposition approach. Our analysis showed that the key determinant of productivity growth arose from within-plant gains in continuing plants and the entry of new plants with above-average productivity. The dominance of withinand entryeffects on overall productivity growth is in line with Irish industrial policy; it has focused on improving performance among continuing plants and selectively encouraging entry of high-productivity plants into Irish manufacturing industry.
Recognising the large presence of foreign plants in the Irish manufacturing industry, we carried out labour productivity decomposition analysis separately for both foreign and domestic plants, as well as four different nationality groups of plants. Results showed that although within and entry components are the main drivers of average labour productivity growth in all groups, there are marked differences between the size of the effects across the groups, reflecting their different patterns of investment and production.
In order to see the sensitivity of our decomposition results to the time period we investigated the changes for the 1991-95 and 1995-99 periods separately. The results showed that in the first half of the period within plant productivity was the main contributor to overall average productivity growth for both foreign and domestic plants, whereas results from the second period reflect the trend from the overall results where both within and entry components played important roles. This undoubtedly reflects the importance of the establishment of new high-productivity plants in the latter 1990s.
The analysis showed that the within-effect contributes most to overall labour productivity growth in all but one sector, namely, the high-tech sector in which the net entry (mainly driven by the entry effect) and cross term effects contributed most. This shows that in the high-tech sector, the entry of above average productivity plants and employment expansion in some of the high productivity plants have been the main drivers of the productivity growth. This is consistent with the finding for the information and communications technology sector reported in the OECD study.
Overall, the Irish results are similar to those for other country studies. Our analysis goes further than many of the other studies in carrying out decompositions at more disaggregated levels (i.e., by ownership and sector). These additional decompositions point to the marked differences between results when data was disaggregated, reflecting the fact that aggregate productivity decompositions hide systematic heterogeneity in the manufacturing sector.
REFERENCES
AHN, CHIN-HEE, 2000. “Entry, Exit and Aggregate Productivity Growth: Micro Evidence on Korean Manufacturing”, Economics Department Working Paper No. 272, OECD.
BAILY, MARTIN E., CHARLES HULTEN and DAVID CAMPBELL, 1992.
“Productivity Dynamics in Manufacturing Plants”, Brookings Papers on Microeconomic Activity, pp. 187-249.
BALDWIN, JOHN R. and WULONG GU, 2002. “Plant Turnover and Productivity Growth in Canadian Manufacturing” STI Working Papers No. 2, OECD.
BALDWIN, JOHN R., 1995. “Productivity Growth, Plant Turnover and Restructuring in the Canadian Manufacturing Sector”, Statistics Canada Working Paper, No. 87. BALDWIN, JOHN R. and PAUL K. GORECKI, 1991. “Entry, Exit and Productivity Growth” in P.K. Geroski and J. Schwalbach (eds.), Entry and Market Contestability: An International Comparison, Oxford: Basil Blackwell, pp. 244-56. DISNEY, RICHARD, JONATHAN HASKEL and YLVA HEDEN, 2003. “Restructuring and Productivity Growth in UK Manufacturing”, Economic Journal, Vol. 113, No. 489, July, pp. 666-694.
ERICSON, RICHARD and ARIEL PAKES, 1995. “Markov-Perfect Industry Dynamics: a Framework for Empirical Work”, Review of Economic Studies, Vol. 62, No. 1, pp. 53-82.
FOSTER, LUCIA, JOHN HALTIWANGER and C. J. KRIZAN, 1998. “Aggregate Productivity Growth: Lessons from Microeconomic Evidence”, NBER Working Paper, No. 6803
GRILICHES, ZVI and HAIM REGEV, 1995. “Plant Productivity in Israeli Industry: 1979-1988”, Journal of Econometrics, Vol. 65, pp. 175-203.
HAETIWANGER, J., 1997. “Measuring and Analyzing Aggregate Fluctuations: The Importance of Building from Microeconomic Evidence,” Federal Reserve Bank of St Louis Review, Vol. 79, pp. 55–77.
HASKEL, JONATHAN and MATTHEW BARNES, 2000. “Productivity in the 1990s: Evidence from British Plants” mimeo, Queen Mary College, University of London. JOVANOVIC, BOYAN, 1982. “Selection and Evolution of Industry”, Econometrica, Vol.
50, No. 3, pp. 649-670.
OECD, 2001. “Productivity and Plant Dynamics: Evidence from Micro data”, OECD Economic Outlook, No.69, Paris: OECD.
RUANE, FRANCES and HOLGER GÖRG, 1997. “The Impact of Foreign Direct Investment on Sectoral Adjustment in the Irish Economy”, National Institute Economic Review. No.160. pp. 76-86.
SCARPETTA, STEFANO, ANDREA BASSANINI, DIRK PILAT and PAUL
SCHREYER, 2000. “Economic Growth in the OECD Area: Recent Trends at the Aggregate and Sectoral Level”, OECD Economics Department Working Papers, No. 248.