Proceedings of NAACL-HLT 2019, pages 1380–1390 1380
Analyzing the Perceived Severity of Cybersecurity Threats Reported on
Social Media
Shi Zong1, Alan Ritter1, Graham Mueller2and Evan Wright3
1The Ohio State University, OH, USA 2Leidos Inc., VA, USA
3FireEye LLC, CA, USA
{zong.56, ritter.1492}@osu.edu [email protected]
Abstract
Breaking cybersecurity events are shared across a range of websites, including secu-rity blogs (FireEye, Kaspersky, etc.), in addi-tion to social media platforms such as Face-book and Twitter. In this paper, we investi-gate methods to analyze the severity of cyber-security threats based on the language that is used to describe them online. A corpus of 6,000 tweets describing software vulnerabili-ties is annotated with authors’ opinions toward their severity. We show that our corpus sup-ports the development of automatic classifiers with high precision for this task. Furthermore, we demonstrate the value of analyzing users’ opinions about the severity of threats reported online as an early indicator of important soft-ware vulnerabilities. We present a simple, yet effective method for linking software vulner-abilities reported in tweets to Common Vul-nerabilities and Exposures (CVEs) in the Na-tional Vulnerability Database (NVD). Using our predicted severity scores, we show that it is possible to achieve a Precision@50 of 0.86 when forecasting high severity vulnerabilities, significantly outperforming a baseline that is based on tweet volume. Finally we show how reports of severe vulnerabilities online are pre-dictive of real-world exploits.1
1 Introduction
Software vulnerabilities are flaws in computer sys-tems that leave users open to attack; vulnerabili-ties are generally unknown at the time a piece of software is first published, but are gradually iden-tified over time. As new vulnerabilities are discov-ered and verified they are assigned CVE numbers (unique identifiers), and entered into the National Vulnerability Database (NVD).2To help prioritize
1
Our code and data are available at https://github.com/viczong/ cybersecurity threat severity analysis.
2
https://nvd.nist.gov/
Figure 1: Example tweet discussing the dirty copy-on-write (COW) security vulnerability in the Linux kernel.
response efforts, vulnerabilities in the NVD are as-signed severity scores using the Common Vulner-ability and Scoring System (CVSS). As the rate of discovered vulnerabilities has increased in recent years,3the need for efficient identification and pri-oritization has become more crucial. However, it is well known that a large time delay exists be-tween the time a vulnerability is first publicly dis-closed to when it is published in the NVD; a re-cent study found that the median delay between the time a vulnerability is first reported online and the time it is published in the NVD is seven days; also, 75% of threats are first disclosed online giv-ing attackers time to exploit the vulnerability.4
In this paper we present the first study of whether natural language processing techniques can be used to analyze users’ opinions about the severity of software vulnerabilities reported on-line. We present a corpus of 6,000 tweets anno-tated with opinions toward threat severity, and em-pirically demonstrate that this dataset supports au-tomatic classification. Furthermore, we propose a simple, yet effective method for linking soft-ware vulnerabilities reported on Twitter to entries in the NVD, using CVEs found in linked URLs. We then use our threat severity analyzer to con-duct a large-scale study to validate the accuracy of users’ opinions online against experts’ severity
3
https://www.cvedetails.com/browse-by-date.php 4
ratings (CVSS scores) found in the NVD. Finally, we show that our approach can provide an early indication of vulnerabilities that result in real ex-ploits in the wild as measured by the existence of Symantec virus signatures associated with CVEs; we also show how our approach can be used to ret-rospectively identify Twitter accounts that provide reliable warnings about severe vulnerabilities.
Recently there has been increasing interest in developing NLP tools to identify cybersecurity events reported online, including denial of ser-vice attacks, data breaches and more (Ritter et al.,
2015;Chang et al.,2016;Chambers et al.,2018). Our proposed approach in this paper builds on this line of work by evaluating usersopinions toward the severity of cybersecurity threats.
Prior work has also explored forecasting soft-ware vulnerabilities that will be exploited in the wild (Sabottke et al., 2015). Features included structured data sources (e.g., NVD), in addition to the volume of tweets mentioning a list of 31 words. Rather than relying on a fixed set of key-words, we analyze message content to determine whether the author believes a vulnerability is se-vere. As discussed bySabottke et al.(2015), meth-ods that rely on tracking keywords and message volume are vulnerable to adversarial attacks from Twitter bots or sockpuppet accounts (Solorio et al.,
2013). In contrast, our method is somewhat less prone to such attacks; by extracting users’ opin-ions expressed in individual tweets, we can track the provenance of information associated with our forecasts for display to an analyst, who can then determine whether or not they trust the source of information.
2 Analyzing Users’ Opinions Toward the
Severity of Cybersecurity Threats
Given a tweettand named entitye, our goal is to predict whether or not there is a serious cybersecu-rity threat towards the entity based on context. For example, given the context in Figure2, we aim at predicting the severity level towards adobe flash player. We define an author’s perceived severity toward a threat using three criteria: (1) does the author believe that their followers should be wor-ried about the threat? (2) is the vulnerability easily exploitable? and (3) could the threat affect a large number of users? If one or more of these criteria are met, then we consider the threat to be severe.
2.1 Data Collection
To collect tweets describing cybersecurity events for annotation, we tracked the keywords “ddos” and “vulnerability” from Dec 2017 to July 2018 using the Twitter API. We then used the Twitter tagging tool described by Ritter et. al. (2011) to extract named entities,5 retaining tweets that con-tain at least one named entity. To cover as many linguistic variations as possible, we used Jaccard similarity with a threshold of 0.7 to identify and remove duplicated tweets with same date.6
2.2 Mechanical Turk Annotation
We paid crowd workers on Amazon Mechanical Turk to annotate our dataset. The annotation was performed in two phases; during the first phase, we asked workers to determine whether or not the tweet describes a cybersecurity threat toward a tar-get entity, in the second phase the task is to de-termine whether the author of the tweet believes the threat is severe; only tweets that were judged to express a threat were annotated in the second phase. Each HIT contained 10 tweets to be anno-tated; workers were paid $0.20 per HIT. In pilot studies we tried combining these two annotations into a single task, but found low inter-rater agree-ment, especially for the threat severity judgments, motivating the need for separation of the annota-tion procedure into two tasks.
Figure2shows a portion of the annotation inter-face presented to workers during the second phase of annotation. Details of each phase are described below, and summarized in Table1.
Figure 2: A portion of the annotation interface shown to MTurk workers during the threat severity annotation.
Threat existence annotation: Not all tweets in our dataset describe cybersecurity threats, for ex-ample many tweets discuss different senses of the
5
https://github.com/aritter/twitter nlp
Anno. Tweets Total 1st Annotation (5 workers per tweet) 2nd Annotation (10 workers per tweet)
Label # Tweets % Label # Tweets %
6,000 With threat
2,543
42.4 Severe threat 506 25.7
(1,966 for 2nd anno.) Moderate threat 1,460 74.3
[image:3.595.85.514.65.131.2]Without threat 3,457 57.6 /
Table 1: Number of annotated tweets with break-down percentages to each category. In 1st annotation, a tweet contains a threat if more than 3 workers vote for it. In 2nd annotation, a threat is severe if more than 6 workers agree on it. Number of workers cut-offs are determined by comparing to our golden annotations in pilot studies.
word “vulnerability” (e.g., “It’s OK to show vul-nerability”). During the first phase of our annota-tion process, workers judged whether or not there appears to be a cybersecurity threat towards the target entity based on the content of the corre-sponding tweet. We provide workers with 3 op-tions: the tweet indicates (a) a cybersecurity threat towards given entity, (b) a threat, but not towards the target entity, or (c) no cybersecurity threat. Each tweet is annotated by 5 workers.
Threat severity annotation:In the second phase, we collect all tweets judged to contain threats by more than 3 workers in the first phase and anno-tated them for severity. 1,966 tweets were selected out of 6,000.7 For each tweet we provided work-ers with 3 options: the tweet contains (a) a severe, (b) a moderate or (c) no threat toward the target entity. During our pilot study, we found this to be a more challenging annotation task, therefore we increased the number of annotators per tweet to 10 workers, which we found to improve agree-ment with our expert judgagree-ments.
Inter-annotator agreement:During both phases, we monitored the quality of workers’ annotations using their agreement with each other. We cal-culated the annotation agreement of each worker against the majority vote of other workers. We manually removed data from workers who have an agreement less than 0.5, filling in missing an-notations with new workers. We also manually removed data from workers who answered either uniformly or randomly for all HITs.
Agreement with expert judgments: To validate the quality of our annotated corpus we compared the workers’ aggregated annotations against our own expert annotations. We independently anno-tated 150 randomly sampled tweets, 61 tweets of
7We further deduplicate pairs of tweets where the longest common subsequence covers the majority of the text con-tents. During deduplication all hashtags and URLs were re-moved and digits were replaced with 0.
which are marked as containing severe or moder-ate threats. For threat existence annotation, we observe a 0.66 value of Cohen’s κ (Artstein and Poesio,2008) between the expert judgements and majority vote of 5 crowd workers. Although our threat severity annotation task may require some cybersecurity knowledge for accurate judgment, we still achieve 0.52 Cohenκagreement by com-paring majority vote from 10 workers with expert annotations.
2.3 Analyzing Perceived Threat Severity
Using the annotated corpus described in Sec-tion 2.2, we now develop classifiers that detect threats reported online and analyze users’ opin-ions toward their severity. Specifically, given a named entity and tweet, he, ti, our goal is to es-timate the probability the tweet describes a cyber-security threat towards the entity, pthreat(y|he, ti) and also the probability that the threat is severe,
psevere(y|he, ti). In this section, we describe the details of these classifiers and evaluate their per-formance.
We experimented with two baselines to detect reports of cyberthreats and analyze opinions about their severity: logistic regression using bag-of-ngram features, and 1D convolutional neural net-works. In the sections below we describe the input representations and details of these two models.
Logistic regression:We use logistic regression as our first baseline model for both classifiers. In-put representations are bag-of-ngram features ex-tracted from the entire tweet content. Example features are presented in Table4. We use context windows of size 2, 3 and 4 to extract features. We map extracted n-grams that occur only once to a
Convolutional neural networks: We also exper-imented with 1D convolutional neural networks (Collobert et al.,2011;Kim,2014). Given a tweet, the model first applies convolutional operations on input sequences with various filters of different sizes. The intermediate representations for each filter are aggregated using max-pooling over time, followed by a fully connected layer. We choose convolution kernel sizes to be 3, 4 and 5-grams with 100 filters for each. We minimize cross-entropy loss using Adam (Kingma and Ba,2015); the learning rate is set to 0.001 with a batch size of 1 and 5 epochs.
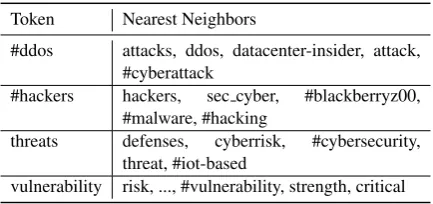
Word embeddings: We train our own cyberse-curity domain word embeddings based on GloVe (Pennington et al., 2014), as 39.7% of our to-kens are treated as OOV words in GloVe pre-trained Twitter embeddings. We used a corpus of 609,470 cybersecurity-related tweets (described in Section2.1) as our training corpus. The dimension of word embeddings is 50. Table2shows nearest neighbors for some sampled cybersecurity terms based on the learned embeddings.
During network training, we initialize word em-bedding layer with our own emem-beddings. We initialize tokens not in our trained embeddings by randomized vectors with uniform distribution from -0.01 to 0.01. We fine-tune the word embed-ding layer during training.
Token Nearest Neighbors
#ddos attacks, ddos, datacenter-insider, attack, #cyberattack
#hackers hackers, sec cyber, #blackberryz00, #malware, #hacking
threats defenses, cyberrisk, #cybersecurity, threat, #iot-based
[image:4.595.72.289.471.573.2]vulnerability risk, ..., #vulnerability, strength, critical
Table 2: Nearest neighbors to some cybersecurity re-lated tokens in our trained word embeddings. Embed-dings are trained by using GloVe. Similar tokens are sorted by cosine similarity scores.
2.3.1 Experimental Setup
For threat existence classification, we randomly split our dataset of 6,000 tweets into a training set of 4,000 tweets, a development set of 1,000 tweets, and test set of 1,000 tweets. For the threat sever-ity classifier, we only used data from 2nd phase of annotation. This dataset consists of 1,966 tweets that were judged by the mechanical turk
work-ers to describe a cybwork-ersecurity threat towards the target entity. We randomly split this dataset into a training set of 1,200 tweets, a development set of 300 tweets, and a test set of 466 tweets. We collapsed the three annotated labels into two cat-egories based on whether or not the author ex-presses an opinion that the threat towards the tar-get entity is severe.
2.3.2 Results
Threat existence classifier: The logistic regres-sion baseline has good performance at identify-ing threats, which we found to be a relatively easy task; area under the precision-recall curve (AUC) on the development and test set presented in Ta-ble5. This enables accurate detection of trending threats online by tracking cybersecurity keywords using the Twitter streaming API, following an ap-proach that is similar to prior work on entity-based Twitter event detection (Ritter et al., 2012;Zhou et al.,2014;Wei et al.,2015). Table3presents an example of threats detected using this procedure on Nov. 22, 2018.8
Threat severity classifier: Figure 3 shows pre-cision recall curves for the threat severity classi-fiers. Logistic regression with bag-of-ngram fea-tures provides a strong baseline for this task. Ta-ble 4 presents examples of high-weight features from the logistic regression model. These features often intuitively indicate severe threats, e.g. “crit-ical vulnerability”, “a massive”, “million”, etc. Without much hyperparameter tuning on the de-velopment set, the convolutional neural network consistently achieves higher precision at the same level of recall as compared to logistic regression. We summarize the performance of our threat exis-tence and severity classifiers in Table5.
3 Forecasting Severe Cybersecurity
Threats
In Section2we presented methods that can accu-rately detect threats reported online and analyze users’ opinions about their severity. We now ex-plore the effectiveness of this model for forecast-ing. Specifically, we aim to answer the following questions: (1) To what extent do users’ opinions about threat severity expressed online align with expert judgments?(2)Can these opinions provide an early indicator to help prioritize threats based
8
Named Entity Example Tweet Existence Severity
apple RT AsturSec: A kernel vulnerability in Apple devices gives access to remote code execution - Packt Hub #infosec #CyberSecurity https://t....
0.96 0.59
google RT binitamshah: Unfixed spoofing vulnerability in Google Inbox mobile apps https://t.co/TWx7jSi1gc
0.78 0.17
adobe RT Anomali: Adobe released patches for three “important-ranked” severity vul-nerabilities, including one vulnerability in Adobe Acrobat and...
0.76 0.32
flash Vulnerability in Flash player allowing code execution. Patch before Black Friday: https://t.co/4idb570d1E #CyberSecurity #vulnerability
0.71 0.43
mac adobe’s flash player for windows, mac and linux has a critical vulnerability that should be patched as a top priori... https://t.co/LLlPATy9vR
[image:5.595.73.531.65.183.2]0.69 0.88
[image:5.595.82.283.254.386.2]Table 3: Top five threats extracted with highest confidence on Nov. 22, 2018. For each entity we aggregate tweets, and average threat existence scores. The tweet with the maximum threat severity score is shown in each instance.
Figure 3: Precision/Recall curves showing perfor-mances of convolutional model (CNN) and logistic re-gression model (LR) for threat severity classification task in test set.
Features Weight Features Weight
ddos attack 1.40 hTARGETi, 0.89 hackers to 1.11 take over 0.87 a massive 1.07 00 countries 0.85 critical vulnerability 1.03 attackers to 0.84 0 billion 0.96 discovered in 0.82 lets attackers 0.95 000 million 0.82
hTARGETiusers 0.91 : #ddos 0.81 a critical 0.91 abuse and 0.81
of a 0.89 , ddos 0.81
[image:5.595.72.291.460.580.2]manyhTARGETi 0.89 a severe 0.79
Table 4: High-weightn-gram features from logistic re-gression model for threat severity classification task.
Task Model Dev AUC Test AUC
Existence LR 0.88 0.85
Severity LR 0.62 0.54 CNN 0.70 0.65
Table 5: Performance of our threat existence and sever-ity classifiers. We show area under the precision-recall curve (AUC) for both development and test sets.
on their severity?
A large corpus of users’ opinions: We follow the same procedure described in Section 2.1 to prepare another dataset for a large-scale evalua-tion. For this purpose, we collected data from Jan 2016 to Nov 2017; this ensures no tweets over-lap with those that were annotated in Section2.2. We collect all English tweets that explicitly con-tain the keyword “vulnerability” within this time period, which results in a total number of 976,180 tweets. 377,468 tweets remain after removing tweets without named entities.
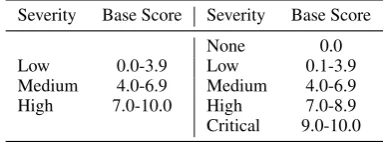
National Vulnerability Database (NVD): NVD is the U.S. government database of software vul-nerabilities. Started in 2000, NVD covers over 100,000 vulnerabilities, assigning a unique CVE number for each threat. These CVE numbers serve as common identifiers. NVD uses the Common Vulnerability Scoring System (CVSS) to measure the severity of threats. CVSS currently has two versions: CVSS v2.0 and CVSS v3.0 standards. CVSS v3.0 is the latest version released in July 2015. We summarize the two standards in Ta-ble6.9
Severity Base Score Severity Base Score
None 0.0 Low 0.0-3.9 Low 0.1-3.9 Medium 4.0-6.9 Medium 4.0-6.9 High 7.0-10.0 High 7.0-8.9 Critical 9.0-10.0
Table 6: Qualitative severity rankings of vulnerabilities in NVD. (Left) CVSS v2.0 standards and (Right) CVSS v3.0 standards.
Matching tweets with NVD records: Evaluat-ing our forecasts of high severity vulnerabilities
9
[image:5.595.319.512.580.651.2] [image:5.595.87.271.627.685.2]relies on accurately matching tweets describing vulnerabilities to their associated NVD records. To achieve this we present a simple, yet effective method that makes use of content in linked web-pages. We find that 82.4% of tweets contain exter-nal urls in our dataset.
Our approach to link tweets to CVEs is to search for CVE numbers either in url addresses or in corresponding web pages linked in tweets report-ing vulnerabilities.10 We ignore web pages that contain more than one unique CVE to avoid po-tential ambiguities. Using this approach, within our dataset, 79,383 tweets were linked to 10,565 unique CVEs. In order to stimulate a forecasting scenario, we only consider CVEs where more than two associated tweets were posted at least 5 days ahead of official NVD publication date. In our dataset, 13,942 tweets are finally selected for fore-cast evaluation, covering 1,409 unique CVE num-bers. To evaluate the accuracy of this linking pro-cedure, we randomly sampled 100 matched pairs and manually checked them. We find the precision of our matching procedure to be very high: only 2 mismatches out of 100 are found.
3.1 Forecasting Models
Now that we have a linking between tweets and CVE numbers, our goal is to produce a sorted list of CVEs with those that are indicated to be severe threats the top. We consider two ranking proce-dures, detailed below; the first is based on users’ opinions toward the severity of a threat, and the second is a baseline that simply uses the volume of tweets describing a specific vulnerability to mea-sure its severity. To simplify the exposition below, we denote each CVE number as CVEi, and the
collection of tweets linked to this CVE number as
TCVEi ={k|tweettkis mapped to CVEi}.
Our model: Our severe threat classifier assigns a severity scorepseverity(y|he, ti)for each tuple of name entity e and corresponding tweet t. For a specific CVE, we define our severity forecast score to be the maximum severity scores among all tu-ples from matched tweets h·, tki (a single tweet
10
Readers may be wondering why a CVE number has been generated before it is officially published in the database. This is due to the mechanism of assigning CVEs. Some iden-tified companies have the right to assign CVEs or have al-ready reversed some CVEs. When a threat appears, a CVE number is assigned immediately before any further tion. NVD only officially publishes a threat after all evalua-tions are completed. Therefore, there is a time delay between CVE entry established date and the official publication date.
may contain more than one name entity):
(CVEi)forecast score= max
k∈TCVEi
pseverity(y|h·, tki).
Tweet volume baseline: Intuitively, the number of tweets and retweets can indicate people’s con-cern about a specific event. Specifically, the sever-ity for threat CVEiaccording to the volume model
is defined by the cardinality ofTCVEi:
(CVEi)volume score =|TCVEi|.
3.2 Forecasting CVSS Ratings
In our first set of experiments, we compare our forecasted threat severity scores against CVSS rat-ings from the NVD. We define a threat as being severe if its CVSS score is≥7.0. This cut-off cor-responds to qualitative severity ratings provided by CVSS (marked as HIGH or CRITICAL in Ta-ble6).11 We use the newest v3.0 scoring system, which was developed to improve v2.0.12 Large software vendors have announced of the adapta-tion of the CVSS v3.0 standards, including Cisco, Oracle, SUSE Linux, and RedHat.
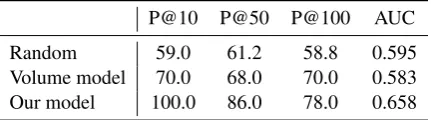
We evaluate our models’ performance at identi-fying severe threats five days ahead of the NVD publication date, within their top k predictions. Table7shows our results. We observe that tweet volume performs better than a random baseline; having a large number of tweets beforehand is a good indicator for high severity, however our ap-proach which analyzes the content of messages discussing software vulnerabilities achieves sig-nificantly better performance; 86% of its top 50 forecasts were indeed rated as HIGH or CRITI-CAL severity in the NVD.
P@10 P@50 P@100 AUC
Random 59.0 61.2 58.8 0.595
Volume model 70.0 68.0 70.0 0.583
[image:6.595.308.524.563.623.2]Our model 100.0 86.0 78.0 0.658
Table 7: Model performance of identifying severe threats (CVSS scores ≥ 7.0) with Precision@k and area under the precision-recall curve (AUC) metrics. For majority random baseline, we average over 10 trails.
11The Forum of Incident Response and Security Teams (FIRST) also provides an example guideline that recom-mends patching all vulnerabilities with CVSS scores≥7.0. Seehttps://www.first.org/cvss/cvss-based-patch-policy.pdf.
12
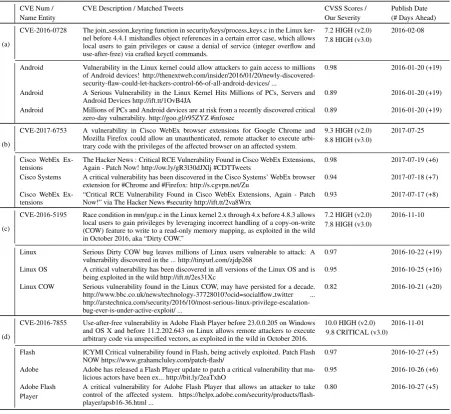
CVE Num / Name Entity
CVE Description / Matched Tweets CVSS Scores / Our Severity
Publish Date (# Days Ahead)
(a)
CVE-2016-0728 The join session keyring function in security/keys/process keys.c in the Linux ker-nel before 4.4.1 mishandles object references in a certain error case, which allows local users to gain privileges or cause a denial of service (integer overflow and use-after-free) via crafted keyctl commands.
7.2 HIGH (v2.0) 7.8 HIGH (v3.0)
2016-02-08
Android Vulnerability in the Linux kernel could allow attackers to gain access to millions of Android devices! http://thenextweb.com/insider/2016/01/20/newly-discovered-security-flaw-could-let-hackers-control-66-of-all-android-devices/ ...
0.98 2016-01-20 (+19)
Android A Serious Vulnerability in the Linux Kernel Hits Millions of PCs, Servers and Android Devices http://ift.tt/1OvB4JA
0.89 2016-01-20 (+19)
Android Millions of PCs and Android devices are at risk from a recently discovered critical zero-day vulnerability. http://goo.gl/r95ZYZ #infosec
0.89 2016-01-20 (+19)
(b)
CVE-2017-6753 A vulnerability in Cisco WebEx browser extensions for Google Chrome and Mozilla Firefox could allow an unauthenticated, remote attacker to execute arbi-trary code with the privileges of the affected browser on an affected system.
9.3 HIGH (v2.0) 8.8 HIGH (v3.0)
2017-07-25
Cisco WebEx Ex-tensions
The Hacker News : Critical RCE Vulnerability Found in Cisco WebEx Extensions, Again - Patch Now! http://ow.ly/gR3l30dJXlj #CDTTweets
0.98 2017-07-19 (+6)
Cisco Systems A critical vulnerability has been discovered in the Cisco Systems’ WebEx browser extension for #Chrome and #Firefox: http://s.cgvpn.net/Zu
0.94 2017-07-18 (+7)
Cisco WebEx Ex-tensions
“Critical RCE Vulnerability Found in Cisco WebEx Extensions, Again - Patch Now!” via The Hacker News #security http://ift.tt/2va8Wrx
0.93 2017-07-17 (+8)
(c)
CVE-2016-5195 Race condition in mm/gup.c in the Linux kernel 2.x through 4.x before 4.8.3 allows local users to gain privileges by leveraging incorrect handling of a copy-on-write (COW) feature to write to a read-only memory mapping, as exploited in the wild in October 2016, aka “Dirty COW.”
7.2 HIGH (v2.0) 7.8 HIGH (v3.0)
2016-11-10
Linux Serious Dirty COW bug leaves millions of Linux users vulnerable to attack: A vulnerability discovered in the ... http://tinyurl.com/zjdp268
0.97 2016-10-22 (+19)
Linux OS A critical vulnerability has been discovered in all versions of the Linux OS and is being exploited in the wild http://ift.tt/2es31Xc
0.95 2016-10-25 (+16)
Linux COW Serious vulnerability found in the Linux COW, may have persisted for a decade. http://www.bbc.co.uk/news/technology-37728010?ocid=socialflow twitter ... http://arstechnica.com/security/2016/10/most-serious-linux-privilege-escalation-bug-ever-is-under-active-exploit/ ...
0.82 2016-10-21 (+20)
(d)
CVE-2016-7855 Use-after-free vulnerability in Adobe Flash Player before 23.0.0.205 on Windows and OS X and before 11.2.202.643 on Linux allows remote attackers to execute arbitrary code via unspecified vectors, as exploited in the wild in October 2016.
10.0 HIGH (v2.0) 9.8 CRITICAL (v3.0)
2016-11-01
Flash ICYMI Critical vulnerability found in Flash, being actively exploited. Patch Flash NOW https://www.grahamcluley.com/patch-flash/
0.97 2016-10-27 (+5)
Adobe Adobe has released a Flash Player update to patch a critical vulnerability that ma-licious actors have been ex... http://bit.ly/2eaTxhO
0.95 2016-10-26 (+6)
Adobe Flash Player
A critical vulnerability for Adobe Flash Player that allows an attacker to take control of the affected system. https://helpx.adobe.com/security/products/flash-player/apsb16-36.html ...
0.80 2016-10-27 (+5)
Table 8: Top 4 threats identified by our forecast model. Severity scores are generated by using threat severity classifier in Section2.3.
Table8presents top 4 forecast results from our model. We observe that our model can predict ac-curate severity level even 19 days ahead of the of-ficial published date in NVD (Table8(a), (c)).
3.3 Predicting Real-World Exploits
In addition to comparing our forecasted sever-ity scores against CVSS, as described above, we also explored several alternatives suggested by the security community to evaluate our methods: (1) Symantec’s anti-virus (AV) signatures13 and intrusion-protection (IPS) signatures,14in addition to (2) Exploit Database (EDB).15
Sabottke et al.(2015) suggested Symantec’s AV and IPS signatures are the best available indicator
13
https://www.symantec.com/security-center/a-z 14
https://www.symantec.com/security response/attacksignatures/ 15
https://www.exploit-db.com/
for real exploitable threats in the wild. We fol-low their method of explicitly querying for CVE numbers from the descriptions of signatures to generate exploited threats ground truth. Exploit Database (EDB) is an archive of public exploits and software vulnerabilities. We query EDB for all threats that have been linked into NVD.16 In total we gathered 134 CVEs verified by Symantec and EDB to be real exploits within the 1,409 CVEs used in our forecasting evaluation.
We evaluate the number of exploited threats identified within our top ranked CVEs. Table 9
presents our results. We observe that 7 of top 10 threats from our model were exploited in the wild. We also observe that for the actual CVSS v3.0 scores, only 1 out of the top 10 vulnerabilities was
16
[image:7.595.75.527.62.476.2]exploited.
Top 10 Top 50 Top 100
P R P R P R
[image:8.595.71.289.88.155.2]True CVSS 10.0 0.7 16.0 6.0 16.0 11.9 Volume model 60.0 4.5 22.0 8.2 19.0 14.2 Our model 70.0 5.2 28.0 10.4 21.0 15.7
Table 9: Model performance against real-world ex-ploited threats identified by Symantec and Exploit-DB. “True CVSS” refers to ranking CVEs based on actual CVSS scores in NVD. This model is only for reference and can not be used in real practice, as we do not know true CVSS scores when forecasting.
3.4 Identifying Accounts that Post Reliable Warnings
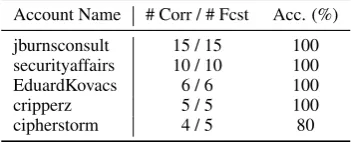
Finally we perform an analysis of the reliability of individual Twitter accounts. We evaluate all accounts with more than 5 tweets exceeding 0.5 confidence score from our severity classifier. Ta-ble10 presents our results. Accounts in our data whose warnings were found to have highest preci-sion when compared against CVSS include “@se-curityaffairs” and “@EduardKovacs”, which are known to post security related information, and both have more than 10k followers.
Account Name # Corr / # Fcst Acc. (%)
jburnsconsult 15 / 15 100 securityaffairs 10 / 10 100 EduardKovacs 6 / 6 100 cripperz 5 / 5 100 cipherstorm 4 / 5 80
Table 10: List of users with top accuracies on forecast-ing severe cybersecurity threats.
4 Related Work
There is a long history of prior work on analyz-ing users’ opinions online (Wiebe et al.,2004), a large body of prior work has focused on sentiment analysis (Pang et al.,2002;Rosenthal et al.,2015), e.g., determining whether a message is positive or negative. In this paper we developed annotated corpora and classifiers to analyze users’ opinions toward the severity of cybersecurity threats re-ported online, as far as we are aware this is the first work to explore this direction.
Forecasting real-world exploits is a topic of in-terest in the security community. For example,
Bozorgi et al.(2010) train SVM classifiers to rank
the exploitability of threats. Several studies have also predicted CVSS scores from various sources including text descriptions in NVD (Han et al.,
2017;Bullough et al.,2017).
Prior work has also explored a variety of fore-casting methods that incorporate textual evidence (Smith, 2010), including the use of Twitter mes-sage content to forecast influenza rates (Paul et al.,
2014), predicting the propagation of social media posts based on their content (Tan et al.,2014) and forecasting election outcomes (O’Connor et al.,
2010;Swamy et al.,2017).
5 Conclusion
In this paper, we presented the first study of the connections between the severity of cybersecurity threats and language that is used to describe them online. We annotate a corpus of 6,000 tweets describing software vulnerabilities with authors’ opinions toward their severity, and demonstrated that our corpus supports the development of auto-matic classifiers with high precision for this task. Furthermore, we demonstrate the value of analyz-ing users’ opinions about the severity of threats reported online as an early indicator of important software vulnerabilities. We presented a simple, yet effective method for linking software vulnera-bilities reported in tweets to Common Vulnerabil-ities and Exposures (CVEs) in the National Vul-nerability Database (NVD). Using our predicted severity scores, we show that it is possible to achieve a Precision@50 of 0.86 when forecasting high severity vulnerabilities, significantly outper-forming a baseline that is based on tweet volume. Finally we showed how reports of severe vulnera-bilities online are predictive of real-world exploits.
Acknowledgments
[image:8.595.93.269.437.508.2]content of the information in this document does not necessarily reflect the position or the policy of the Government, and no official endorsement should be inferred. The U.S. Government is autho-rized to reproduce and distribute reprints for gov-ernment purposes notwithstanding any copyright notation here on.
References
Luca Allodi and Fabio Massacci. 2012. A prelimi-nary analysis of vulnerability scores for attacks in wild: The ekits and sym datasets. InProceedings of the 2012 ACM Workshop on Building Analysis Datasets and Gathering Experience Returns for Se-curity, BADGERS ’12, pages 17–24, New York, NY, USA. ACM.
Ron Artstein and Massimo Poesio. 2008. Inter-coder agreement for computational linguistics. Computa-tional Linguistics, 34(4):555–596.
Mehran Bozorgi, Lawrence K. Saul, Stefan Savage, and Geoffrey M. Voelker. 2010. Beyond heuristics: Learning to classify vulnerabilities and predict ex-ploits. In Proceedings of the 16th ACM SIGKDD International Conference on Knowledge Discovery and Data Mining, KDD ’10, pages 105–114, New York, NY, USA. ACM.
Benjamin L. Bullough, Anna K. Yanchenko, Christo-pher L. Smith, and Joseph R. Zipkin. 2017. Predict-ing exploitation of disclosed software vulnerabilities using open-source data. In Proceedings of the 3rd ACM on International Workshop on Security And Privacy Analytics, IWSPA ’17, pages 45–53, New York, NY, USA. ACM.
Nathanael Chambers, Ben Fry, and James McMasters. 2018. Detecting denial-of-service attacks from so-cial media text: Applying nlp to computer security. InProceedings of the 2018 Conference of the North American Chapter of the Association for Computa-tional Linguistics: Human Language Technologies, Volume 1 (Long Papers), pages 1626–1635.
Ching-Yun Chang, Zhiyang Teng, and Yue Zhang. 2016. Expectation-regulated neural model for event mention extraction. InProceedings of the 2016 Con-ference of the North American Chapter of the Asso-ciation for Computational Linguistics: Human Lan-guage Technologies, pages 400–410.
Ronan Collobert, Jason Weston, L´eon Bottou, Michael Karlen, Koray Kavukcuoglu, and Pavel Kuksa. 2011. Natural language processing (almost) from scratch. Journal of Machine Learning Research, 12:2493–2537.
Zhuobing Han, Xiaohong Li, Zhenchang Xing, Hong-tao Liu, and Zhiyong Feng. 2017. Learning to pre-dict severity of software vulnerability using only
vulnerability description. In 2017 IEEE Interna-tional Conference on Software Maintenance and Evolution (ICSME), pages 125–136.
Yoon Kim. 2014. Convolutional neural networks for sentence classification. In Proceedings of the 2014 Conference on Empirical Methods in Natural Language Processing (EMNLP), pages 1746–1751, Doha, Qatar. Association for Computational Lin-guistics.
Diederik P. Kingma and Jimmy Ba. 2015. Adam: A method for stochastic optimization. InInternational Conference on Learning Representations.
Brendan O’Connor, Ramnath Balasubramanyan, Bryan R Routledge, and Noah A Smith. 2010. From tweets to polls: Linking text sentiment to public opinion time series. In Proceedings of the Fourth International AAAI Conference on Weblogs and Social Media.
Bo Pang, Lillian Lee, and Shivakumar Vaithyanathan. 2002. Thumbs up?: sentiment classification using machine learning techniques. InProceedings of the ACL-02 conference on Empirical methods in natu-ral language processing-Volume 10. Association for Computational Linguistics.
Michael J Paul, Mark Dredze, and David Bronia-towski. 2014. Twitter improves influenza forecast-ing.PLOS Currents Outbreaks.
Jeffrey Pennington, Richard Socher, and Christo-pher D. Manning. 2014. Glove: Global vectors for word representation. InEmpirical Methods in Nat-ural Language Processing (EMNLP), pages 1532– 1543.
Alan Ritter, Sam Clark, Mausam, and Oren Etzioni. 2011. Named entity recognition in tweets: An ex-perimental study. InProceedings of the 2011 Con-ference on Empirical Methods in Natural Language Processing, pages 1524–1534, Edinburgh, Scotland, UK. Association for Computational Linguistics.
Alan Ritter, Oren Etzioni, Sam Clark, et al. 2012. Open domain event extraction from twitter. In Proceed-ings of the 18th ACM SIGKDD international con-ference on Knowledge discovery and data mining. ACM.
Alan Ritter, Evan Wright, William Casey, and Tom Mitchell. 2015. Weakly supervised extraction of computer security events from twitter. In Proceed-ings of the 24th International Conference on World Wide Web, pages 896–905. International World Wide Web Conferences Steering Committee.
Carl Sabottke, Octavian Suciu, and Tudor Dumitras. 2015. Vulnerability disclosure in the age of so-cial media: Exploiting twitter for predicting real-world exploits. In 24th USENIX Security Sym-posium (USENIX Security 15), pages 1041–1056, Washington, D.C. USENIX Association.
Noah A. Smith. 2010. Text-driven forecasting.
Thamar Solorio, Ragib Hasan, and Mainul Mizan. 2013. A case study of sockpuppet detection in wikipedia. InProceedings of the Workshop on Lan-guage Analysis in Social Media.
Sandesh Swamy, Alan Ritter, and Marie-Catherine de Marneffe. 2017. ” i have a feeling trump will win...”: Forecasting winners and losers from user predictions on twitter. InProceedings of the 2017 Conference on Empirical Methods in Nat-ural Language Processing.
Chenhao Tan, Lillian Lee, and Bo Pang. 2014. The effect of wording on message propagation: Topic-and author-controlled natural experiments on twitter. InACL.
Wei Wei, Kenneth Joseph, Wei Lo, and Kathleen M Carley. 2015. A bayesian graphical model to dis-cover latent events from twitter. InICWSM.
Janyce Wiebe, Theresa Wilson, Rebecca Bruce, Matthew Bell, and Melanie Martin. 2004. Learning subjective language. Computational linguistics.
Theresa Wilson, Janyce Wiebe, and Paul Hoffmann. 2005. Recognizing contextual polarity in phrase-level sentiment analysis. In Proceedings of Hu-man Language Technology Conference and Confer-ence on Empirical Methods in Natural Language Processing, pages 347–354, Vancouver, British Columbia, Canada. Association for Computational Linguistics.
Deyu Zhou, Liangyu Chen, and Yulan He. 2014. A simple bayesian modelling approach to event extrac-tion from twitter. InProceedings of the 52nd Annual Meeting of the Association for Computational Lin-guistics (Volume 2: Short Papers).
A Linking Algorithm
We describe our approach to match tweets with NVD records in full detail in Algorithm1.
B Limitations of CVSS and Real-World
Exploits Ground Truth
In Section3.2- Section3.3, we compare our fore-cast results with (1) CVSS ratings, and (2) real ex-ploited threats identified by Symantec signatures and Exploit Database. Each of these sources of
17If a tweet or its associate urls explicitly contains a CVE number, then we ignore this maximum time range constraint.
Algorithm 1Linking tweets to NVD records.
1: // Linking
2: forevery tweettdo
3: ifCVE number in tweet context or in url linksthen
4: match CVEs to this tweet 5: else
6: query webpage contents to search for CVEs 7:
8: // Check linking results
9: Keep tweets that matched to only one unique CVE to avoid ambiguities
10:
11: // Apply time constraints
12: Select out tweets that are posted at least 5 days ahead of official NVD publication date (at most 365 days17)
ground truth have limitations, which we discuss below.
CVSS ratings are widely used as standard in-dicators for risk measurement in practice. How-ever, one problem of CVSS ratings is that high severity threats do not necessarily lead to real-world exploits. Allodi and Massacci(2012) show that only a small portion (around 2%) of reported vulnerabilities were found to be exploited in the wild. Furthermore, more than half of the threats in NVD are marked as HIGH or CRITICAL, causing a large burden on vendors to fix.18 We also no-tice these CVSS scores are closely tied with spe-cific categories of threats. For example, 85.6% of buffer errors are marked as HIGH or CRITICAL, while 72.5% of information leaks were marked as MEDIUM or LOW. All these issues post chal-lenges on how to prioritize real exploitable threats, with the goal of reducing false positives and false negatives simultaneously. Our work provides one such additional source of information for helping to prioritize threats.
The ground truth we use for real exploited threats is still an incomplete list. For example, Linux kernel vulnerabilities are less likely to ap-pear in Symantec signatures, as Symantec does not have a security product for Linux. Identifying real exploited threats is a difficult task; to the best of our knowledge, there does not exist an easy-to-access list covering all exploited threats currently.
C Additional Analysis of Results
In this section, we present further analyses of peo-ple’s online behaviors when discussing cybersecu-rity threats on social media.
We find that the real severity of threats is
pre-18
CVE Num Name Entity Tweet Our Score Real Severity (a) CVE-2017-4984 EMC VNX1VNX2
OE
threatmeter: Vuln: EMC VNX1/VNX2 OE for File CVE-2017-4984 Remote Code Execution Vulnerability http://ift.tt/2rWXQXa
0.01 10.0 HIGH (v2.0) 9.8 CRITICAL (v3.0)
(b) CVE-2016-1730 iPhone A newly discovered vulnerability may expose iPhone users to attack whenusing a Wi-Fi hotspot - via @InfosecurityMag http://owl.li/Xw3VO 0.76 5.8 MEDIUM (v2.0)5.4 MEDIUM (v3.0) iPhone Apple iOS Flaw Enables Attacks via Hotspot: The vulnerability opens up
iPhone users to a raft of problems, inc... http://bit.ly/1JqGtD9
[image:11.595.71.530.62.128.2]0.45
Table 11: Some examples of forecast errors made by our model. (a) False negative examples: there is no clear language clue for demonstrating the severity of threats, experts are needed for threats of this kind. (b) False positive examples: there exist some signals captured by our model for being severe threats, but actual severity might be overestimated.
dictable based on users’ opinions online. We ob-serve several repeated patterns in how people de-scribe severe threats. We summarize some of these patterns below:
• describing severity levels (see Ap-pendix C.1), such as “critical”, “serious”, “highly”;
• describing the number of users or devices af-fected, such as “millions of hTARGETi de-vices”, “huge number of”;
• potential consequences, such as “allows hackers to”, “could allow for remote code ex-ecution”, “malware”;
• alerts or warnings, such as “please be aware”, “warning”;
• suggesting immediate actions, such as “patch now”.
C.1 Usage of Subjective Adjectives
We notice people rely on adjectives for describing the level of severity for threats, rather than numer-ical scores. These subjective adjectives form our initial impressions on these threats.
We examine subjective adjectives people use for measuring threats. We run POS tagging to extract all tokens marked asJJ,JJP, andJJS. We then rank subjective adjectives in Subjectivity Lexicon (SUB) (Wilson et al.,2005) by log-odds ratio of their occurrences in NVD descriptions for HIGH or CRITICAL threats versus MEDIUM or LOW threats. Table 12 presents top ranked subjective adjectives. We observe variants people are using for severe threats, e.g. “serious”, “severe”, “mali-cious”, etc.
C.2 Temporal Analysis
We collect all CVEs having matched tweets posted at least 1 day ahead of the official NVD publica-tion date, resulting in a set of 3,678 CVEs. Within our dataset, 84.7% of CVEs are reported within 60 days after the first disclosure on social media. We
Adj. Ratio Adj. Ratio Adj. Ratio serious 2.01 aware 1.61 fast 1.39 pivotal 1.95 most 1.61 original 1.39 sure 1.95 vivid 1.61 able 1.39 free 1.95 accessible 1.39 blind 1.39 active 1.79 popular 1.39 arbitrary 1.35 intelligent 1.79 deep 1.39 high 1.30 static 1.79 black 1.39 incomplete 1.25 critical 1.67 top 1.39 malicious 1.20 severe 1.61 dangerous 1.39 wily 1.10 great 1.61 wild 1.39 evil 1.10
Table 12: Top ranked log-odds ratio of subjective ad-jectives describing severe threats (CVSS scores≥7.0) versus non-severe threats (CVSS scores<7.0). Sub-jective adSub-jectives are identified by using Subjectivity Lexicon (SUB) (Wilson et al.,2005).
observe a median of 5 days delay in our dataset, whereas some of threats have significant longer delays. For example, CVE-2016-212319 (Over-flow Remote Code Execution Vulnerability) first appears at Twitter on Dec. 19, 201620, but is pub-lished in NVD on Nov. 1, 2018. It again shows the difficulty of threat evaluation and management.
C.3 Error Analysis
We evaluate two types of errors with respect to forecasting high severity vulnerabilities: false pos-itive and false negative examples. We observe that some severe threats are difficult to predict based on contents in general, such as Table11(a). There is no clear clue for estimating the severity level merely on tweet contents.
We present another incorrect example extracted by our forecast system in Table11(b). We notice tokens like “expose users to attack”, “opens up to a raft of problems”, etc. This threat does seem to be exploitable and harmful to a lot of users. However, experts mark it as of medium severity. It might be the case that the actual severity level of some threats are overestimated by some accounts.
19
https://nvd.nist.gov/vuln/detail/CVE-2016-2123 20
[image:11.595.307.524.206.314.2]