Abstract— An algorithm utilizing similarity metric to find the highest similarity measure between images in a database as available on the internet was studied. The main objective was to implement an algorithm using squared correlation coefficient as the metric and it is fully developed in Java language, also supported by an image processing architecture, ImageJ. The main part of this work was the image comparison process, based on a non-segmented method where the similarity in images was measured utilizing all the image intensity values specified by a region of interest on the images. Some assumptions were made for the implementation of the algorithm after considering possible object recognition problems and constraints encountered in the real situation to retrieve the stolen item images. The algorithm was tested for 100 images of a self-constructed image database and produced the output of sorted ranks of highest similarity measure in the form of tabbed-separated data and a text file.
Index Terms— area of similarity, image comparison, object recognition, similarity value
I. INTRODUCTION
Human ability in recognizing object is largely invariant even if the object is changed by the size, position or viewpoint of the object. A lot of researches have been developed in this area of implementing such human ability onto the computer and applying it for image retrieval system on a large image database. The most common and traditional method being utilized today is textual-based image retrieval, such as the Google image search engine. The method requires for addition of metadata such as text descriptions, captions or keywords for annotation to the images.
The advancement of image retrieval field nowadays is actually to avoid human inputted metadata and focusing more on the visual similarity in the image. Along with the rapid increment of internet users especially on online marketing and to focus more on virtual auction house, the usage of images for the items sold online are also increasing. An item auctioned online, however, can never tell the buyer if the item was a stolen item.
This indeed motivates the work to be developed in the
Manuscript received March 3, 2010.
Fadzliana Saad is with Universiti Teknologi MARA, 40450, Shah Alam, Malaysia (phone: +603-55436119; fax: +60355435057; e-mail: [email protected]).
Rainer Stotzka is with Karlsruhe Technologie Institute (KIT), Institute of Data Processing and Electronics, Hermann-von-Helmholtz-Platz, Eggenstein-Leopoldshafen, Germany.
digital forensic area in recognizing items from images available in the virtual auction house, for example, e.Bay.com [1], which might be useful for securing the stolen items back.
This work focuses on implementing an object recognition algorithm where visual similarity in two images is measured using similarity metric. In imitating the real internet world of huge image database, the algorithm is tested with a 100 images from a self-constructed database. The object recognition is done by comparing two images at once- one is selected as the reference image and another one is selected from other images in the database as the target images.
The object recognition concept used in this algorithm implementation is inspired by the work done by Björn Körtner [2], Stolen Goods Internet Detector which was running in grid computing service of Karlsruhe Institute of Technologie and also known as KOMMISSAR COMPUTER [3].
When images are captured, usually they are captured in different times and by different sensors or capturing devices. The problems concerned in this work are only images with different sizes, change in illuminations and different viewpoints. Since the images are focused for the images available at the online auction house, the related problem constraints are; the reference image is having only one object that is dominant and positioned about the center of the image, and the target image is having similar properties to the reference image with variations of size, illumination and viewpoint that includes scaling, translation and rotation.
II. OBJECT RECOGNITION STRATEGY
Two stages involved in an object recognition system are acquisition and recognition [4]. Acquisition of images is to form a database based on descriptions of the object presented in the image. Recognition is when an image is given to the system as a reference and it is compared to other images in the database to retrieve the similar object on the target image represented by the reference image.
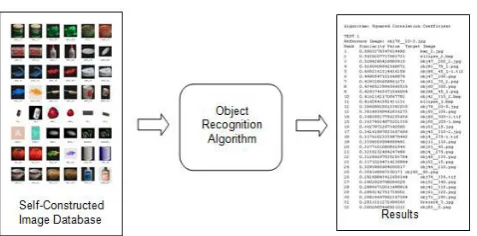
This work focuses only on the recognition part and the self-constructed image database for testing the algorithm corresponds to the stated problems and constraints. The overview of the development of the object recognition strategy is depicted in Fig. 1.
Utilization of Similarity Metric in the
Implementation of an Object Recognition
Algorithm using Java
Fig. 1 Overview of the development of the object recognition strategy
The object recognition algorithm acquires the images from the database for comparison, processes the image datasets of the images being compared and produces the results obtained from all the comparisons done on the whole database.
III. METHODOLOGY FOR OBJECT RECOGNITION ALGORITHM
The methods used in implementing the object recognition algorithm are divided into two parts that are methods for similarity metric and for image comparison.
A. Similarity Metric
Similarity metric is the approach used in this work in finding a measure on how similar the object represented in the target image as the object depicted in the reference image. The similarity value obtained will show the ability of the metric to recognize the object. This value is calculated by processing the image intensity values as the image data which implied by the area of similarity. The comparison of images may involve problems that require a specific similarity metric as the solution, for example, the difference in modality in the images being compared which can be caused by the changes in illumination
.
The metric chose for the implementation of this algorithm is squared correlation coefficient. Correlation coefficient is a measure on how strong a linear relationship between two sets of image intensity values according to pixel. The value of correlation coefficient is between -1 to +1. With +1, the linear relationship is increasing and -1 indicates for decreasing linear relationship [5]. When the datasets are statistically independent the correlation coefficient is zero. A strong relationship is the value closest to 1 regardless of the sign to this value.
It is important for the similarity value obtained to be maximizing or minimizing when reaching the highest similarity point in the image comparison. An image comparison that involves two same images will give the correlation coefficient value of +1 and when one image is inverted, the value obtained is -1. At this point the difference is only the sign of the value. Therefore, the implementation for the algorithm is using the squared correlation coefficient value instead of just the correlation coefficient. In this way the problem of anti-correlation is solved. The metric is maximized as the images are having the highest similarity and the equations are as shown below;
g f fg
cov (1)
1 0 2 1 0 1 0 2 1 0 1 0 1 0 1 y N y g x,y g x N x y N y f x,y f x N x y N y g x,y g f x,y f x N x N
2 1 0 2 1 0 1 0 2 1 0 1 0 1 0 1 y Ny g x,y g x
N
x y
N
y f x,y f x
N
x
y N
y f x,y f g x,y g x N x N S
where
is the correlation coefficient,cov
fg is the covariance of the reference image and the target image,
f is the standard deviation of the reference image,
g is the standard deviation of the target image, S is the similarity value,f
is the mean value for the reference image function,g
is the mean value for the target image function, andN
is the total number of pixels in the area of similarity.The squared correlation coefficient metric is improved compared to only using the correlation coefficient value. In general the squared correlation coefficient is providing a good similarity measure for a pixel-wise intensity values image data. However, it is still not robust against multi-modality images.
B. Image Comparison
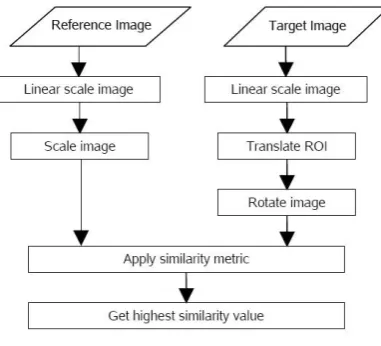
Image comparison is the main task involved in the implementation of the algorithm. In one comparison two images are acquired from the database. The general procedure of an image comparison is shown in Fig. 2.
The process of an image comparison starts with the two images being compared. These images are assigned for reference image and target image. In the real application, reference image is the image of the stolen item, while the target image is an image selected from the images gathered from the internet based on the given description of the reference image. For this work, the reference image is also selected from the image database and the other images in the database compared to it are assigned as the target images.
Fig. 2 General procedure of an image comparison
The elements required for an image comparison are the construction of image database for testing the algorithm, the variations of transformation for image comparison process, and the area of similarity to indicate the region of which the intensity values are used for measuring similarity.
1) Construction of image database
The construction of image database is using images that are taken from COIL-100 [6]. The database is also comprised of images from the internet and modified images using ImageJ [7] program. The factors considered in the construction of this database are; variations of transformation on the object image such as scaled size, translated position and rotated effect in two-dimensional plane, difference in size of image canvas, and change in illuminations or modality of the image.
Fig. 3 shows a screen shot of the self-constructed image database taken from its directory. Basically the database is built of similar object images in pairs. If only a pair of images is having similar object from the whole database, the precision of the algorithm can be analyzed easily when one image is selected as the reference image. For one comparison, only two images are compared. The algorithm is built with the ability of not repeating the image comparison of the same images if the images interchanged position as the reference image or the target image. It also excluded the comparison of the reference image to itself. Therefore the image comparison for testing an algorithm comprised of 100 images in a database is 4950 comparisons.
Fig. 3 Screen shot of image database
The number of comparison is calculated as follows;
2 1 comparison
of
number n n (4)
where nis the number of total image in a database. 2) Variations of transformation
The variations of affine transformation are required in finding the most similar orientation of the object in the target image to the object in the reference image. The highest similarity can be obtained when both images present the most similar object orientation. The transformations include scaling the reference image, translating the ROI of the target image, and rotating the target image. Less variation in transformation is optimizing the algorithm performance.
The factors chose for all variations are based on logical thinking that the object in the target image represented may only vary by different size of about 70% to 110% of the reference image object, changed in location of the object within the 50% size of the reference image and the object may be inclined between 45° counter-clockwise to 45° clockwise. Particular variations are assigned in order to focus only on reasonable variations that affect the object image. Scaling and rotation influence the changing of the image, while translation only affects the ROI of the image.
3) Area of Similarity
The area of similarity is corresponding to the middle point of the images involved in the image comparison respectively. This area is initialized by the ROI of the reference image and mapped onto the target image. The ROI of the reference image is indicated by the whole area of the reference image, while the ROI of the target image is implied by the same size of the reference image area. With affine transformation, the ROI of both images are affected and this corresponds to the changes of the area of similarity.
IV. SOFTWARE IMPLEMENTATION
The development of this work is based on the Java-based image processing software, ImageJ. User can extend the ImageJ ability with plugins and macros for special acquisition, analysis and processing tools using ImageJ’s built in editor and Java Compiler.
[image:3.595.47.293.615.741.2]the ImageProcessor’s pixel array. Therefore any modification on an image affects the ImageProcessor immediately. Another class used is ImageConverter, a class that contains methods for converting image type.
ImageJ also supports the function for working on only a specified region of an image rather than on the whole image, which can be specified as the ROI. In this work, the ROI is relative to the area of similarity in this work where the image datasets are computed for the highest similarity measure.
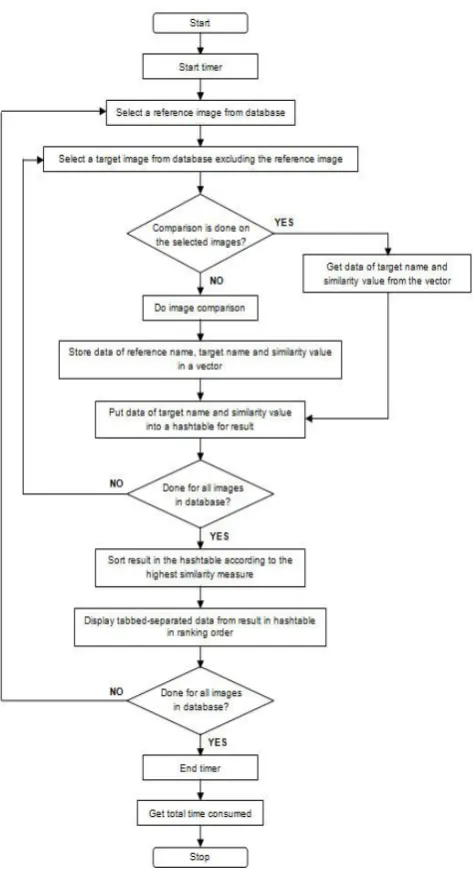
[image:4.595.51.288.326.762.2]In Fig. 4, the workflow of an object recognition algorithm is presented. The Vector class and Hashtable class are used for managing image data of the reference image name, the target image name and the highest similarity value of the image comparison. The Vector is used for storing data after an image comparison is done and the data can be accessed to check if a particular comparison is already done or not by accessing the integer index of the stored data. The Hashtable can provide for sorting order of the keys which is required for the algorithm implementation for sorting the similarity values. By using a hashtable, the sorting of the similarity values will also sort the target image names relative to those values.
Fig. 4 Workflow of the object recognition algorithm
Before the image comparison proceeds for any two images, the names of the images are compared to the data in the vector if the comparison is already done on those images. If the comparison is done, the data in the vector corresponding to the images to be compared are retrieved. The data are then inserted into the hashtable. In this way, the same image comparison is not repeated and the time consumed for the whole testing is also reduced. If not done, the process continues with the image comparison, storing the data of the comparison into the vector and the same data are inserted into the hashtable. The data inserted into the hashtable are sorted in descending order.
After all target images are matched to the reference image, a result displaying tabbed-separated data of the image comparisons involved for the whole test is produced. The same processes continue for all other images in the image database. Finally, a long list of tabbed-separated data of image comparisons for the particular test is produced in ranking order. For the purpose of easy handling and analysis on the data, the output of the algorithm’s test is also generated in a text file format.
V. RESULTS AND DISCUSSION
The object recognition algorithm is implemented by utilizing all positions within the 50% size of the reference image that corresponds to the area of similarity. The variations of translation is varied at all x and y directions, which are possible within the area of similarity. The algorithm is tested on 100 images from the self-constructed image database. Some of the images included in this database are as shown in Fig. 3.
[image:4.595.307.545.498.754.2]The results of the test are produced in tabbed-separated data collected from all image comparisons where it is started with the name of algorithm type.
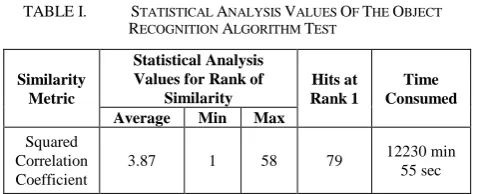
TABLE I. STATISTICAL ANALYSIS VALUES OF THE OBJECT
RECOGNITION ALGORITHM TEST
Similarity Metric
Statistical Analysis Values for Rank of
Similarity
Hits at Rank 1
Time Consumed
Average Min Max
Squared Correlation Coefficient
3.87 1 58 79 12230 min 55 sec
For every loop of test the number of loop test and the reference name precede the list of tabbed-separated data. The data in tabbed-separated list are the rank numbers, the similarity values and the target image names arranged in sorted descending order since the highest similarity measured is maximizing for squared correlation coefficient metric.
Fig. 5 shows some parts of the results. This is the sample of output data produced after the test is done for 100 images. At the end of the test, the data are analyzed to find how successful the algorithm to get the most similar image.
Statistical analysis of the results are presented in Table 1. It is shown that the total similar images found correctly are 79 indicated by the hit of Rank 1. The correctness can be confirmed since the implementation of the image database already considered on the groundtruth of the similar images, where only a pair of similar object image exist in the database and the images are given with distinguishable name. However, there are also other ranks analyzed by the algorithm that goes until Rank 58, which shows that this algorithm requires further improvement in order for the algorithm to achieve the highest similarity value at Rank 1. Furthermore, the time taken for this testing of 100 images in a database is very long that is 12230 min 55 sec, which is more than 8 days. Since the problem involved for this work comes from various types of images that may include multimodality images, this algorithm is not the most sufficient algorithm implemented in dealing the problem. As stated in [8] mutual information and its variant, normalized mutual information are more useful for measuring similarity of multimodality images, while cross correlation and mean-square difference are commonly used for single modality images. Nevertheless, the squared correlation coefficient metric is improved from just using the correlation coefficient value.
There is no external software required to run this algorithm and the framework is highly extendable for new similarity metric to be developed as the object recognition algorithm. The results produced are relative to the self-constructed image database, which means that the risk of handling the real situation of the problems are not yet tested. For future work, the software implementation can be enhanced for different similarity metric in achieving better result, focusing on every two images comparison and provide for easy handling when any number of images are required for a comparison, and the image comparison task of the algorithms can be assigned as a job for grid computing system where the exhaustive measurements due to high time consumption and a large number of variations for transformations can be reduced.
REFERENCES [1] eBay. http://www.ebay.com/.
[2] B. Körtner. Der “Stolen Goods Internet Detector” und sein Bildvergleich fur die digitale Forensik. Student work, Universität Karlsruhe, Germany, 2005.
[3] M. Sutter, R. Stotzka, T. Jejkal, M. Holzapfel, and H. Gemmeke. Inspector Computer, German e-Science Conference 2007, 2007. [4] R. Owens, Object Recognition, 1997.
http://homepages.inf.ed.ac.uk/rbf/CVonline/LOCAL_COPIES/OWE NS/LECT13/node5.html.
[5] L. Ng Insightful Corp. Overview: ITK Registration Methods. [6] S. A. Nene, S. K. Nayar and H. Murase. Columbia Object Image
Library: COIL-100. Technical Report CUCS-006-96, Department of Computer Science, Columbia University, February 1996.