Abstract—Using the Department of National Defence (DND) /
Canadian Forces Architecture Framework (DNDAF), operational sub-views have been developed for the four operational level command headquarters and significant portions of the Chief of Defence Intelligence (CDI) organization. Sample sub-views are presented to explain architectural challenges and lessons learned. An automation flow to assist in the development of these sub-views is described.
Index Terms—Enterprise architecture, DNDAF, DODAF,
DND, Canadian Forces, Department of National Defence.
I. INTRODUCTION
Enterprise architecture (EA) is the discipline of modelling an organization’s business, technology, and infrastructure in order to align the use of technology with business, and to enable synchronized planning in the two domains [1][2]. Models typically describe an organization As-Is, To-Be, and at intermediate stages.
Defence architecture frameworks (DAFs) are EA frameworks for aligning technology utilization with military missions and operations (ops). Canada’s nascent DNDAF [3] is similar to DAFs developed by the United States, the United Kingdom, and Australia. DNDAF’s suites of products (tables, schematics, graphs, and documents) represent various aspects of an organization, mission, or system of interest. The suites are referred to as views, and the products in them are referred to as sub-views. Two main views are the Operational View (OV) and the System View (SV). The OV describes operation level tasks, activities, business processes, and information exchanges. Hence, it typically defines operational requirements, while the SV describes the systems providing for, or supporting, the functions in the OV. Operational architecture (OA) is considered a function of a project’s requirements definition team [dubbed project director team, (PD tm)], which liaises with stakeholders to ensure that their requirements are met in the implementation of a project. In contrast, the SV is for system architecture (SA), which is the function of the implementation team.
OV sub-views (referred to as OVs) were used to model selected CF organizations in order to define the high-level requirements for a new operational command building (OCB). The PD tm is part of the Directorate of Integrated Command and Control Requirements (DICCR). Much of the stakeholding community consists of the future occupants: (1) Manuscript (DRDC CORA SL 2010-116) received Wed 30 June 2010. This work was done by Canada’s DND. F. Ma is with the Defence Research and Development Canada – Centre for Operational Research and Analysis (DRDC CORA), Ottawa, ON, K1A 0K2, Canada (phone: 613-992-4550; fax: 613-992-5230; e-mail: Fred.Ma@ forces.gc.ca).
Canada Command (Canada COM), (2) Canadian Expeditionary Force Command (CEFCOM), (3) Canadian Special Operations Forces Command (CANSOFCOM), (4) Canadian Operational Support Command (CANOSCOM), and (5) significant portions of the CDI organization [hereafter, Defence Intelligence (DI), to distinguish it from the position CDI]. These will be collectively referred to as Operational Organizations (OOs). The OVs for these OOs were developed to various degrees of completion [4].
This paper examines the mechanics in developing some of these OVs (below), and some of the challenges encountered. An automation-amenable OA workflow to deal with these challenges is described, as are practices that were found to be helpful. The focus of this paper is sub-views OV-4a (Organizational Relationships Chart), OV-2 (Operational Node Connectivity Description), and OV-3 (Operational Information Exchange Matrix). Sample OVs are pictorially presented, with textual details that typically accompany them omitted.
The OVs are snapshots only, used to illustrate the OA methodology. In reality, the OOs are never static, and the OA is (ideally) live. As well, much can be written to explain the acronyms and organizational terms without adding value to the study of the methodology; except where indicated, therefore, the terms should be regarded as generic labels that can represent different organizational elements, depending on the OO.
II. SAMPLE OVS
The OVs are presented in the order of their construction, from least demanding to most demanding in terms of gathering data from operational personnel. It was necessary for the PD tm to start with the simplest because the understaffed OOs would not be able to justify a large commitment of staff time without some examples of OVs from smaller efforts. However, the sequence of workshops to gather data for the OVs was pursued with each OO in a staggered manner; at any one time, data for different OVs were being sought from different OOs. Workshops were followed by a long tail of communication for clarification and elaboration. Many of the decisions of how to represent real world concepts (RWCs) (organizational elements, facilities, etc.) in the OVs resulted from considering the operational experience within the PD tm, stakeholder consultation, and tractability in OV manipulation.
Fig. 1 is an OV-4a for CEFCOM, based primarily on its organizational (org) structure. It “plugs in” to the overall DND org chart via its top level element [Chief of Defence Staff (CDS)]. The leaf nodes can be decomposed further, but
Automation Flow for Defence Architecture
Operational Sub-Views of Canadian Forces
Operational Commands
the depth shown was considered most efficient for OO engagement for the OCB OA. With exceptions where appropriate, the final leaf node granularity was that of the functions in the general/continental staff system [5] (the “J’s” in Fig. 1, hereafter referred to as J-branches).
[image:2.595.307.549.113.233.2]An OV-4a shows relationships that are relevant to a project’s purpose, which are not necessarily reporting relationships (e.g. the example working group (WG) in Fig. 1). For the OOs, such regular people groupings (PGs) include those involving visitors from offsite, those involving only internal personnel, and those related to planning and responding to contingent situations (conferences, ceremonies, meetings, site visits, etc.). Using lines to connect the PGs to the relevant org chart elements (as per the example WG) would obscure the OV-4a; hence, it is implied that the elements from which PGs draw personnel are determined by the relevant procedural and directional documents. The PGs themselves are shown as stacks of elements along the right in Fig. 1. EXAMPLE WORKING GROUP Operations (Ops) Support (Sp)
Fig. 1. Sample OV-4a, CEFCOM As-Is (example only – fine print not meant to be discernible).
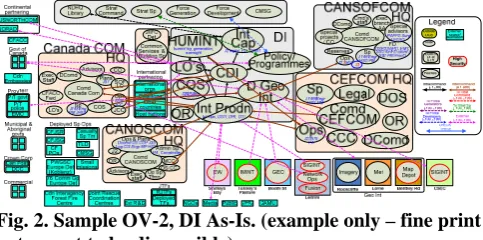
Fig. 2 is an OV-2 for DI, which shows: (1) the main actors as nodes; and (2) needlines representing the need for products by some actors from other actors. Actors include: (1) the OOs (peach colour) and their constituent elements; (2) the mostly strategic level elements along the top (grey); and (3) the deployed, government, industry, and international elements [cyan (blue/green)]. The multicoloured DI elements along the lower right highlight the disparate locations of DI elements, which was one of the reasons for the OCB project. For the OCB OA, a needline indicates the existence of information exchange requirements (IERs) between source and destination nodes; the actual path of delivery can be circuitous. Fig. 2 is only a subset of the full OV-2 with all captured needlines. The full OV-2 was unintelligibly dense; it was used as a “database” of needlines, from which an OO-specific subset was extracted for OO engagement. The extraction was done with a combination of interactive scripts in the drawing tool and manual cleanup.
A major question for the OV-2 was what RWCs should be represented by a node. After some iterations, the default scheme was to have nodes corresponding to the portions of an OO headed by the first level subordinates under the Commander (Comd) in the org chart [e.g. Chief of Staff
(COS) for Ops]. These are the grey ovals in each OO in Fig. 2. Exceptions were made as required for clarity, and to reflect stakeholder perspectives i.e. some of the nodes are finer-grain.
Fig. 2. Sample OV-2, DI As-Is. (example only – fine print not meant to be discernible).
There are typically several different IERs between the nodes connected by a needline. Each IER needs to be tabulated as a line item in the OV-3, along with its attributes, as per the column headings in Fig. 3. Fig. 3 is a customization of a strawman OV-3 that DNDAF borrowed from the DoDAF [6] at the time that the OCB OA was undertaken. Red X’s mark fields that were deemed unnecessary for OCB OA at the time. Green +’s mark fields that were augmented by new fields for additional sender/recipient (SR) details that were found to be necessary, as will be discussed in the following sections. Orange ?’s mark fields for which a brief search was conducted for specification standards that were tentatively adopted. Some security fields were reorganized to reflect DND specifications.
OV-2 needlines can be generated from OV-3 IERs. Depending on the tools used and the details captured, even the OV-3 IERs can be extracted from the information flows of the more elaborate Operational Process Model (OV-5b, also of interest in the OCB project but not a focus here). In keeping with the need to show value with smaller efforts first, it was decided that OV-2 needlines would be captured first, and they would be used as a framework with which to elicit information about all IERs that can be associated with each needline (hereafter referred to as IERs travelling along a needline).
The OV-3 effort has been taken over by a peer project. As will be discussed, however, skeletal OV-3 data are still needed to maintain the OV-2 in the face of constantly changing information about the OOs, and even before OV-3 data gathering begins in earnest.
Information Element
Description Producer Consumer
Ne ed li n e Ident ifi er In fo rm at io n E x ch an ge Id en ti fie r In form at ion E lement Nam e a nd I d entif ier Co n te n t Sco p e A ccu ra cy La n g uag e Sendi n g Op N o de Na m e and Id en ti fi er Sendi n g Op Ac tiv it y N a m e a nd I d entif ier R ecei v ing O p N o de Na m e and Id en ti fi er R ecei v ing O p Ac tiv it y N a m e a nd I d entif ier Nature of
Transaction Performance Attributes Information Assurance Security
Miss io n / Scena ri o U J TL o r ME TL Tr a n sac tio n Ty pe Tr ig ge ri n g Ev en t In te ro pe ra bi li ty L eve l Re qui red C rit ic a lit y P erio d ic it y Ti m elin es s Acce ss Cont ro l Avai la bility Confi d ential ity Dissemi n a ti o n Contr o l In te gr it y A cc o u n tab il it y P rotec ti on (T yp e Nam e, Dur a tion, Date) Cla ss ifi ca ti on Cla ss ifi ca ti on Ca ve at
8 8 + +
+ media ? ? 8
[image:2.595.56.282.293.464.2]8 88 88 88 88
[image:2.595.306.548.633.783.2]III. OA CHALLENGES AND PRACTICES
OVs can be business-centric to varying degrees. A strong business view (Operational View for DAFs), apart from the enabling technology, ensures that technology is driven by business aims and not constrained unnecessarily by As-Is technology solutions (e.g. [1][2]). Unlike the RWCs modelled by EA in general, DICCR projects are strongly technological. Hence, it is not necessarily a liability for their OA to be couched in terms that lean toward information technology/management, infrastructure, and equipment. The OCB OA scope is an exception in that, beyond driving SA, it is meant to drive or inform: (1) requirements for physical infrastructure, (2) floorplanning as driven by workflow and communications, (3) security, (4) operational processes, and (5) how actual practice affects doctrine and training. Hence, OCB’s OA was neither system-centric nor doctrine-centric; where doctrine could feed OA, it was used for strawman OVs (a strawman is an early concept of something for brainstorming and development). The OA was driven by operational practice, as determined from the workshops and communications with stakeholders.
A major challenge with such a broad OA scope (which was not centered on equipment) was the ambiguous and conflicting understandings of the OOs’ ops by their personnel, and the consensus building needed. Much modification of the architecture was needed for convergence. Amplifying this challenge was the lack of suitable automation/tools, and the fact the requirements team was iteratively seeking the most efficient architectural representation with which to engage the understaffed OOs. A final contributor to the need for constant modification was the fact that several of the OOs were undergoing protracted transformation (i.e. not only were the OOs changing, but the understanding of them by their personnel was that much more ambiguous).
A. Changing OV-2 Node Composition and Granularity One of the biggest OA challenges arising from the circumstances above was the constant need to change OV-2 node definitions. This can be illustrated by reviewing the evolution of these definitions. An early scheme was to have one node per J-branch. The motive was for the communication pattern to inform floorplanning. At that level of detail, however, the OV-2 became unintelligibly complex. It was simplified by combining J-branches [e.g. J3 (ops), J5 (plans), and J7 (training) became a J357 node, since their activities are highly coordinated]. Keeping the SRs of the OV-3 IERs synchronized with the OV-2 node definitions was very laborious despite advanced search and filtering capabilities in the drawing and spreadsheet applications (apps).
The challenge becomes more complex when changes in node composition are not as simple as mere aggregation. For example, the OV-2 needed further simplification; a scheme was needed to determine comparable node granularities across the OOs. Each OO’s org chart was adopted as a guide, and the nodes were taken to be the Comd and the parts of the OO headed by his first level subordinates, with exceptions as needed [e.g. for CEFCOM (Fig. 1): (1) DOS, (2) DComd, (3) (COS)Ops, (4) (COS)Sp, etc.]. Let this scheme be called
L1st. The problem with this change in node definition was that J3, J5, and J7 do not fall under the same COS in other OOs. (The bookkeeping challenge depends on how the change is implemented. Each J-branch can be migrated out of J357 and into the appropriate L1st node. Alternatively, aggregate nodes like J357 had to be decomposed into J-branch nodes and re-aggregated into L1st nodes.) Apart from the manual intensity and susceptibility to error of the change, the difficulty was that fine-grain SR information at the J-branch level was either lost when J357 was formed, or was never obtained for the needlines captured after J357 was formed. An early “solution” to this was to err on the side of caution against understating requirements: each needline contacting J357 was assumed to contact each of J3, J5, and J7 after decomposition. This yielded redundant needlines that needed to be culled away via stakeholder consultation. This approach should be avoided where possible because: (1) it turns known parts of the OV-2 into speculative parts; (2) the redundant needlines aggravate the problem of complexity in the OV-2 graph; and (3) for vetting purposes (and in general), stakeholder involvement is difficult to obtain due to operational priorities and understaffing. Stakeholder engagement was also one of the main challenges in developing the OCB OA.
B. High Level IERs and Fine-Grain SRs
Bookkeeping challenges like those above highlighted the need to maintain skeletal OV-3 data about needlines even before OV-3 data collection. During stakeholder engagement, for example, when a needline is identified on the OV-2, the stakeholder(s) can also be asked for IER-like attributes such as a description of the purpose for the needline, and regardless of the OV-2 node granularity, the finest-grain SR identities that can be practically provided for the IER(s) they had in mind. In the OV-3, this data forms a high level IER (HLIER) (possibly one of several) associated with the needline. An HLIER serves several purposes: (1) it acts as a cue for later elicitation of actual IERs falling under the needline’s described purpose; (2) it provides fine-grain SR identities so that needlines can be properly modified when a node is decomposed, and when constituent elements are migrated between nodes; (3) when the detailed SR is not present, the description of the needline’s purpose informs the judgement call on how the needline is affected by node composition changes; and (4) the HLIER could be accepted as an IER at some point (which means that more of the IER attributes need to be captured).
are modified.
How finely should SRs be specified? One might expect that one level finer than the granularity of OV-2 nodes should suffice, since the needlines are impacted by moving constituent elements between nodes. A number of factors complicate such a simple prescription: (1) the notion of levels of granularity can be fuzzy unless an aggregation tree has been established, and as mentioned, an org chart does not suit the purposes of all projects; (2) with successive stakeholder engagements, the node granularity can change as the PD tm iteratively converges on the most effective granularity; (3) the elements migrated between nodes might be several levels finer than the nodes; (4) different stakeholders work at different levels, and may need to see the OV-2 at different granularities (5) detailed information might not be readily available during discussions at the OV-2 level. This is why the aim became to get the finest-grain SRs that were practical. Ideally, this would be at least one level finer than the node granularity at the time.
C. Other Helpful Practices
The following are additional practices that were found to be helpful in engaging stakeholders.
1.To ensure their later validation with stakeholders, speculative needlines and IERs should be tracked (e.g. by an attribute in the OV-3 and/or by a summary list). This applies to speculative needlines from strawman development, and from assumptions that have to be made about how a needline splits up and/or replicates when a node that it contacts is de-aggregated and/or when elements migrate between nodes. The OVs can quickly become too dense for stakeholders to methodically go through all the details during validation. Flagging the speculative needlines ensures that they are brought up for validation.
2.Despite its conceptual simplicity, strawmen were found to be critical to the stakeholder engagement process. Conversely, starting from a blank slate ensures zero momentum and lack of engagement.
3.A common colour scheme should be maintained to the extent possible. Stakeholder time and good will are scarce and precious resources; time spent explaining that a colour scheme distinguishing certain things in one sub-view does not play the same role in another sub-view should be minimized. Being aware of such an inconsistency does not necessarily reduce the added burden on sense-making. The architect may also have to convince the PD tm to use colours sparingly. Colours seem to be an easy solution to convey meaning, colourful graphics are enticing, and it may not be obvious from one sub-view that many colours are used. Unfortunately, more colours means less distinguishability and more effort finding a distinguishable set. Distinguishability needs to be maximized because it will be reduced when visiting stakeholder sites, depending on the condition of the media on which the OVs are rendered.
IV. AUTOMATION SUPPORTABLE OA FLOW
Systematizing the bookkeeping provides a procedure to avoid losing information, and to maintain consistency of data between sub-views. However, simple compositional changes
such as node de-aggregation or migration of elements between nodes can easily lead to pages of edits and checks between the OVs, depending on: (1) the complexity of the OV-2 graph, (2) the mapping of IER SRs to possibly coarser-grain OV-2 nodes, and (3) the number of IERs travelling on each needline. Together with the constant change in OV-2 node composition and granularity, this highlighted the need for automation that supported the notion of dynamic hierarchical composition of nodes. This need is amplified by the need to maintain As-Is and To-Be architectures, and the fact that both are likely to undergo constant change as the organization and its goals change. The architecture tools used within DRDC CORA were unsatisfactory for such a task, and consultation with DND’s Directorate of EA indicated all the sought functionality may be difficult to satisfy with existing commercial tools.
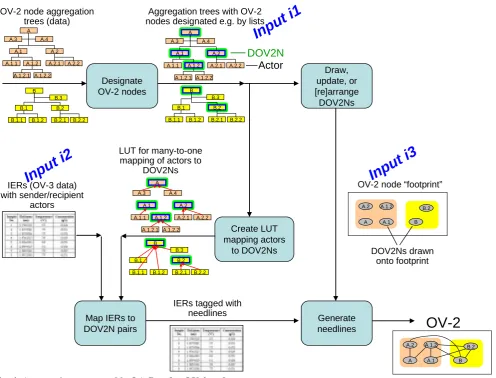
Based on the challenges and practices partly described above, the automation-supportable OA flow of Fig. 4 was devised. This flow has three main inputs, supplied by the architect, driving the creation of the OV-2: (i1) A description of what actors subsume what other actors (upper left), either in the form of lookup tables (LUTs) or a forest of trees (e.g. one tree per OO), and a designation of which actors form OV-2 nodes (top); (i2) OV-3 IERs with SRs corresponding to actors in the trees of i1; and (i3) an arrangement of OV-2 nodes [i.e. a footprint (Fig. 4, right side)] mostly consisting of designated actors in i1, to be augmented with needlines implied by i2. Most org chart apps readily export parent-child data, so the front end for i1 can be graphical or textual data.
A. Walkthrough of the OA Flow
This subsection describes the technical details of OA flow in Fig. 4. The trees of i1 indicate the allowable aggregations to form OV-2 nodes, but the actual OV-2 nodes have to be selected from the trees (i.e. each node in the trees is a potential OV-2 node). For clarity, the tree nodes will be referred to as actors (they perform operations, but might not show up as explicit nodes in the OV-2), while designated OV-2 nodes will be referred to as DOV2Ns. In Fig. 4, some DOV2Ns in i1 are within subtrees rooted by other DOV2Ns. This indicates that despite the conceptual subsumption, it is better to show the subordinate DOV2N separately. For example, the CCC leaf node (Fig. 1) was broken out as a separate OV-2 node (Fig. 2, one of the gray ovals in CEFCOM) because it was a major hub of activity and interaction with other actors. Since DOV2Ns are shown separately, one might want to break up an OV-2 node tree so that the every DOV2N is the root of its own tree. However, this discards subsumption information, and the resulting forest would only be valid for a specific set of OV-2 node designations. The entire tree should be maintained so that the user can quickly change OV-2 node designations. For the OCB OA, the trees consisted of the OOs’ org charts and a live forest of trees for actors outside of the OOs.
identified for deletion. Automating the footprint [re]generation requires a drawing app which has a coding interface with which to programmatically manipulate drawing content and access/export/import data (such as Microsoft® Visio®). The [re]generation process should by default leave alone OV-2 nodes already existing in the drawing, as their look-and-feel and their positions may have resulted from extensive and hard-to-get consultation. They are cosmetic from a data structures perspective, but the OA is meant as a communication and consensus tool. Stakeholders must recognize what was discussed, and they must do this with minimal overhead time for explanation. Otherwise, much groundwork in client engagement is lost. Not only may there be no opportunity to recover that groundwork, but buy-in from stakeholders for further engagement may be diminished.
Along the bottom of Fig. 4, needlines (i.e. pairs of DOV2Ns) are generated from IERs by mapping each IER’s SR pair to a pair of DOV2Ns. Since SRs are simply actors residing in subtrees rooted by DOV2Ns, it is straightforward to build a LUT to map SRs to DOV2Ns (Fig. 4, centre). Automation temporarily breaks each OV-2 node tree into a set of smaller trees rooted by DOV2Ns. A LUT is then created to map each actor to the DOV2N at the root of its tree. This LUT is then used to map each IER SR pair to a DOV2N pair (i.e. a needline). Repeated needlines are removed, and the remaining unique needlines are drawn onto the footprint to form the OV-2.
B. OA Flow Implications
None of the functionality within the flow is algorithmically complex or vendor-specific. Automation support to OA seems to be a question of how best to bring established automation methods to bear on the points of intractability, as found from OA practice, which are sure to change with time, experience, and development of automation support itself. The described OA flow acts as a flexible framework for development and exploration of automated support. As a framework for adaptively tackling tractability, the points of control of the data in the flow that are left to the user (and the automation developer) are important. Implementation details also impact on tractability; the ways in which the user can guide and configure the automated functionality should help rather than hinder.
In this flow, not only can the OV-2 node designations change as often as needed (e.g. to show different granularity), but so can the tree structures themselves, making compositional changes like that from J357 to the COSs seem trivial. Such features would have been used in the OCB OA for further changes in OV-2 representation, as experience accumulated. If OV-2 nodes are designated by a list of actors, separate from the trees, then only those nodes affected by tree changes need user attention. For example, decisions might be needed on whether new actors should be designated in the list. Conversely, nodes that cease to exist can be left in the list in case they come into existence later, but they should be reported to the user in case he/she wants to remove them. If input i1 is obtained from the user graphically, and if the graphical tool allows, DOV2Ns can be specified directly on the tree (e.g. through some graphical marking of actors or
through a data field associated with the actor elements). The physical placement of DOV2Ns in the OV-2 affects the needline pattern and stakeholder perception. In OV-2 revisions, the placement of new nodes on the footprint can be determined through the adaption of any number of algorithms for intuitive graph visualization. The logic should be simple, since it only generates default locations, with the final positioning done by the architect, keeping their implications in mind. Configuration switches can also determine whether, as an alternative, new nodes are highlighted and collected in one spot to simplify manual placement. The footprint [re]generation phase might also accept an attribute for each node that determines how it is placed (e.g. by absolute coordinates; by inheriting from the existing footprint; algorithmically placed; or collected for manual placement). How best to specify such designations has yet to be explored [e.g. as a custom attribute of each node in the drawing app (if supported) or as an external list]. There may be many nodes, but the list doesn’t have to be long if the automation allows the user to define a default.
For a brand new OV-2, an initial footprint will likely be drawn up completely manually, since there might not be enough [HL]IERs (and hence, needlines) for graph visualization algorithms to create a sensible layout. As well, the architect will likely have his/her own general idea of a good initial footprint anyway. In successive iterations of the flow, the OV-2 and the footprint can be the same file, since the needline generation phase can simply erase existing needlines. This way, the OV-2 can retain any node rearrangements made in exploring their visual effect on the needline pattern (this assumes a drawing app that satisfactorily updates drawn needlines as nodes are rearranged). In such an implementation, the OV-2 is both an input and an output in the flow. Obviously, a version management scheme would be needed.
Other points of control in the flow include switches to determine the portrayal of directionality in the needlines. Querying and filtering can also be applied to the IERs, nodes, and needlines (based on any of their attributes) in order to generate the subsets of the OV-2 that are of concern to specific stakeholders. The IERs can be maintained in a tabular data app such as Microsoft® Excel®, Matlab®, or a database app (the OV-3 database is being developed in the Microsoft® Office environment). The query/filter phase can also generate flags for the needline generation phase to drive how/whether different needlines are depicted for different (flexibly defined) categories of communications (e.g. security, network, criticality, timeliness requirements, etc.).
C. The Flow in Perspective
exactly the same as a DAF view), while the filtering, footprint, and placement parameters correspond to his viewpoint concept (i.e. how data are selected and converted into a particular view). The OV-2 node trees can be considered both fundamental architectural data as well as viewpoint data for steering the generation of the OV-2 from the IERs. For exmaple, if a single forest of trees represents how most of the stakeholders see the subsumption of concepts within the OA scope, the forest is architecturally fundamental; if different forests of trees are maintained in order to generate OV-2s that are meaningful to different stakeholders, the forests reflect different viewpoints.
With the required automation, the OA flow generates OV-2 with minimal user involvement when either the fundamental data or the viewpoint parameters change. Some of the viewpoint data, such as the existing iconography and node positions, are embedded in the view itself (the OV-2 and/or footprint, which may be one and the same); hence, the line between view and viewpoint is fuzzy.
In terms of standardizing data, DNDAF has developed a set of data collection templates (DCTs) that reflect (in a simplified manner) the data model for storing architectural content in a repository. They take the form of spreadsheets of predefined tables into which line items are entered for the elements in the sub-views (nodes, needlines, IERs, etc.), with predefined columns of attributes for each line item. The tables also capture relationships between elements of different types, within the same sub-view and between sub-views [e.g. between needlines and IERs; IERs and the nodes containing the SRs; nodes and the activities (from OV-5) performed by their actors, etc.]. The structure that is imposed is still very generic (e.g. architects for different projects may describe similar communications using differently defined sets of IERs). The very fact that the OV-2 node tree (and hence the actors) can change exemplifies the arbitrarity with which OA elements map to RWCs. Sometimes, different architectural “vocabularies” result from lack of standards rather than out of necessity. In DNDAF, a reference model (RM) defines the allowable RWCs that can be represented by sub-view elements and relationships, and the allowable values for the attributes of these elements/relationships. DND is undertaking to develop taxonomy-based ontologies which can provide some standardization of what can go into various RMs for the various purposes of architecture, and which can ease the mapping between RMs (or parts of RMs).
V. CONCLUSION AND FUTURE WORK
This paper presented lessons from developing DNDAF OV-2,3,4a for the CF Operational Commands and Defence Intelligence in order to guide the definition of high level requirements for an operational command building. Tractability challenges arose from the dynamic nature of the information for this model, which is neither technology-centric nor doctrine-centric, the extensive bookkeeping of OV data, limits to stakeholder engagement in the face of operational priorities, and extensive OV customizations to maximize efficiency in engaging different stakeholders. Lessons learned include a prescription of what data are needed to manage changes in OV-2 node
composition, the importance of strawmen and tracking speculative needlines, and the sparing use of colour. To deal with tractability and OV customization for specific stakeholders, the described OA flow provides a highly flexible framework for exploring automation support.
Aside from implementation of various parts of the flow, several directions of future work are possible. The flow was based on work that was guided by early examples of DNDAF OVs, prior to the DCTs. To ensure compatibility with a future DNDAF repository, mappings need to be defined between the data in the flow and the DCTs. Mappings to other sub-views (e.g. in the OV and SV) are also needed. Another direction is the nascent OV-5b effort for the OCB, which graphically depicts the operational processes within the OOs. The pictures themselves can reveal inconsistencies that are easy to miss in textually described procedures; with commensurate modelling effort, simulations of the processes can be run at varying fidelities for varying levels of confidence in their viability and effectiveness. Yet another work area is the ontology development, which mutually informs the development of a library of DNDAF RMs. Finally, ontologies and RMs can be exploited in text/data mining and knowledge discovery in order to generate architecture that is less strawman in nature, thus imposing less on operational personnel to reach validated architecture.
ACKNOWLEDGMENT
The author thanks Debbie Blakeney, Ian Chapman, and Melanie Bernier for their internal review, and external reviewers for their external review.
REFERENCES
[1] M. Lankhorst et al, Enterprise Architecture at Work: Modelling Communication and Analysis. Dordrecht: Springer, 2009.
[2] J.W.Ross, P.Weill, D.C.Robertson, Enterprise Architecture as Strategy: Creating a Foundation for Business Execution. Boston: Harvard Business School Press, 2006.
[3] DND/CF Architecture Framework Version 1.7. Ottawa, Department of National Defence, 2010.
[4] F. Ma, “Lessons in Operational Architecture for Canadian Forces Operational Organizations”, May 2010 [MITACS/CORS 2010 Annual Conf.].
[5] Canadian Forces Operations (B-GJ-005-300/FP-000 “Change 2”). Department of National Defence, 2005.
Fig. 4. Automation-supportable OA flow for OV-2 nodes with dynamic aggregation trees.
B
B.1 B.2 B.1.1 B.1.2 B.2.1 B.2.2
B.3 A
A.1 A.2 A.1.1 A.1.2 A.2.1 A.2.2
A.1.2.1 A.1.2.2 A.4 A.3
Designate OV-2 nodes
Create LUT mapping actors
to DOV2Ns A
A.1 A.2 A.1.1 A.1.2 A.2.1 A.2.2
A.1.2.1 A.1.2.2 A.4 A.3
B
B.1 B.2 B.1.1 B.1.2 B.2.1 B.2.2
B.3
Draw, update, or [re]arrange DOV2Ns
IERs (OV-3 data) with sender/recipient
actors
Map IERs to DOV2N pairs
IERs tagged with needlines
Generate
needlines
OV-2
OV-2 node aggregation trees (data)
Aggregation trees with OV-2 nodes designated e.g. by lists
OV-2 node “footprint” LUT for many-to-one
mapping of actors to DOV2Ns
A
A.1 A.2 A.1.1 A.1.2 A.2.1 A.2.2
A.1.2.1 A.1.2.2 A.4 A.3
B
B.2 B.1.1 B.1.2 B.2.1 B.2.2
B.3 B.1
A.1.2
A A.2
A.1 B B.2 A.1.2
A A.2
A.1 B B.2
Inpu
t i1
Input
i3
Input
i2
DOV2N