An Optimization Technique for the Full and
Efficient Removal of Copper from Wastewater
Babatope. A. Olufemi*, Ibrahim. O. Salami, and Adewale. S. Akinyanju
Abstract – The possibility of reducing copper ions (Cu2+) from a wastewater sample containing 0.1 kgm-3 or 100 parts per million (ppm) copper ions concentration to zero at 100% current efficiency was investigated in this work. Basic parameters and criteria needed to optimise the performance of any electrochemical cell were identified. Mathematical modelling of the copper electrodeposition process was carried out and the appropriate resulting relationships necessary to achieve zero copper concentration at 100% current efficiency were identified and optimised theoretically. Experimental verification of the theoretical mathematical optimisation procedure was carried out through the fabrication of electrochemical cells, parametric studies of relevant variables, operation of cells guided by the parametric studies and theoretically predicted optimum operating conditions to achieve zero concentration of copper at almost 100% current efficiency. A maximum current efficiency of 99.56% was obtained at zero final copper concentration and optimum current density of 41.05 Am-2. The study can enhance researchers to design optimum wastewater treatment cells of varying sizes and applications.
Key words: Concentration, Copper, Efficiency, Optimisation
I. INTRODUCTION
Electrochemical removal of copper ions from water through wastewater effluent and other contaminant sources is still undergoing various studies. Copper ingestion by humans at various levels adversely affects health. Individuals ingesting large doses of copper present with gastrointestinal bleeding, haematuria, intravascular haemolysis, methaemoglobinaemia, hepatocellular toxicity, acute renal failure and oliguria [1]. At lower doses, copper ions can cause symptoms typical of food poisoning (headache, nausea, vomiting, and diarrhoea).
Records from case studies of gastrointestinal illness induced by copper from contaminated water or beverages plus public health department have been reported with
Manuscript received March 12, 2010.
B. A. Olufemi is with the Chemical Engineering Department, University of Lagos, Akoka, Lagos, Nigeria. Phone: +2348023162183, email: [email protected]. (*Author for correspondence).
I. O. Salami is with the Chemical Engineering Department, University of Lagos, Akoka, Lagos, Nigeria. (e-mail: [email protected]).
A. S. Akinyanju is with the Chemical Engineering Department, University of Lagos, Akoka, Lagos, Nigeria. (e-mail: [email protected]).
acute onset of symptoms. Symptoms generally appear after 15 - 60 min of exposure; nausea and vomiting are more common than diarrhoea [2, 3, 4, 5, 6, 7]. Copper pollution is also harmful to animals and aquatic life.
In humans, based on various studies [7, 8, 9, 10, 11, 12, 13, 14], the guideline value of 2 mg/litre (0.002
kgm-3) is no longer provisional. Acceptable limit should
permit consumption of 2 or 3 litres of water per day, use of a nutritional supplement and copper from foods without exceeding the tolerable upper intake level of 10 mg/day [15] or eliciting an adverse gastrointestinal response.
Researchers with various techniques and
equipments have attempted removal of copper from solutions with varying degrees of achievements and improvements. Electrolytic processes, membrane processes and chemical precipitation methods are used for recovery of metals from wastewaters. Yijiu et al. [16] studied the treatment of copper-electroplating wastewater by chemical trapping and flocculation recently. The electrolytic process does not generate sludge (requiring disposal by landfill), and the recovered metals could also be reused or recycled [17]. To mention a few, various electrolytic cells designed for the removal of copper ions from wastewater solutions include cells with porous plate, packed bed, fluidized-bed electrodes, oblique rotating barrel electrode and an Inclined Cathode Electrochemical Cell (ICEC) recently [17, 18, 19, 20, 21]. By electrochemical kinetics of the process, copper ions in the solution are deposited on the cathode. The features of a good electrolytic cell are easy set-up, easy maintenance and good solution flow [22].
With an initial 100 ppm concentration of a
CuSO4-Na2SO4 wastewater, Al-Shammari et. al. [18]
obtained final copper concentrations within 0.7 - 2.6 ppm
(0.0007 – 0.0026 kgm-3) with current efficiencies of 0.20 -
0.53. The range obtained by the ICEC was 0.3 – 2.3 ppm
(0.0003 – 0.0023 kgm-3) with current efficiency range of
0.275 - 0.656 [21]. Chin [23] obtained efficiencies of 0.26 – 0.29 with a flow-by porous copper cathode, while Zhou and Chin [17] obtained current efficiency values of 0.29 – 0.39 with a flow-through packed bed cathode.
This work will utilize suitable optimization techniques to theoretically and practically optimize the fabrication and operation of suitable electrochemical cells with the possibility of totally removing copper from a
CuSO4-Na2SO4 wastewater at almost 100% current
efficiency.
II. RELEVANT ELECTROCHEMICAL OPTIMIZATION
CRITERIA AND PARAMETERS
To maximise the performance of any cell for a given reaction, three inter-connected basic parameters affecting process economics must be optimised [25, 26]. These include:
1. Electrical current efficiency 2. Cell voltage
3. Electrical current density
To optimise the foregoing parameters, emphasis must be placed on the following design criteria relating directly to the design of the cell hardware [25, 26)]:
1. Overall fluid distribution 2. Fluid distribution in a cell 3. Electricity utilisation
4. Electrode surface area to cell volume ratio 5. Critical component selection
6. Materials of construction 7. Assembly and maintenance 8. Operating conditions
For any cell bank operated in a continuous mode, the parallel flow arrangement is usually advantageous over the series flow arrangement. Uniform distribution of electrolyte within a cell is necessary to eliminate stagnant zones. For batch and continuous mode operation, poor fluid distribution in a cell causes concentration polarisation, side reactions, low current efficiency and high electrode overvoltages. Batch and continuous operations are related by the proper interpretation and usage of reaction time, space time and space velocity [27]. Effective usage of electricity can only be made possible by minimising ohmic and power losses. Depending on the cell geometry and design, the electrode surface area to cell volume ratio must be increased as much as possible. The electrode active surface area must be increased so as to allow effective contact with the electrolyte. Electrodes and cell components must have adequate electrical and thermal conductivity, good mechanical properties, corrosion resistance and low cost. Material properties, useful life, availability and cost are prime factors in selection of materials of construction. Cells should be easy to assemble and maintain. Most importantly, a practical combined usage of these parameters must be optimally determined for any electrochemical cell in a given process.
III. THEORETICAL OPTIMIZATION METHOD
The following important relationships hold for the first order copper electrodeposition reaction:
Cu2+ + 2e- = Cu(s) (1)
Equation (1) represents the electrodeposition reaction of copper on the cathode.
The first order kinetics of the copper ion concentration at a particular time is given as:
S C O
F
V
S
kt
C
C
ln
ln
(2)where CF is final concentration of copper ion after any
given electrolysis time t, CO is the initial copper
concentration, SC is the total active cathode surface area,
VS is volume of the electrolyte solution being treated and
k is the apparent first order reaction rate constant for copper electrodeposition at the cathode.
The percentage average current efficiency (av) is given
according to the Faraday’s law of electrolysis as:
It
W
M
F
AV
2
(3)and
W = VS(CO-CF) (4)
W is the mass of copper recovered, M is the atomic weight of copper, F is the Faraday’s constant, and I is the average current.
A good optimization technique has to take into consideration these basic equations as they relates to the copper electrodeposition process as well as their interference on one another and the set-out objectives.
The term (SC/VS) in (2) is the electrode surface
area to cell volume ratio (RSV) for the cathode area
controlling eletrodeposition reaction. This term had been recognised [25, 26] as one of the criteria that must be maximised for the performance of any cell for a given reaction. The approach adopted in this work is to
mathematically maximise the (SC/VS) ratio in (2) that will
give a CF value of zero, with corresponding optimal k and
t values.
For an initial copper concentration CO, and zero
CF value after an optimal time determined by optimising
(2), (3) and (4) can be rearranged to give:
O AV S
FC
IMt
V
2
Equation (5) was optimised for the value of VS
and I needed to have 100% current efficiency (AV) at the
optimal time determined by optimising (2).
By ensuring a higher cathode surface area than the anode surface area always, the reaction rate will be controlled by the cathode and the cathode current density
(iC) is given as:
C C
S
I
i
(6)The mathematical theoretical optimisation values obtained for the operational parameters (variables) in (2) to (5) was used to fabricate and operate suitable electrochemical cells with the capability of achieving zero
CF value at almost 100% current efficiency.
IV. EXPERIMENTAL OPTIMIZATION METHOD
Removal of copper from a solution initially
containing 100 ppm Cu2+ ions and 0.05M Na
2SO4 was
carried out in copper cathodes and graphite anodes electrochemical cells. The experimental set-up involved a d.c. power source, a voltmeter connected in parallel and an ammeter connected in series. All runs were carried out
at 28oC and the final copper concentration after each run
was determined by an Atomic Absorption Spectrophotometer (AAS).
Three stages were involved in the experimental technique. Firstly, effective cathode surface area to cell
volume ratios of 50, 60, 70, 75, and 80 m-1 were used to
fabricate and operate electrochemical cells to remove copper from the copper solution. Average values recorded for the total time of 90 minutes for each run was used. One litre of electrolyte was used per run. This stage was to establish the importance of some parameters in the optimisation procedure.
The second stage involved the fabrication and operation of electrochemical cells with effective cathode
surface areas to cell volume ratios from 100 to 180 m-1, to
achieve final copper concentration of zero. Total electrolysis time of 90 and 180 minutes were used so as to ensure good comparison with the possibility of complete removal of copper ions.
In the third stage, optimally determined values and parameters were used to fabricate and operate electrochemical cells so as to achieve zero final copper concentration at almost 100% current efficiency. Effective cathode surface areas to cell volume ratios of
200 to 550 m-1 were used. The outcome of stages one and
two served as a guide for stage three.
V. RESULTS
The experimental results obtained in the first stage were used to observe some important phenomena and interactions of important variables in the eletrodeposition process. Figures 1-6 were obtained at two far apart average voltages of 4.83 V and 2.82 V and widely different average currents of 1.72 A and 0.93 A. The voltages and currents were so chosen to have good parametric observations on the operational variables.
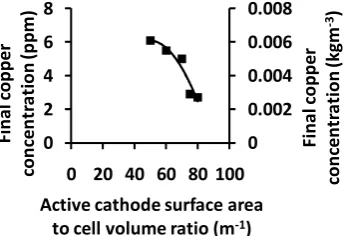
In Figures 1 and 2, the final concentration of
copper in ppm and kgm-3 as shown can be seen to
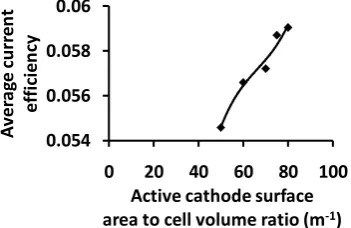
decrease as the active cathode surface area to cell volume ratio increases. This implies that maximising the active cathode surface area to cell volume ratio can enable the achievement of zero final copper concentration. Figures 3 and 4 clearly indicated that the average current efficiency also increased with the active cathode surface area to cell volume ratio. Maximising this ratio therefore implies maximising the average current efficiency. The fractional
conversion of Cu2+ ions to elemental copper at the
cathode, which is a fractional measure of the amount of copper recovered, increased as the active cathode surface area to cell volume ratio increased in Figures 5 and 6. It could be seen that operation at lower voltages and currents produced higher current efficiencies, but lower final copper concentrations and fractional conversions. This type of situation requires an optimal determination of parameters.
0 0.002 0.004 0.006 0.008
0 2 4 6 8
0 20 40 60 80 100
Fi
na
l
co
pp
er
co
nc
e
n
tr
atio
n
(kgm
‐
3)
Fi
n
al
cop
p
er
co
nc
entr
ati
on
(p
pm)
Active cathode surface area
[image:3.595.323.495.431.549.2]to cell volume ratio (m‐1)
0 0.002 0.004 0.006 0.008 0.01
0 2 4 6 8 10
0 20 40 60 80 100
Fi
na
l
co
pp
er
co
nc
e
n
tr
atio
n
(kgm
‐
3)
Fi
n
al
cop
p
er
co
nc
entr
ati
on
(p
pm)
Active cathode surface area
[image:4.595.57.233.95.228.2]to cell volume ratio (m‐1)
Figure 2: Dependence of final copper concentration on active cathode surface area to cell volume ratio at a mean voltage of 2.82 V and mean current of 0.93 A.
0.0304 0.0308 0.0312 0.0316 0.032
0 20 40 60 80 100
Av
e
ra
ge
curr
en
t
effi
cien
cy
Active cathode surface
[image:4.595.322.494.106.228.2]area to cell volume ratio (m‐1)
Figure 3: Dependence of average current efficiency on active cathode surface area to cell volume ratio at a mean voltage of 4.83 V and mean current of 1.72 A.
0.054 0.056 0.058 0.06
0 20 40 60 80 100
Av
e
ra
ge
curr
en
t
effi
ci
en
cy
Active cathode surface
area to cell volume ratio (m‐1)
Figure 4: Dependence of average current efficiency on active cathode surface area to cell volume ratio at a mean voltage of 2.82 V and mean current of 0.93 A.
The numerical optimisation of (2) and (5) which are non-linear equations were solved with the MPL for Windows 4.2 Optimization software, Maximal Software Inc, Copyright 1988 – 2007. The software utilised the Lipschitz-Continuous Global Optimizer (LGO) for the non linear optimization. According to Pinter [28], a practically important point to emphasize is that a specialized model structure is not assumed or exploited by LGO.
0.93 0.94 0.95 0.96 0.97 0.98
0 20 40 60 80 100
Fr
a
ct
ion
al
co
n
ver
si
on
Active cathode surface area
[image:4.595.60.235.278.394.2]to cell volume ratio (m‐1)
Figure 5: Dependence of fractional conversion on active cathode surface area to cell volume ratio at a mean voltage of 4.83 V and mean current of 1.72 A.
0.9 0.92 0.94 0.96 0.98
0 20 40 60 80 100
Fr
a
ct
ion
al
co
n
ver
si
on
Active cathode surface area
[image:4.595.321.496.290.408.2]to cell volume ratio (m‐1)
Figure 6: Dependence of fractional conversion on active cathode surface area to cell volume ratio at a mean voltage of 2.82 V and mean current of 0.93 A.
For a wastewater with an initial Cu2+ ions
concentration of 100 ppm (0.1 kgm-3), the optimum
numerical solution of (2) resulted in the following values:
Optimum final copper concentration, CFO≤ 1 x 10-15 ppm
≤ 1 x 10-18 kgm-3≈ 0
Optimum active cathode surface area to cell volume ratio,
RSVO≥ 153.6 m-1
Optimum time, tOP≤ 153.6 s
Optimum apparent first order reaction rate constant, kOP≥
4.88 x 10⁻⁴ ms-1
With these results, the second stage experimentation was set-out to achieve final copper
concentration of zero from an initial Cu2+ ions
concentration of 100 ppm (0.1 kgm-3). With the
experimental parameters listed below, the results obtained were plotted as shown in Figures 7 and 8.
Average current = 1.72 A, Average voltage = 3.21 V,
Wastewater volume = 0.00015 m3
[image:4.595.59.235.450.564.2]0 0.001 0.002 0.003
0 100 200
Fi
n
al
copp
er
con
ce
n
tr
at
ion
(kgm
‐
3)
Active cathode surface area
[image:5.595.56.232.96.227.2]to cell volume ratio (m‐1) t = 10800 s t = 5400 s
Figure 7: Dependence of final copper concentration on active cathode surface area to cell volume ratio at a mean voltage of 3.21 V and mean current of 1.72 A.
0 0.002 0.004 0.006
0 100 200
Av
e
ra
ge
curr
en
t
effi
ci
ency
Active cathode surface
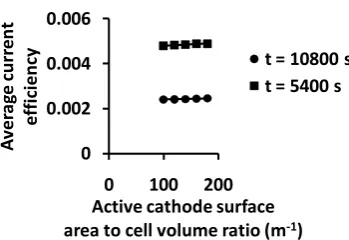
[image:5.595.320.498.105.225.2]area to cell volume ratio (m‐1) t = 10800 s t = 5400 s
Figure 8: Dependence of average current efficiency on active cathode surface area to cell volume ratio at a mean voltage of 3.21 V and mean current of 1.72 A.
efficiencies. Zero Cu2+ ions concentration was obtained
when the active cathode surface area to cell volume ratio
was 180 m-1 at 180 minutes (10800 s) as shown in Figure
7. This corresponds to a current efficiency of 0.2454% as shown in Figure 8.
By optimising (5), the optimum electrolyte
volume VS and current I needed to have 100% current
efficiency at the optimal time tOP of about 153.6 s was
plotted as shown in Figure 9. As a guide, the current range was chosen to vary from 1A to 2A based on the first and second stage experimental operations.
Experiment to achieve a zero final concentration of copper at almost 100% current efficiency necessitated the third stage fabrication and operation of electrochemical cells at conditions that satisfied theoretically predicted optimal parameters from (2) to (5). With the parameters listed below, the results obtained were shown in Figures 10 and 11.
Electrolysis time, t = 153 s (because optimum time, tOP≤
153.6 s), Average current = 1.72 A, Average voltage =
2.90 V, Wastewater volume = 0.000862 m3
As shown in Figure 10, zero Cu2+ ions concentration was
obtained when the active cathode surface area to cell
volume ratio was 550 m-1 (optimum active cathode
surface area to cell volume ratio, RSVO≥ 153.6 m-1).
0 0.0004 0.0008 0.0012
0 0.5 1 1.5 2 2.5
El
e
ct
ro
ly
te
volum
e
(m
3)
Current (A)
Figure 9: Variation of optimum electrolyte volume with optimum current.
0 0.0002 0.0004 0.0006 0.0008 0.001
0 200 400 600
Fi
na
l
co
pper
co
nc
entr
atio
n
(kgm
‐
3)
Active cathode surface area
[image:5.595.319.472.268.386.2]to cell volume ratio (m‐1)
Figure 10: Dependence of final copper concentration on active cathode surface area to cell volume ratio at a mean voltage of 2.90 V and mean current of 1.72 A.
0.8000 0.8500 0.9000 0.9500 1.0000
0 500 1000
Av
er
ag
e
curr
ent
effi
ci
en
cy
Active cathode surface
area to cell volume ratio (m‐1)
Figure 11: Dependence of average current efficiency on active cathode surface area to cell volume ratio at a mean voltage of 2.90 V and mean current of 1.72 A.
As shown in Figure 11, this corresponds to a current efficiency of 99.56% which is approximately
100% at an optimum current density of 41.05 Am-2. A
[image:5.595.59.234.274.394.2] [image:5.595.319.498.436.553.2]Copper cathode
Electrolyte solution
Graphite anode
Figure 12: Plan view of cells’ arrangement.
VI. CONCLUSION
The reduction of copper ions (Cu2+) from a
wastewater sample containing 0.1 kgm-3 (100 ppm)
copper ions concentration to zero at near 100% current efficiency was investigated. The identification of the basic parameters and criteria needed to optimise the performance of any electrochemical cell were identified. Mathematical modelling and optimisation indicated an optimum active cathode surface area to cell volume ratio
RSVO greater than or equal to 153.6 m-1, and an optimum
time tOP that must be less than or equal to 153.6 s.
Fabrication of electrochemical cells, parametric studies of relevant variables, operation of cells guided by the parametric studies in addition to theoretically predicted optimum operating conditions achieved zero concentration of copper at a maximum current efficiency
of 99.56% and an optimum current density of 41.05 Am-2.
The study serves to enhance researchers to design optimum wastewater treatment cells of varying sizes or capacities, with the possibility of achieving zero contaminant concentration at almost 100% efficiencies.
ACKNOWLEDGMENT
The Department of Chemical Engineering, University of Lagos, Akoka, Lagos, Nigeria and the entire institution is appreciated for the supportive environment towards the success of this work.
REFERENCES
[1] S. K. Agarwal, S. C. Tiwari, and S. C. Dash, Spectrum of poisoning requiring hemodialysis in a
tertiary care hospital in India. International Journal of
Artificial Organs, 16(1), 1993, 20–22.
[2] J. Wyllie, Copper poisoning at a cocktail party.
American Journal of Public Health, 47, 1957, 617.
[3] K. C. Spitalny, B. Jack, L. V. Richard, E. S. Harold, E. Sargent, and K. Steven, Drinking- water-induced
copper intoxication in a Vermont family. Pediatrics,
74(6), 1984, 1103–1106.
[4] US EPA, Drinking water criteria document for
copper. Cincinnati, OH, US Environmental Protection Agency, Office of Health and
Environmental Assessment, Environmental Criteria and Assessment Office, 1987.
[5] L. Knobeloch, M. Ziarnik, J. Howard, B. Theis, D. Farmer, H. Anderson, and M. Proctor Gastrointestinal upsets associated with ingestion of copper-
contaminated water. Environmental Health
Perspectives, 102(11), 1994, 958–961.
[6] B. A. Low, J. M. Donohue, and C. B. Bartley,
Backflow prevention failures and copper poisonings
associated with post-mix soft drink dispensers. Ann Arbor, MI, NSF International, 1996.
[7] L. Stenhammar, Diarrhoea following contamination
of drinking water with copper. European Journal of
Medical Research, 4, 1999, 217–218.
[8] M. Olivares, P. Fernando, S. Hernán, L. Bo, U. Ricardo, Copper in infant nutrition: Safety of World Health Organization provisional guideline value for
copper content of drinking water. Journal of
Pediatric Gastroenterology and Nutrition, 26, 1998, 251–257.
[9] M. Olivares, P. Fernando, S. Hernán, L. Bo, U. Ricardo, Nausea threshold in apparently healthy individuals who drank fluids containing graded
concentrations of copper. Regulatory Toxicology and
Pharmacology, 33(3), 2001, 271–275.
[10] M. Araya, M. C. McGoldrick, L. M. Klevay, J. J. Strain, P. Robson, F. Nielsen, M. Olivares, F. Pizarro, L. Johnson, and K. A. Poirier,
Determination of an acute no-observed-adverse- effect level (NOAEL) for copper in water. Regulatory Toxicology and Pharmacology, 34, 2001, 137–145.
[11] M. Araya, M. Olivares, F. Pizarro, M. González, H. Speisky, and R. Uauy, Gastrointestinal symptoms and blood indicators of copper load in apparently healthy adults undergoing controlled copper
exposure. American Journal of Clinical Nutrition,
77, 2003, 646–650.
[12] F. Pizzaro, M. Olivares, R. Uauy, P. Contreras, A. Rebelo, and V. Gidi, Acute gastrointestinal effects of graded levels of copper in drinking water, Environmental Health Perspectives, 107(2), 1999, 117–121.
[13] F. Pizzaro, M. Olivares, M. Araya, V. Gidi, and R. Uauy, Gastrointestinal effects associated with soluble and insoluble copper in drinking water.
949–952.
[14] B. P. Zietz, H. H. Dieter, M. Lakomek, H.
Schneider, B. Keszler-Gaedtke, and H. Dunkelberg, Epidemiological investigations on chronic copper toxicity to children exposed via the public drinking
water supply. The Science of the Total Environment,
302, 2003, 127–144.
[15] IOM, Dietary reference intakes for vitamin A,
vitamin K, arsenic, boron, chromium, copper, iodine, iron, manganese, molybdenum, nickel, silicon, vanadium and zinc. A report of the Panel on Micronutrients, Subcommittees on Upper
Reference Levels of Nutrients and of Interpretation and Use of Dietary Reference Intakes, and the Standing Committee on the Scientific Evaluation of Dietary Reference Intakes. Food and Nutrition Board, Institute of Medicine. Washington, DC, National Academy Press, 2001.
[16] L. Yijiu, X. Zeng, Y. Liu, S. Yan, Z. Hu, and Y. Ni, Study on the treatment of copper-electroplating wastewater by chemical trapping and flocculation, http://www.docstoc.com/docs /22188038/, 2010.
[17] C. D. Zhou, and D. T. Chin, Plat. Surf. Finish.,
Vol. 80, 1993.
[18] A. A. Al-Shammari, S. U. Rahman, and D. T. Chin,
J. Appl. Electrochem., 34, 2004, pp. 447- 453.
[19] R. P. Tison, and B. Howie, Plat. Surf. Finish., 71,
1984, 54.
[20] C. D. Zhou, Electrolytic treatment of complex metal cyanides and mass transfer study with a
platting barrel, PhD Dissertation, Clarkson
University, N.Y., U.S.A, 1993.
[21] B. A. Olufemi, O. O. Oyewo, and K. V. Okiy,
Scale-up operations of CuSO4-Na2SO4 electrolytic
wastewater cell, Journal of Applied Science and Technology (JAST), Vol. 14, Nos. 1 & 2, 2009, pp. 56 – 60.
[22] H. N. Hammer, and H. Tilton, Barrel and Rack
Plating for Electronic Applications, American Electroplaters Society, Winter Park, FL,1983.
[23] D. T. Chin, Chem. Eng. Ed., Vol. 36, 2002.
[24] R. C. Alkire, and M. Stadtherr, Optimisation of Electrolytic Cells and Processes, AIChE Symposium Series, 229, (79), 1983, 135-141.
[25] B. A. Olufemi, Characterisation of Locally Produced Diaphragm Cells for the Production of Caustic Soda, Ph. D. Thesis, University of Lagos, Akoka, Lagos, Nigeria, 2008, pp 1 - 298.
[26] K. B. Keating, and V. D. Sutlic, The Cost of Electrochemical Cells, AIChE Symposium Series, 185, (75), 1979, 76-88.
[27] O. Levenspiel, Chemical Reaction Engineering”,
Wiley Eastern Limited, New Delhi, 2nd ed., 1988,
pp. 460-478.