Automatically Evaluating Answers to Definition Questions
Jimmy Lin1,3 and Dina Demner-Fushman2,3 1College of Information Studies
2Department of Computer Science 3Institute for Advanced Computer Studies
University of Maryland College Park, MD 20742, USA
jimmylin@umd.edu, demner@cs.umd.edu
Abstract
Following recent developments in the au-tomatic evaluation of machine translation and document summarization, we present a similar approach, implemented in a mea-sure called POURPRE, for automatically evaluating answers to definition questions. Until now, the only way to assess the cor-rectness of answers to such questions in-volves manual determination of whether an information nugget appears in a sys-tem’s response. The lack of automatic methods for scoring system output is an impediment to progress in the field, which we address with this work. Experiments with the TREC 2003 and TREC 2004 QA tracks indicate that rankings produced by our metric correlate highly with official rankings, and that POURPREoutperforms direct application of existing metrics.
1 Introduction
Recent interest in question answering has shifted away from factoid questions such as “What city is the home to the Rock and Roll Hall of Fame?”, which can typically be answered by a short noun phrase, to more complex and difficult questions. One interesting class of information needs con-cerns so-called definition questions such as “Who is Vlad the Impaler?”, whose answers would include “nuggets” of information about the 16th century warrior prince’s life, accomplishments, and legacy.
Actually a misnomer, definition questions can be better paraphrased as “Tell me interesting things about X.”, where X can be a person, an organiza-tion, a common noun, etc. Taken another way, defi-nition questions might be viewed as simultaneously asking a whole series of factoid questions about the same entity (e.g., “When was he born?”, “What was his occupation?”, “Where did he live?”, etc.), except that these questions are not known in advance; see Prager et al. (2004) for an implementation based on this view of definition questions.
Much progress in natural language processing and information retrieval has been driven by the creation of reusable test collections. A test collection con-sists of a corpus, a series of well-defined tasks, and a set of judgments indicating the “correct answers”. To complete the picture, there must exist meaning-ful metrics to evaluate progress, and ideally, a ma-chine should be able to compute these values auto-matically. Although “answers” to definition ques-tions are known, there is no way to automatically and objectively determine if they are present in a given system’s response (we will discuss why in Section 2). The experimental cycle is thus tortuously long; to accurately assess the performance of new techniques, one must essentially wait for expensive, large-scale evaluations that employ human assessors to judge the runs (e.g., the TREC QA track). This situation mirrors the state of machine translation and document summarization research a few years ago. Since then, however, automatic scoring metrics such as BLEUand ROUGEhave been introduced as stop-gap measures to facilitate experimentation.
Following these recent developments in
1 vital 32 kilograms plutonium powered 2 vital seven year journey
3 vital Titan 4-B Rocket
4 vital send Huygens to probe atmosphere of Titan, Saturn’s largest moon 5 okay parachute instruments to planet’s surface
6 okay oceans of ethane or other hydrocarbons, frozen methane or water 7 vital carries 12 packages scientific instruments and a probe
8 okay NASA primary responsible for Cassini orbiter
9 vital explore remote planet and its rings and moons, Saturn 10 okay European Space Agency ESA responsible for Huygens probe
11 okay controversy, protest, launch failure, re-entry, lethal risk, humans, plutonium 12 okay Radioisotope Thermoelectric Generators, RTG
13 vital Cassini, NASA’S Biggest and most complex interplanetary probe 14 okay find information on solar system formation
[image:2.612.112.506.52.291.2]15 okay Cassini Joint Project between NASA, ESA, and ASI (Italian Space Agency) 16 vital four year study mission
Table 1: The “answer key” to the question “What is the Cassini space probe?”
tion research, we propose POURPRE, a technique for automatically evaluating answers to definition ques-tions. Like the abovementioned metrics, POURPRE is based on n-gram co-occurrences, but has been adapted for the unique characteristics of the question answering task. This paper will show that POUR -PRE can accurately assess the quality of answers to definition questions without human intervention, allowing experiments to be performed with rapid turnaround. We hope that this will enable faster ex-ploration of the solution space and lead to acceler-ated advances in the state of the art.
This paper is organized as follows: In Section 2, we briefly describe how definition questions are cur-rently evaluated, drawing attention to many of the intricacies involved. We discuss previous work in Section 3, relating POURPRE to evaluation metrics for other language applications. Section 4 discusses metrics for evaluating the quality of an automatic scoring algorithm. The POURPRE measure itself is outlined in Section 5; POURPRE scores are corre-lated with official human-generated scores in Sec-tion 6, and also compared to existing metrics. In Section 7, we explore the effect that judgment vari-ability has on the stvari-ability of definition question evaluation, and its implications for automatic scor-ing algorithms.
2 Evaluating Definition Questions
To date, NIST has conducted two formal evaluations of definition questions, at TREC 2003 and TREC 2004.1 In this section, we describe the setup of the task and the evaluation methodology.
Answers to definition questions are comprised of an unordered set of [document-id, answer string] pairs, where the strings are presumed to provide some relevant information about the entity being “defined”, usually called the target. Although no explicit limit is placed on the length of the answer string, the final scoring metric penalizes verbosity (discussed below).
To evaluate system responses, NIST pools answer strings from all systems, removes their association with the runs that produced them, and presents them to a human assessor. Using these responses and re-search performed during the original development of the question, the assessor creates an “answer key”— a list of “information nuggets” about the target. An information nugget is defined as a fact for which the assessor could make a binary decision as to whether a response contained that nugget (Voorhees, 2003). The assessor also manually classifies each nugget as
1TREC 2004 questions were arranged around “topics”;
[XIE19971012.0112] The Cassini space probe, due to be launched from Cape Canaveral in Florida of the United States tomorrow, has a 32 kilogram plutonium fuel payload to power its seven year journey to Venus and Saturn.
Nuggets assigned:1, 2
[image:3.612.313.540.223.429.2][NYT19990816.0266] Early in the Saturn visit, Cassini is to send a probe named Huygens into the smog-shrouded atmosphere of Titan, the planet’s largest moon, and parachute instruments to its hidden surface to see if it holds oceans of ethane or other hydrocarbons over frozen layers of methane or water. Nuggets assigned:4, 5, 6
Figure 1: Examples of judging actual system responses.
either vital or okay. Vital nuggets represent con-cepts that must be present in a “good” definition; on the other hand, okay nuggets contribute worth-while information about the target but are not essen-tial; cf. (Hildebrandt et al., 2004). As an example, nuggets for the question “What is the Cassini space probe?” are shown in Table 1.
Once this answer key of vital/okay nuggets is cre-ated, the assessor then manually scores each run. For each system response, he or she decides whether or not each nugget is present. Assessors do not sim-ply perform string matches in this decision process; rather, this matching occurs at the conceptual level, abstracting away from issues such as vocabulary differences, syntactic divergences, paraphrases, etc. Two examples of this matching process are shown in Figure 1: nuggets 1 and 2 were found in the top passage, while nuggets 4, 5, and 6 were found in the bottom passage. It is exactly this process of concep-tually matching nuggets from the answer key with system responses that we attempt to capture with an automatic scoring algorithm.
The final F-score for an answer is calculated in the manner described in Figure 2, and the final score of a run is simply the average across the scores of all questions. The metric is a harmonic mean between nugget precision and nugget recall, where recall is heavily favored (controlled by theβ parameter, set to five in 2003 and three in 2004). Nugget recall is calculated solely on vital nuggets, while nugget pre-cision is approximated by a length allowance given based on the number of both vital and okay nuggets returned. Early on in a pilot study, researchers dis-covered that it was impossible for assessors to con-sistently enumerate the total set of nuggets contained
Let
r # ofvitalnuggets returned in a response
a # ofokaynuggets returned in a response
R # ofvitalnuggets in the answer key
l # of non-whitespace characters in the entire answer string
Then
recall (R) =r/R
allowance (α) =100×(r+a)
precision (P) = (
1 ifl < α 1−l−α
l otherwise
Finally, theF(β) = (β
2+ 1)× P × R
β2× P+R
β = 5in TREC 2003,β = 3in TREC 2004.
Figure 2: Official definition of F-measure.
in a system response, given that they were usually extracted text fragments from documents (Voorhees, 2003). Thus, a penalty for verbosity serves as a sur-rogate for precision.
3 Previous Work
Recently, Soricut and Brill (2004) employed n-gram co-occurrences to evaluate question answer-ing in a FAQ domain; unfortunately, the task differs from definition question answering, making their re-sults not directly applicable. Xu et al. (2004) applied ROUGE to automatically evaluate answers to defi-nition questions, viewing the task as a variation of document summarization. Because TREC answer nuggets were terse phrases, the authors found it nec-essary to rephrase them—two humans were asked to manually create “reference answers” based on the assessors’ nuggets and IR results, which was a labor-intensive process. Furthermore, Xu et al. did not perform a large-scale assessment of the reliability of ROUGEfor evaluating definition answers.
4 Criteria for Success
Before proceeding to our description of POURPRE, it is important to first define the basis for assessing the quality of an automatic evaluation algorithm. Cor-relation between official scores and automatically-generated scores, as measured by the coefficient of determination R2, seems like an obvious metric for quantifying the performance of a scoring algorithm. Indeed, this measure has been employed in the eval-uation of BLEU, ROUGE, and other related metrics.
However, we believe that there are better mea-sures of performance. In comparative evaluations, we ultimately want to determine if one technique is “better” than another. Thus, the system rank-ings produced by a particular scoring method are often more important than the actual scores them-selves. Following the information retrieval litera-ture, we employ Kendall’sτ to capture this insight. Kendall’s τ computes the “distance” between two rankings as the minimum number of pairwise adja-cent swaps necessary to convert one ranking into the other. This value is normalized by the number of items being ranked such that two identical rankings produce a correlation of1.0; the correlation between a ranking and its perfect inverse is−1.0; and the ex-pected correlation of two rankings chosen at random is0.0. Typically, a value of greater than0.8is con-sidered “good”, although0.9represents a threshold researchers generally aim for. In this study, we pri-marily focus on Kendall’sτ, but also report R2 val-ues where appropriate.
5 POURPRE
Previously, it has been assumed that matching nuggets from the assessors’ answer key with sys-tems’ responses must be performed manually be-cause it involves semantics (Voorhees, 2003). We would like to challenge this assumption and hypoth-esize that term co-occurrence statistics can serve as a surrogate for this semantic matching process. Ex-perience with the ROUGE metric has demonstrated the effectiveness of matching unigrams, an idea we employ in our POURPRE metric. We hypothesize that matching bigrams, trigrams, or any other longer n-grams will not be beneficial, because they primar-ily account for the fluency of a response, more rele-vant in a machine translation task. Since answers to definition questions are usually document extracts, fluency is less important a concern.
The idea behind POURPREis relatively straight-forward: match nuggets by summing the unigram co-occurrences between terms from each nugget and terms from the system response. We decided to start with the simplest possible approach: count the word overlap and divide by the total number of terms in the answer nugget. The only additional wrinkle is to ensure that all words appear within the same answer string. Since nuggets represent coherent concepts, they are unlikely to be spread across different an-swer strings (which are usually different extracts of source documents). As a simple example, let’s say we’re trying to determine if the nugget “A B C D” is contained in the following system response:
1. A 2. B C D 3. D 4. A D
The match score assigned to this nugget would be
3/4, from answer string 2; no other answer string would get credit for this nugget. This provision re-duces the impact of coincidental term matches.
calcula-POURPRE ROUGE Run micro, cnt macro, cnt micro,idf macro,idf +stop −stop TREC 2004 (β= 3) 0.785 0.833 0.806 0.812 0.780 0.786 TREC 2003 (β= 3) 0.846 0.886 0.848 0.876 0.780 0.816 TREC 2003 (β= 5) 0.890 0.878 0.859 0.875 0.807 0.843
Table 2: Correlation (Kendall’sτ) between rankings generated by POURPRE/ROUGEand official scores.
POURPRE ROUGE
Run micro, cnt macro, cnt micro,idf macro,idf +stop −stop TREC 2004 (β= 3) 0.837 0.929 0.904 0.914 0.854 0.871 TREC 2003 (β= 3) 0.919 0.963 0.941 0.957 0.876 0.887 TREC 2003 (β= 5) 0.954 0.965 0.957 0.964 0.919 0.929
Table 3: Correlation (R2) between values generated by POURPRE/ROUGEand official scores.
tion, the length allowance—for the purposes of com-puting nugget precision—was 100 non-whitespace characters for every okay and vital nugget returned. Since nugget match scores are now fractional, this required some adjustment. We settled on an al-lowance of 100 non-whitespace characters for every nugget match that had non-zero score.
A major drawback of this basic unigram over-lap approach is that all terms are considered equally important—surely, matching “year” in a system’s re-sponse should count for less than matching “Huy-gens”, in the example about the Cassini space probe. We decided to capture this intuition using in-verse document frequency, a commonly-used mea-sure in information retrieval; idf(ti) is defined as
log(N/ci), whereN is the number of documents in the collection, and ci is the number of documents that contain the termti. With scoring based on idf, term counts are simply replaced with idf sums in computing the match score, i.e., the match score of a particular nugget is the sum of theidfs of match-ing terms in the system response divided by the sum of all term idfs from the answer nugget. Finally, we examined the effects of stemming, i.e., matching stemmed terms derived from the Porter stemmer.
In the next section, results of experiments with submissions to TREC 2003 and TREC 2004 are re-ported. We attempted two different methods for ag-gregating results: microaveraging and macroaverag-ing. For microaveraging, scores were calculated by computing the nugget match scores over all nuggets
for all questions. For macroaveraging, scores for each question were first computed, and then aver-aged across all questions in the testset. With mi-croaveraging, each nugget is given equal weight, while with macroaveraging, each question is given equal weight.
As a baseline, we revisited experiments by Xu et al. (2004) in using ROUGE to evaluate definition questions. What if we simply concatenated all the answer nuggets together and used the result as the “reference summary” (instead of using humans to create custom reference answers)?
6 Evaluation of POURPRE
We evaluated all definition question runs submitted to the TREC 20032 and TREC 2004 question an-swering tracks with different variants of our POUR -PREmetric, and then compared the results with the official F-scores generated by human assessors. The Kendall’sτ correlations between rankings produced by POURPREand the official rankings are shown in Table 2. The coefficients of determination (R2) be-tween the two sets of scores are shown in Table 3. We report four separate variants along two different parameters: scoring by term counts only vs. scoring by termidf, and microaveraging vs. macroaveraging. Interestingly, scoring based on macroaveraged term
2
[image:5.612.96.513.164.236.2]Figure 3: Scatter graph of official scores plotted against the POURPRE scores (macro, count) for TREC 2003 (β = 5).
counts outperformed any of theidfvariants.
A scatter graph plotting official F-scores against POURPRE scores (macro, count) for TREC 2003 (β = 5) is shown in Figure 3. Corresponding graphs for other variants appear similar, and are not shown here. The effect of stemming on the Kendall’sτ cor-relation between POURPRE (macro, count) and of-ficial scores in shown in Table 4. Results from the same stemming experiment on the other POURPRE variants are similarly inconclusive.
For TREC 2003 (β = 5), we performed an anal-ysis of rank swaps between official and POURPRE scores. A rank swap is said to have occurred if the relative ranking of two runs is different under dif-ferent conditions—they are significant because rank swaps might prevent researchers from confidently drawing conclusions about the relative effectiveness of different techniques. We observed 81 rank swaps (out of a total of 1431 pairwise comparisons for 54 runs). A histogram of these rank swaps, binned by the difference in official score, is shown in Figure 4. As can be seen, 48 rank swaps (59.3%) occurred when the difference in official score is less than
0.02; there were no rank swaps observed for runs in which the official scores differed by more than
0.061. Since measurement error is an inescapable fact of evaluation, we need not be concerned with rank swaps that can be attributed to this factor. For TREC 2003, Voorhees (2003) calculated this value to be approximately0.1; that is, in order to conclude with 95% confidence that one run is better than
an-Run unstemmed stemmed
[image:6.612.76.296.54.209.2]TREC 2004 (β = 3) 0.833 0.825 TREC 2003 (β = 3) 0.886 0.897 TREC 2003 (β = 5) 0.878 0.895
Table 4: The effect of stemming on Kendall’sτ; all runs with (macro, count) variant of POURPRE.
Figure 4: Histogram of rank swaps for TREC 2003 (β = 5), binned by difference in official score.
other, an absolute F-score difference greater than0.1
must be observed. As can be seen, all the rank swaps observed can be attributed to error inherent in the evaluation process.
From these results, we can see that evaluation of definition questions is relatively coarse-grained. However, TREC 2003 was the first formal evalua-tion of definievalua-tion quesevalua-tions; as methodologies are re-fined, the margin of error should go down. Although a similar error analysis for TREC 2004 has not been performed, we expect a similar result.
Given the simplicity of our POURPRE metric, the correlation between our automatically-derived scores and the official scores is remarkable. Starting from a set of questions and a list of relevant nuggets, POURPREcan accurately assess the performance of a definition question answering system without any human intervention.
6.1 Comparison Against ROUGE
[image:6.612.327.526.164.308.2]an-swering systems employ extractive techniques, flu-ency (i.e., precision) is not usually an issue.
How does POURPRE stack up against using ROUGE3 to directly evaluate definition questions? The Kendall’sτ correlations between rankings pro-duced by ROUGE (with and without stopword re-moval) and the official rankings are shown in Ta-ble 2;R2 values are shown in Table 3. In all cases, ROUGEdoes not perform as well.
We believe that POURPRE better correlates with official scores because it takes into account special characteristics of the task: the distinction between vital and okay nuggets, the length penalty, etc. Other than a higher correlation, POURPREoffers an advan-tage over ROUGE in that it provides a better diag-nostic than a coarse-grained score, i.e., it can reveal whyan answer received a particular score. This al-lows researchers to conduct failure analyses to iden-tify opportunities for improvement.
7 The Effect of Variability in Judgments
As with many other information retrieval tasks, legitimate differences in opinion about relevance are an inescapable fact of evaluating definition questions—systems are designed to satisfy real-world information needs, and users inevitably dis-agree on which nuggets are important or relevant. These disagreements manifest as scoring variations in an evaluation setting. The important issue, how-ever, is the degree to which variations in judgments affect conclusions that can be drawn in a compar-ative evaluation, i.e., can we still confidently con-clude that one system is “better” than another? For the ad hoc document retrieval task, research has shown that system rankings are stable with respect to disagreements about document relevance (Voorhees, 2000). In this section, we explore the effect of judg-ment variability on the stability and reliability of TREC definition question answering evaluations.
The vital/okay distinction on nuggets is one major source of differences in opinion, as has been pointed out previously (Hildebrandt et al., 2004). In the Cassini space probe example, we disagree with the assessors’ assignment in many cases. More impor-tantly, however, there does not appear to be any
op-3We used ROUGE-1.4.2 with
[image:7.612.326.528.53.198.2]nset to 1, i.e. unigram match-ing, and maximum matching score rating.
Figure 5: Distribution of rank placement using ran-dom judgments (for top two runs from TREC 2004).
erationalizable rules for classifying nuggets as either vital or okay. Without any guiding principles, how can we expect our systems to automatically recog-nize this distinction?
How do differences in opinion about vital/okay nuggets impact the stability of system rankings? To answer this question, we measured the Kendall’sτ
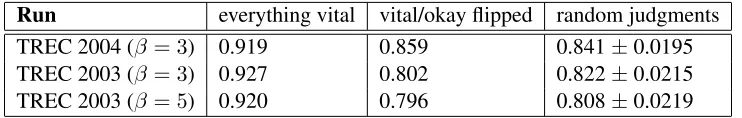
correlation between the official rankings and rank-ings produced by different variations of the answer key. Three separate variants were considered:
• all nuggets considered vital
• vital/okay flipped (all vital nuggets become okay, and all okay nuggets become vital)
• randomly assigned vital/okay labels
Results are shown in Table 5. Note that this exper-iment was conducted with the manually-evaluated system responses, not our POURPREmetric. For the last condition, we conducted one thousand random trials, taking into consideration the original distri-bution of the vital and okay nuggets for each ques-tion using a simplified version of the Metropolis-Hastings algorithm (Chib and Greenberg, 1995); the standard deviations are reported.
These results suggest that system rankings are sensitive to assessors’ opinion about what consti-tutes a vital or okay nugget. In general, the Kendall’s
Run everything vital vital/okay flipped random judgments TREC 2004 (β= 3) 0.919 0.859 0.841±0.0195 TREC 2003 (β= 3) 0.927 0.802 0.822±0.0215 TREC 2003 (β= 5) 0.920 0.796 0.808±0.0219
Table 5: Correlation (Kendall’sτ) between scores under different variations of judgments and the official scores. The 95% confidence interval is presented for the random judgments case.
TREC 2004 (RUN-12 and RUN-8) over the one thousand random trials is shown in Figure 5. In 511 trials, RUN-12 was ranked as the highest-scoring run; however, in 463 trials, RUN-8 was ranked as the highest-scoring run. Factoring in differences of opinion about the vital/okay distinction, one could not conclude with certainty which was the “best” run in the evaluation.
It appears that differences between POURPREand the official scores are about the same as (or in some cases, smaller than) differences between the official scores and scores based on variant answer keys (with the exception of “everything vital”). This means that further refinement of the metric to increase correla-tion with human-generated scores may not be par-ticularly meaningful; it might essentially amount to overtraining on the whims of a particular human as-sessor. We believe that sources of judgment variabil-ity and techniques for managing it represent impor-tant areas for future study.
8 Conclusion
We hope that POURPREcan accomplish for defini-tion quesdefini-tion answering what BLEU has done for machine translation, and ROUGEfor document sum-marization: allow laboratory experiments to be con-ducted with rapid turnaround. A much shorter ex-perimental cycle will allow researchers to explore different techniques and receive immediate feedback on their effectiveness. Hopefully, this will translate into rapid progress in the state of the art.4
9 Acknowledgements
This work was supported in part by ARDA’s Advanced Question Answering for Intelligence (AQUAINT) Program. We would like to thank
4A toolkit implementing the P
OURPREmetric can be down-loaded at http://www.umiacs.umd.edu/∼jimmylin/downloads/
Donna Harman and Bonnie Dorr for comments on earlier drafts of this paper. In addition, we would like to thank Kiri for her kind support.
References
Bogdan Babych and Anthony Hartley. 2004. Extend-ing the BLEU MT evaluation method with frequency weightings. InProc. of ACL 2004.
Siddhartha Chib and Edward Greenberg. 1995. Under-standing the Metropolis-Hastings algorithm. Ameri-can Statistician, 49(4):329–345.
Wesley Hildebrandt, Boris Katz, and Jimmy Lin. 2004. Answering definition questions with multiple knowl-edge sources. InProc. of HLT/NAACL 2004.
Chin-Yew Lin and Eduard Hovy. 2003. Automatic evalu-ation of summaries using n-gram co-occurrence statis-tics. InProc. of HLT/NAACL 2003.
Chin-Yew Lin and Franz Josef Och. 2004. ORANGE: A method for evaluating automatic evaluation metrics for machine translation. InProc. of COLING 2004.
Kishore Papineni, Salim Roukos, Todd Ward, and Wei-Jing Zhu. 2002. BLEU: a method for automatic eval-uation of machine translation. InProc. of ACL 2002.
John Prager, Jennifer Chu-Carroll, and Krzysztof Czuba. 2004. Question answering using constraint satisfac-tion: QA–by–Dossier–with–Constraints. In Proc. of ACL 2004.
Radu Soricut and Eric Brill. 2004. A unified framework for automatic evaluation using n-gram co-occurrence statistics. InProc. of ACL 2004.
Ellen M. Voorhees. 2000. Variations in relevance judg-ments and the measurement of retrieval effectiveness. Information Processing and Management, 36(5):697– 716.
Ellen M. Voorhees. 2003. Overview of the TREC 2003 question answering track. InProc. of TREC 2003.