ECONOMIC
THE
RESEARCH
INSTITUTE
Local Government Finance and County Incomes
by
DAVID WALKER
March, I964
Paper No. i8.
THE
ECONOMIC RESEARCH INSTITUTE
EXECUTIVE BOARD ~963-64
J. J. McELLIGOTT, M.A., LL.D., President of the Institute.
G. O’BRIF2~, D.LITT., LITT.D., Chairman of the Executive Board.
C. S. ANDREWS, B.COMM., D.ECON.SC., Chairman, C6ras Iompair ]~ireann.
j. P. BEDDY, D.ECON.SC., LL.D. (H.C.)
Chairman and Managing Director, The Industrial Credit Company Ltd.
R. D. C. BLACK, PH.D.,
Professor, Department of Economics, The Queen’s University, Belfast.
J. BUSTEED, M.COMM.,
Professor, Department of Economics, University College, Cork.
G. A. DUNCAN, S.F.T.C.D.,
Professor of Political Economy, Trinity College, Dublin.
R. C. GEARY, D.SC., D.ECON.SC., Director of the Institute.
W. A. HONOHAN, M.A., F.I.A.,
Secretary, Department of Social Welfare.
M. D. MCCARTHY, M.A., PH.D., Director, Central Statistics Office.
J. F. MY..ENAN, M.A., B.L.,
Professor of Political Economy, University College, Dublin.
C. K. MILL, B.A., D.SC.,
Managing Director, Arthur Guinness Son & Company (Dublin) Ltd.
D: NEVIN,
Research Officer, Irish Congress of Trade Unions.
L. O’BUACHALLA, M.COMM.,
Professor, Department of Economics, University College, Galway.
J. C. TONGE,
Federation of Irish Industries.
T. WALSH, D.SC.,
Director, An Fpras Taldntais.
T. K. WHITAKER, M.SC. (ECON.), D.ECON.SC., Secretary, Department of Finance.
GERALD WILSON,
Director, Bank of Ireland, Dublin.
FOREWORD
Local Government Finance and County
by DAVID WALKER*
Incomes
In a section of a previous publicationz the following tentative conclusions relating to the broad distribution of Local Authority expenditure and revenue in I959/6o were reached
:--z. The level of Local Government services provided varied widely across the State. z. The burden of local taxation also varied across
the State when looked at in connection with rateable value.
3. There seemed to be some evidence that the burden of local taxation (in the above sense) was often higher in those areas where the level of services was lower.
4. As measured by per capita rateable values the level of wealth varied considerably in the State from one Local Authority area to another. 5. There was no evidence that the grants from
the Central Government particularly helped the poorer areas (as indicated by low per capita rateable values) more than the richer areas. Though these conclusions were reached after a
consideration of the available statistical material and in the light of general arguments relating to Local Authority financial matters,2 it was pointed out with some emphasis that " the basic material was hardly strong enough to support any very firm conclusions ". In particular it was argued that conclusions involving statements relating to the relative income or wealtha of the various Local Authority areas (for example, points 4 and 5) were
*The author of this paper was a Senior Research Officer of The Economic Research Institute. The paper has been accepted for publication by the Institute. The author is respon-sible for the contents of the paper including the views expressed therein.
1part IV (Patterns of Revenue and Expenditure) of "Local
Government Finance in Ireland : A Preliminary Survey",
ERI Paper No. 5, May I96z.
2For example, that contained in Part I (Some General Arguments and Assumptions) of the paper.
8In this paper the words "income " and " wealth " are used synonymously--and perhaps loosely--as shorthand expressions in place of the phrases "per capita income arising " or "per capita personal income ". In the present context, therefore, "income " refers to the total income arising in or the personal income accruing to the residents of a particular county and not to the revenue of a particular Local Authority. And the word " wealth " does not have any particular capital connotations.
particularly suspect as no satisfactory indicators of the wealth of the various authorities were available. Indeed it was stated in the paper4 that the Institute ¢vas proposing to carry out an investigation so as to obtain some better indications of the relative income and wealth position of the Irish counties so that a more satisfactory approach to those issues could be made. This work has now been completed and the present paper is concerned with applying some of the results of that work to some of the problems of Local Government finance.
Table i sets out in summary form the results of the Institute’s researches into county incomes. Full details as to how the statistics were obtained have been set out in another Institute paper.5
The net factor income calculations purport to measure the incomes arising in the various counties due to productive activity. The personal income calculations measure the total incomes--both from productive activity and those arising in other ways, for example, through social welfare payments, interest and dividend payments, remittances from abroad, etc--accruing to persons resident in the various counties. The latter statistics are probably a better indicator of a county’s ability or capacity to bear various forms of taxation. Unfortunately, however, it was not possible to allocate personal income as between the agricultural and non-agricultural sectors and in making comparisons which require such a division the income arising calculations have to be used.
It would not be claimed that either of the two calculations are ideally suitable for the purposes for which they are used in the present paper. What is claimed, however, is that they provide the best estimate that is currently available of the relative income position of the various counties.
One special difficulty arises in using the calcula-tions for purposes of considering aspects of Local Government finance. The information that is available is with respect to counties and not
4See footnote 29 and the Conclusions on pages 38 and 39.
5"Irish County Incomes in 196o" by E. A. Attwood and R. C.
TABLE 1: COUNTY INCOMES, 196o, AGGREGATE AND PER HEAD OF POPULATION, DISTINGUISHING AGRICULTURE ETC AND THE REST OF THE ECONOMY.
Net factor income arising Personal income
Aggregate Per head of population
Per head of County Agriculture, Agriculture, Aggregate population
forestry., Other Total forestry, Other Total fishing fishing
I 2 3 4 5 6 7 8 9
~000 £000 £000 £ £ £ £000 £
Carlow .... 2,373 3,370 5,743 167 175 172 7,185 215 Dublin .... 3,528 I81,8o6 185,334 174 262 259 164,631 231 Kildare .... 4,448 8,oo6 12,454 i96 191 193 14,7o3 227 Kilkenny .... 5,248 5,729 IO,977 179 174 177 13,585 219 Laoighis .... 3,458 4,01 I 7,469 164 164 164 9,280 204 Longford. .. 1,663 1,958 3,621 1OO 136 Ii6 5,297 17o Louth .... 2,o4o lO,519 12,559 145 196 186 I2,I56 18o Vieath .... 6,418 4,964 11,382 201 148 174 14,512 222 Offaly .... 3,062 5,378 8,440 135 186 163 10,320 200 Westmeath .. 3,OOl 5,15° 8,I5I 144 16o 154 lO,842 204 Wexford .... 5,703 6,757 12,46o 156 142 148 15,582 185 Wicklow .... 2,718 6,542 9,26o 155 159 158 11,921 203
LEINSTER ¯ . 43,660 244,190 287,850 I63 230 216 290,014 218 Clare .... 5,187 4,436 9,623 128 13o 129 12,435 167 Cork .... I7,692 43,2o4 60,896 18o 185 184 65,9Ol 199 Kerry .... 8,407 7,520 15,927 146 125 I35 20,5 IO 174 Limerick .... 7,869 15,225 23,094 183 167 172 27,395 204 Tipperary .. lO,O45 n,I57 21,202 187 156 17o 26,424 212 Waterford .. 4,12o 9,336 13,456 2O6 I8O 187 15,696 218
MUNSTER .. 53,320 90,878 144,198 171 168 169 168,361 197
Gahvay .... 9,167 11,300 20,467 lO3 181 136 26,950 178 Leitrina .... 2)113 1,993 4,IO6 87 202 120 5,709 167 Mayo .... 6,756 7,372 14,128 83 168 113 19,20I 153 Roscommon . . 4,220 3,453 7,673 lO8 165 128 lO,223 17o Sligo .... 3,118 4,426 7,544 116 161 139 9,461 174
CONNACHT ¯ ¯ 25,374 28,544 53,918 97 174 127 71,544 i68
Cavan .... 3,478 3,92I 7,399 IO5 161 128 9,459 164 Donegal .... 5,199 8,503 13,7o2 97 I37 119 17,626 I53 Monaghan .. 2,569 3,864 6,433 99 174 134 8,396 175
ULSTER (part) .. 11,246 16,288 27,534 I00 I50 124 35,481 16o
TOTAL .. 133,6oo 379,900 513,5OO 14o 202 18i 565,400 200
NOTES ON TABLE I
Figures in all columns except 5 and 6 derived from ERI Paper No. 16. Tables I and 12. To derive the per capita figures in columns 5 and 6 it was necessary to estimate the county population figures into (a) agriculture etc and (b) other. From Census
of Populatlon 1951, Volume nI, Part I, Table 7A were derived the agricultural population (including dependents) in each county in 195 I. To each of these figures were applied the ratio of males engaged in farm work 1960 to 1951 to give the estimated agricul-tural population in each county in 196o. The differences between these figures and the estimated total population for 1960 (estimated by interpolation from Census of Population Volume I, figures for 1951 and 196 I) gave the non-agricultural county populations. Some of the averages in column 6 seem somewhat aberrant and it naight be well to await the results of the 1961 Census of Population before drawing too firm inferences from this column. The figures in Table 12, columns 8-9 of the county incomes paper, with somewhat similiar intention but less wide scooe, are more firmly based, population-wise.
with respect to Local Authority areas. It has not, therefore, been possible to make a direct com-parison between the incomes arising in or accruing to the residents of a particular Authority area. All we have been able to do is to make an overall comparison between the totals relating to all the Local Authorities in a county and the relevant county income figures. This has meant that we have had to amalgamate the statistics relating to Local Authorities in an area, i.e., the County Councils, Urban District Councils, County
Boroughs, etc, which means that one cannot immediately conclude from the points made in the paper that a particular Authority is in a particular situation. It is believed, however, that in most instances no serious problem arises with this approach.
One final introductory point. In the Preliminary
Survey the statistics used related to 1959/6o. The
earlier paper, the Local Authority statistics that have been used in the present paper relate to 1959/6o.6 It is hoped that at a later stage an attempt can be made to bring both the income figures and the Local Authority figures more up to
date.
Table I shows that there are considerable differences in the level of per capita incomes from one county to another. The degree of inequality shown is much greater with the income arising than with the personal income statistics, the latter, of course, being much influenced by Social Welfare payments and emigrants’ remittances. Even if we use the (more equal) personal income figures there are substantial differences between the two extreme counties, the average income of Dublin, for example, being at £z3I, some £78 per head, or over 50%
greater than Mayo at £153.
It will be noted that on the whole there is broad agreement between the two series. The only major difference concerns Louth, which is ranked fifteenth on the personal income scale and second on the income arising scale. There is also a (much smaller) discrepancy as regards Cork, which is ranked twelfth on the personal income scale and fifth on the income arising scale. But in the main the two series tell the same story as to which are the relatively well-off and which the relatively poor counties. It is fairly obvious that all the Ulster and Connacht counties should be regarded as less well-off and also Kerry and Clare from Munster. In Leinster it would seem that Longford and probably--if we take both sets of figures into account--Wexford should be singled out from the rest of the Province as being less well-off. In many ways Wexford can be regarded--on the figures--as the county dividing the better-off from the less well-off counties ; counties with per capita incomes in excess of Wexford being regarded as better-off and those with lower per capita incomes as less well-off. The personal income calculations indicate that Wexford has a per capita income of £185 in com-parison with the national average of £2oo and Connacht and Ulster averages of £168 and £16o respectively. The income arising calculations suggest that Wexford has a per capita income of
~It is important, however, to remember that an important change was introduced in the 1962 Budget which affected the amount and allocation of the Agricultural Grant which had the effect of reducing the amount of the net rates payable.by farmers. The Primary Allowance was increased to a remission of 700/0 on the first £2o of the land valuation, instead of a remission of three-fifths of the rates. In addition a supple-mentary Allowance of one quarter of the rates was introduced
on the portion of the valuation of land over £2o. As a result of these changes the total Grant has increased from £5.,8.39,000 in I96I/Z to £8,530,000 in I962/3 and total rate remission on all agricultural land has increased from 420/0 to 57~/o. It is, therefore, important when reading the Paper to appreciate that in certain spheres the present position has, to a consider-able extent, moved away from that discussed in the Paper.
£148 in comparison with the national average of £i8I and Connacht and Ulster figures of £127 and £I24.~
There is little doubt that the figures deployed in Table i support the point (part of proposition 4 in the Preliminary Survey) that the level of wealth varies considerably throughout the State. The argument in the Preliminary Survey was based on an examination of rateable value per capita as this was the only estimate of county " wealth" that was then available. It is interesting, now that better figures of the wealth of counties are available, to compare the relationship between rateable values and the income figures we have just set out. This is done in Table 2.
It will be clear that though there is a substantial difference in rateable value per capita from one county to another the figures do not tell exactly the same story as the income figures which we have just been examining. Comparing average rateable values with personal income per capita it will be noted that on the whole personal incomes are about 39 times rateable values. There are, however, some very big differences in the ratio at the county level. In the case of Meath, for example, personal incomes are only 24 times the rateable values. The ratio is also low in Monaghan, Westmeath, Longford and Cavan. On the other hand there are very high ratios of personal income to rateable value in the case of Kerry (54), Donegal (48) and Mayo (48). Two points seem important with respect to these different ratios. In the first place--and this is important with respect to the points made in the
Preliminary Survey--figures of rateable value per capita can give a very misleading impression of the
relative wealth of Irish counties. Judged on a rateable value per capita basis, Meath--to take the most striking example--is by a long way the wealthiest county in the State, whereas on income figures her position is by no means outstanding.
Or again, on the personal income figures Cavan and Monaghan are well below the average for the State as a whole and yet on rateable value per capita figures Cavan is roughly in line with the State
average and Monaghan a good deal above. Similarly with Clare and Kerry. On income figures the two counties are roughly in line and yet using rateable value per capita statistics Clare appears very much better off than Kerry. Or again, whereas the income of Longford is well below the average for the State as a whole, her rateable value per capita is "abo~t average. There are a large number of discrepancies of this type; on them I will be quite dogmatic. There is every reason to believe that the income
T^BL~ 2: RATEABLE VALUE AND INCOMES
Rateable Income Personal Rateable value arising-- income--County value per rateable rateable total capita value value
X 2 3 4 5
£OOO £
Callow 188"x 5’6 30"5 38"2 Dublin ¯ 4,138"7 5"8 44"8 39"8 Kildare 360’4 5’6 34"6 40"8 Kilkenny 388’5 6"2 28"3 35"0 Laoighis 260"6 5’7 28"7 35 "6 Long ford 162"1 5"2 22"3 3z’7 Louth 320"6 4’7 39"2 37"9 Meath 585"5 8"9 I9"4 24"8 Offaly 27I"2 5"3 31"I 38"I Westmeath 346"0 6"5 23 "6 31’3 Wexford 429"z 5’1 29’o 36 "3 Wicklow 339"9 5"8 27 "2 35"1
LEINSTER 7,790"8 5"8 36"9 37"2 Clare 365"5 4"9 26’3 34"0 Cork ¯ 1,615’2 4o’8
Kerry 377"4 4’93"2 37"7
Limerick 67I’2 5.0 42 "2 54"340"8 Tipperary 742"2 5"9 34"428 ’6 35"6 Waterford 4o1"I 5"6 33"5 39"I
IV~uNSTER 4,I72’6 4"9 34’6 40"3 Galway 606’8 4"0
Leitrim 147’8 4"3 33"727"8 44"438’6 Mayo 398’3 3"2 48’2 Roscommon 323’o 35"523 "8 3I’7 Sligo 245"o 4"55"4 30’8 38"6
CONNACtlT 1,72o’9 4"I 31"3 41’6 Cavan 295"3 5’I 25"1 32’0 Donegal 368"7 3"2 37"2 47"8 Monaghan 287"i 6"0 22’4 29"2
ULSTER 951"1 4"3 28"9
(part) 37"3
TOTAL 14,635"4 5"2 35’I 38"6
Source : Irish County Incomes in I96o. Returns of Local Taxation, I959/6o.
figures as set out in Table I are a good deal more reliable than rateable value calculations based on a valuation carried out over a hundred years ago--and that imperfectly,s (It is readily admitted that some errors of detail crept into the Preliminary
Survey through my accepting too readily rateable
value per capita figures as useful indicators of the relative wealth of the counties.)
But in the context of Local Government finance what is particularly important is this. If the rateable value figures are misleading as a measure of the area’s ability to pay, then the rate poundages are also misleading. A low rate poundage in Meath, for example, does not necessarily mean that the rate payers of Meath are being treated particularly
SSome of the information deployed in Table 12 of ERI Paper x6 is very relevant in this connection. Col. ii of that Table shows that income in agriculture per £ valuation in many of the poorer counties is well above average ; Kerry, Mayo, Galway, Cork and Donegal having the highest ratios of income in agriculture per £ valuation in the State.
4
generously for--as we have seen--rateable values in Meath are very high in comparison to incomes and a relatively low rate poundage may mean a relatively high burden with respect to incomes. Similarly, in the case of those counties which have a high ratio of income to rateable value, a high rate poundage does not necessarily mean that the rate payers in those areas are being treated harshly and are being asked to bear a heavier¯ burden than rate payers in areas where the rate poundage is particularly low. This applies particularly to the case of counties such as Kerry, Donegal and Mayoq and to a lesser extent to Galway. It is not sufficient --because of the fact that they have this high ratio
of incomes to rateable values, i.e., their rateable values are very low in proportion to their " wealth" --to point to their high rate poundages ; this is not in itself evidence of a high rate burden. To assess the burden of rates it is necessary-even in a comparison purporting to be a broad and overall one--to link rate payments to incomes and not only to rateable values. It is also necessary to take into account the expenditure benefits that are being derived from the rate payments. This type of comparison will be attempted later in the paper. Before proceeding to look in a little detail at comparisons of rate payments with respect to incomes, it is desirable to indicate the levels of expenditures obtaining in the various counties. (Following the practice of the Preliminary Survey, differences in per capita expenditure will be taken as indicating, in a very broad way, differences in the quantity and quality of the services available to the inhabitants of the various counties.°)
Table 3 sets out on the general basis used in this paper1° the expenditures of Local Authorities in the various counties. The table illustrates the claim that was made in the Preliminary Survey to the effect that "the level of Local Government services provided varies widely across the State ,,.11 The differences between counties are substantial. This may be illustrated as foUows. In order to bring the level of expenditure in Mayo--the county with the lowest per capita expenditure--up to the average for the State as a whole the amount of rates collected¯ if all the money was to come from this
°Preliminary Survey, page 28.
x°i.e., the statistics for all the Local Authorities in the various counties are grouped.
nI am here making the same assumption as was made in
Pre-liminary Survey (p. 28) that Statistics of per capita expenditure
may be taken as a reasonably satisfactory indicator of the level and quality of the Services provided. It has also to be recognised that average figures for counties may conceal substantial differences as between particular Services and as between particular parts of a county; this latter point is of special importance for, as stated in the Text, the county areas we are here considering include in a substantial number of
ridABLE 3 : LOCAL AUTHORITY EXPENDITURE AND COUNTY INCOMES
Total Expendi- Expendi- Expendi-Local ture ture ture County Authority per capita as % of as % of
expendi- income personal ture arising income
I 2 3 4 5
Carlow Dublin Kildaro Kilkenny Laoighis Long ford Louth Meath Offaly Westmeath Wexford Wicklow £000 581 14,785 I,I47 I,I83 824 632 1,263 1,262 891 I,O75 1,302 I~IO8 £ 17"4 20"7 17’7 19"o 18"1 20"3 18"7 19"3 17"3 20"3 15"5 18’9 IO’I 8"o 9"Z lO"8 II’O 17’5 I0"I II’I lO’6 13"2 lO"4 12"0 8’I 9"o 7"8 8"7 8"9 11"9 10"4 8"7 8"6 9"9 8"4 9’3 LEINSTER 26,053 19"6 9"1 9"0
17"5 18"4 14"7 18"5 18"7 20’6 1,304 6,098 1,727 2,477 2,333 1,483 13"6 I0"0 10"8 lO’7 I I’0 I I’O Clare Cork Kerry Limerick Tipperary Water£ord lO’5 9"3 8"4 9"o 8"8 9"4
MUNSTER 15,422 18"1 10’7 9"2
Galway 2,6o3 17"2 12"7 9’7 Leitrinx 61o 17"8 14"9 lO"7 Mayo 1,642 13"I I i’6 8"6 Roscommon i,i46 19"1 14"9 11"2 Sligo 879 16"2 i i "7 9"3
CONNACHT 6,880 16"2 12’8 9’6
Cavan 1,o59 18"4 14"3 I I’2 Donegal 1,723 14"9 I2"6 9"8 Monaghan 91o 18"9 14’1 lO’8
ULSTER 3,692 I6"7 I3"4 IO"4 (part)
TOTAL 52,047 18"4 io’i 9"2
Source : As in Table 2.
source---would have to double, and in the cases of Kerry and Donegal there would have to be increases of about 7° %. If, on the other hand, the additional revenue was to be provided by grants, there would be need for an increase of about 65 % in the case of Mayo, 45% in the case of Kerry and about 39% in the case of Donegal.
In the Preliminary Survey it was suggested that low levels of per capita expenditure might well be associated with counties being poor. There does seem to be some evidence in support of this view but it is not completely conclusive. Table 3 shows that there are four counties with very low expendi-ture figures : Donegal, Mayo, Kerry and Wexford. All these four counties were in our group of relatively poor counties derived from Table i, mid Mayo and Donegal were amongst the very poorest. Moreover, the next four counties from the point of view of expenditure per capita also fall within the " relatively poor " group, i.e., Sligo, Galway,
Leitrim and Clare. The other four "poor " counties all have expenditure figures equal to the average or above. Of these, Cavan’s position is about average and Monaghan, Roscommon and Longford are above. It will be noted also that there are three other counties with expenditure per
capita figures below the average, namely Carlow,
Kildare and Offaly and, of course, these counties have got incomeper capita figures above the average. It will be clear, therefore, that though no exact statement caa be made relating per capita expendi-ture figures to per capita income figures, there is some indication that the poorer counties do have low expenditure figures and this is certainly the case with respect to the poorest counties.
The final columns of Table 3 show the relation-ship of expenditure in the various counties to income arising and personal income. On the whole it will be noted that the poorer counties tend to have a somewhat higher ratio of expenditure with respect to personal income than the State as a whole. Whereas the national average is 9.2, the average for the Ulster counties is lO.4 and for Connacht 9.6, and though Kerry and Wexford have ratios of 8.4, Clare has a ratio of lO.5 and Longford ii.9. There are, however, a nunlber of relatively poor counties with low ratios, notably Mayo with 8.6 and Kerry and Wexford as already noted. On the other hand the ratios of Longford at 11.9 and Roscommon at 11"2 seem particularly high. It would be wrong to try and attempt an explanation of these differences at this stage before we have discussed the burden of rates with respect to income. But the following observations are relevant :
I. Oll the whole one would expect the ratio of expenditure to personal income to be higher in the poorer counties as political pressures would tend to make them wish to have the same sort of services as the better-off counties and this would tend to force up the ratio of expenditures to incomes. For the most part this seems to have happened and though levels of expenditure per capita have not reached those of the better-off counties it is clear that in many cases levels of expenditure with respect to incomes have. On the other hand, it is clear that Mayo, Kerry and Wexford have not had their expenditure levels pushed up to an extent sufficient to bring their ratios into line with the State average.
2. Longford and, to a lesser extent, Roscommon provide examples of the opposite effect happen-ing. Though both are relatively poor counties their expenditure per capita has been pushed up above the average, thus producing a very
high ratio of expenditure to personal income --and, as we shall see, a high burden of taxation. Cavan and Monaghan are in a similar position.
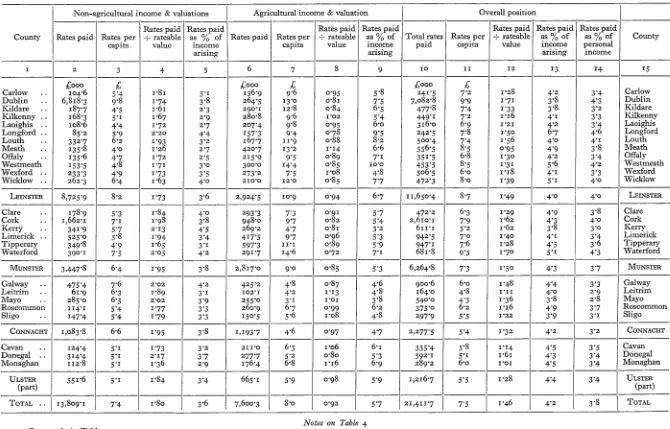
3. In the Preliminary Survey there was a good deal of discussion concerning the importance of the relative wealth of the various Local Authority areas in connection with Local Authority finance and it was suggested that unless there were deliberate attempts by the Central Government by way of a system of equalisation grants" there would be a tendency for there to be a lower level of services in the poorer areas with the same level of taxation--or the same level of services with a higher level of taxation--or a combination of these two extremes, namely the existence in the poorer areas of both a somewhat lower level of services and a higher level of taxation than in the better-off areas." We have noted in our discussion of Table 3 that there is some sign of this happening on the expenditure side. To get a complete picture we must examine the income side as well. To this we now turn. In Table 4 an attempt is made to assess the burden of rates on the two main categories of rate payer in the various counties. The statistical material there set out is somewhat confusing and it is not easy at a glance to pick out the main points. It is believed, however, that the following general conclusions emerge.
Taking first the overall position set out in Table 4, it is clear that on the whole rates paid per capita are a good deal lower in the poorer counties than in the State as a whole, Longford being the only one of the twelve " relatively poor " counties with
a per capita rate burden (in this sense) above the
average for the State. The three poorest counties (on the personal income criterion), Mayo; Donegal and Leitrim, have low rate burdens per capita at £4"3, £5"1 and £4.8 respectively in comparison with the average for the State of £7"5. These burdens are in contrast to the appearance given by the rate poundage figures, these counties having rate poimdages well in excess of the national average.
It has, however, already been made clear that any proper measure of the rateburden must be related to incomes; and before accepting the implications of the previous paragraph it is necessary to examine the relationship of county rate payments to county incomes. This is done in Table 4. The Table shows that the average rate burden with respect to personal incomes is 3"8 %. In the Ulster counties it is 3’4%, in Connacht 3"2%, in Kerry 3.o%. in Clare 3.8%, in Wexford 3"3% and in
Longford 4.6%. Of the twelve relatively poor 6
counties only Longford has a rate burden with respect to income in excess of the State average though both Clare and Roscommon have per-centages equal or almost equal to the State average. The poorest counties of Donegal, Mayo and Leitrim are all below the average. Though it would be wrong to make too much of these lower ratios, for the differences are not substantial, the negative point may well be taken as established, i.e., that there is little evidence to suggest that, in the broad, the poorer counties pay a higher proportion of their incomes in rates. It is desired to emphasise this point because in the Preliminary Survey there was the suggestion that the opposite was the case.
When considering this conclusion it is important not to ignore the fact that the level of expenditure in some of the poorer counties is below the national average. The implication of this is that though the burden of rates with respect to income is broadly similar, the citizens in these counties may be obtaining--with this similar burden--services of a lower standard,lz It also follows that if they were to obtain services of the same standard the burden of rates with respect to income would have to be higher and would then exceed that of the other counties in the State. This point is considered further below.
Table 4 also shows the payments of rates with respect to agricultural land and in relation to the agricultural population. It will be clear that rates paid per capita are below the State average in the poorer counties and that, for the most part, the rate burden expressed as a percentage of income arising in agriculture is a higher proportion of income in the richer than in the poorer counties, though it will be noted that Roscommon, Monaghan and--especially--Longford, have high rate burdens with respect to income. It will also be noted that Mayo and Kerry have particularly low burdens. It is believed that in very broad terms the same (negative) conclusion we reached concerning the overall position applies with respect to the burden of rates on agricultural land. It should perhaps be added that the figures tend to underestimate the burden on agriculture, for the rates falling on the buildings used by the agricultural population are not taken into account? ~ The rate figures given are those with respect to agricultural land valuations whereas the agricultural population figures and the agricultural income figures represent rather larger entities.
Table 4 also shows the burden of rates on the 12Again, it is assumed that levels of expenditure indicate the standard of Services being provided.
TABLE 4: THE INCIDENCE OF RATES
Non-agricultural income & valuations Agricultural income & valuation Overall position
i Rates paid Rates paid Rates paid Rates paid Rates paid Rates paid Rates paid
County Rates paid Rates per :-- rateable as % of Rates paid Rates per + rateable as % of Total rates Rates per --rateable as ~o of as % of County capita value income capita value income paid capita value income personal
arising arising arising income
i 2 3 4 5 6 7 8 9 IO II 12 13 I4 15
£ooo £ £ooo £ £ooo £
Carlow .. IO4"6 5"4 I "81 3.1 136"9 9"6 0"95 5"8 241"5 7"2 I’28 4"2 3"4 Carlow Dublin .. 6,818"3 9"8 i "74 3"8 264"5 13"o o"81 7"5 7,082"8 9"9 1"71 3"8 4"3 Dublin Kildare .. I87"7 4"5 i "6i 2"3 29o"1 12"8 o’84 6"5 477"8 7"4 1"33 3"8 3"2 Kildare Kilkenny .. 168"3 5"1 i "67 2"9 280"8 9"6 I "O2 5"4 449" I 7"2 1"16 4"1 3"3 Kilkenny Laoighis .. lO8"6 4"4 I "72 2"7 2o7"4 9"8 0"95 6"0 316"o 6"9 i "21 4"2 3"4 Laoighis Long’ford .. 85 "2 5"9 2"20 4"4 157"3 9"4 o’78 9"5 242"5 7"8 i’5o 6"7 4"6 Longford
Louth .. 332"7 6"2 1"93 3"2 I67"7 II’9 o’88 8"2 500"4 7"4 i’56 4"0 4"1 Louth Meath .. 135"8 4"o I’26 2"7 420 "7 13"2 1"14 6"6 556"5 8"5 0"95 4"9 3"8 Meath Offaly .. 135"6 4"7 I "72 2"5 215"9 9"5 o’89 7.1 351"5 6"8 I’3O 4"2 3"4 Offaly Westmeath 153"5 4"8 1"7I 3"0 3oo’o 14"4 0"85 I0"0 453 "5 8"5 1"31 5"6 4"2 Westmeath Wexford .. 233"3 4"9 I "73 3"5 273"2 7"5 i’o8 4"8 506"5 6"0 I’18 4"I 3"3 Wexford Wie!dow .. 262"3 6"4 I "63 4"0 210"O 12"0 0"85 7"7 472"3 8"0 1"39 5"1 4"0 Wicldow LEINSTER 8,725 "9 8"2 I’73 3"6 2,924"5 lO"9 o’94 6"7 11,65o"4 8"7 I "49 4"0 4"0 LEINSTER
Clare .. 178"9 5"3 ! "84 4"0 293"3 7"3 O"91 5"7 472"2 6"3 I "29 4"9 3"8 Clare Cork .. 1,662"1 7-1 I "98 3"8 948"0 9"7 0"82 5"4 2,610"1 7"9 I’62 4"3 4"0 Cork Kerry .. 341"9 5"7 2"13 4"5 269"2 4"7 o-8i 3"2 611"1 5"2 i "62 3"8 3"0 Kerry Limerick .. 525"0 5"8 I "94 3"4 417"5 9"7 0"96 5"3 942"5 7"0 1 "4o 4"1 3"4 Limerick Tipperary 349"8 4"9 I "65 3"I 597"3 II’I o’89 5"9 947"1 7"6 i’28 4"5 3"6 Tipperary Water£ord 39o’i 7"5 2 "O5 4"2 29i"7 14"6 0"72 7-1 681"8 9"5 I "7o 5"1 4"3 Waterford MUNSTER 3,447"8 6"4 I "95 3"8 2,817"o 9"0 0"85 5"3 6,264"8 7"3 I "5o 4"3 3"7 MUNSTER Galway .. 475"4 7"6 2 "02 4"2 425"2 4"8 0"87 4"6 900"6 6"0 1 "48 4"4 3"3 Galway Leiwim .. 61"9 6"3 I "89 3"1 102"1 4"2 I’I3 4"8 164"o 4"8 I’II 4-o 2"9 Leitrim Mayo .. 285"0 6"5 :2 "02 3"9 255"0 3"1 I’01 3"8 540"0 4"3 I’36 3"8 2"8 Mayo Roscommon 114"1 5"4 I "77 3"3 260"9 6"7 0"99 6"2 375"o 6"2 1"I6 4"9 3"7 Roscommon Sligo ¯. 147"4 5"4 I "79 3"3 15o"5 5"6 i "o8 4"8 297"9 5"5 I "22 3"9 3"1 Sligo
CONqqACHT 1,o83"8 6"6 I’95 3"8 I,I93"7 4"6 0"97 4"7 2,277"5 5"4 I "32 4"2 3"2 CONNACHT
Cavan .. I24"4 5"i I’73 3"2 2II’O 6"3 I "06 6"i 335"4 5"8 I’I4 4"5 3"5 Cavan Donegal .. 314"4 5"1 2"17 3"7 277"7 5"2 0"80 5"3 592"I 5"I I"6I 4"3 3"4 Donegal Monaghan II2"8 5"t 1"36 2"9 176"4 6"8 i"16 6"9 289"2 6"0 I’01 4"5 3"4 Monaghan
ULSTER 55I’6 5"i 1 "84 3"4 665"I 5"9 0"98 5"9 1,216"7 5"5 I’28 4"4 3"4 ULSTER
(part) (part)
TOTAL .. 13,809"1 7"4 I’80 3"6 7,600"3 8"0 0"92 5"7 21,41I"7 7"5 I "46 4"2 [ 3 "8 TOTAL
Notes on Table 4 I. Source : As in Table 2.
2. In order to determine the per capita figures in agriculture and the rest of the economy, the population figures had to be broken down as between these two sectors. This was done in the way outlined in the Notes on Table I.
non-agricultural sector. It will be noted that though the per capita rate burdens of the poorer counties are below those of the average of the State the average itself is, in this case, somewhat mis-leading because the Dublin figure is so much higher than the rest. Column 5 indicates the rate burden in relation to the income arising in the non-agricultural sector. Though the average for the State is 3.6%, a number of the poorer counties have higher figures, e.g., Kerry with 4"5 %, Galway 4"2%, Longford 4"4% and Mayo 3"9%. When it is appreciated that the level of expenditure in three of these counties is below that for the average of the State the figures suggest that, relatively, the non-agricultural rate payer is being taxed somewhat severely in these cases.
In the Prelimhlary Survey reference was made to the fact that the burden of rates with respect to income seemed to be a good deal higher in the agricultural than in the non-agricultural sector of the economy. A comparison of columns 5 and 9 of Table 4 illustrates this phenomenon county by county. It will be noted that for the State as a whole the burden of rates with respect to non-agricultural factor income was 3.6% whereas with respect to agricultural income it was 5"7%. There are very few counties in which this relationship does not hold, Kerry and Mayo being the only exceptions. And in the ease of some counties the additional burden with respect to agricultural income seems very heavy indeed. In noting this situation it should be remembered that Table I indicated that average incomes in the agricultural sector are a good deal below incomes in the non-agricultural sector. This implies that (average) lower incomes are bearing a higher rate burden. (It should also be recalled that part of the agricultural income here included is subsistence non-monetary income and that if the rate payments were related to money income the percentages would be much higher.14) The statistics relating to rates paid on agriculture do, of course, take account of the agricultural grant ; they are net payments. It follows that even with the large sums of money paid out by way of the agricultural grant amounting to over £5"5 million in i959/6o that the rate burden on agriculture was still higher than that on non-agriculture with respect to income and as we have seen--it does not serve either to bring about, generally, a lower burden of rates on agricultural income in the poorer counties, partic-ularly if one takes into account the lower level of expenditure.
lqt should be pointed out that all this analysis assumes is that the rate burden is in fact carried by the person who actually pays it, i.e., that the burden is not passed on to other members of the community in the form of higher prices, etc. In technical jargon we are concerned with the " formal " incidence and not the " effective" incidence of the rates.
8
[image:12.606.320.548.267.698.2]On a number of occasions in this section of the paper it has been stated that in comparing the rate burden with respect to income it is important to take notice of the level of services which is provided from the revenue that is raised. Clearly, if two counties were both raising the same percentage of income in rates but one county had a much lower level of expenditure per capita than the other then that county could be said to have a higher rate burden. It is not possible to take account of the yarious factors at work in a completely satisfactory way but in Table 5 some calculations are set out to illustrate one aspect of the situation. The absolute figures in the table do not really mean anything: what is important is the comparison of one county ratio with another and with the average for the
TABLE 51 RATE BURDENS (WITH RESPECT TO INCOMES) AND LOCAL AUTHORITY EXPENDITURE
BENEFITS
County
(Expenditure
per capita)
-- (total rates
as % of
personal income) (Expenditure per capita) -- (rates paid on agricultural land
as % of
agricultural income arising)
(Expenditure
per capita)
-- (other rates paid as ~/o of " other "
income arising) 3"0 2"8 2’7 3"5 3’0 2"I 2’3 2"9 2"4 2"o 3"2 2"5 5"1 4"8 5’5 5"8 5"3 4"4 4"6 5"I 5"1 4"8 4"7 4"7 Carlow Dublin Kildare Kilkenny Laoighis Long ford Louth Meath Offaly Westmeath Wexford Wicldow 5"6 5"4 7"7 6"6 6"7 4"6 5"8 7.r 6"9 6"8 4’4 4"7 LEINSTER 4"9 2"9 5 "4
Clare Cork Kerry Limerick Tipperary Waterford 4"6 4"6 4"9 5"4 5.2 4"8 3.i 3"4 4"6 3"5 3"2 2"9 4"4 4"8 3"3 5"4 6"0 4"9 MUNSTER 4’9 3"4 4"8
Galway 5"2 3"7 4"1 Leitrim 6"r 3"7 5"7 Mayo 4"7 3"4 3"4 Roscommon 5"2 3"I 5"8 Sligo 5"2 3 "4 4"9
CONNACHT 5"r 3"4 4"3 Cavan 5"3 3"o 5 "8 Donegal 4"4 z’8 4"o Monaghan 5 "6 2"7 6"5
ULSTER (part) 4"9 z’8 4’9
TOTAL 4"8 3"2 5"I
State as a whole. It will be noted that relating per
capita expenditure figures to the statistic rate
payments as a percentage of personal income, the resulting ratio for the State as a whole is 4.8. Counties with higher ratios than this are deemed to have a less than average " burden" from a Local Government finance point of view and those with lower ratios are deemed to have a greater burden. The value of the calculation is that it takes into account both the expenditure and the taxation side of the picture. The comparison should not, however, be pressed too hard as it is not altogether justifiable to divide into one another two such unlike entities and then compare the resulting figures. What seems to emerge, however, is this :
x. Column 2. The ratio for the State is 4.8. On
the whole the poorer counties have rather better ratios than this, e.g., Ulster and Kerry have ratios of 4.9 and Connacht 5.i. There are, however, several poorer counties with ratios below the State average and therefore with "worse" burdens, notably Donegal (4"4), Mayo (4’7), Clare (4.6), Wexford (4"7) and Longford (4"4). As an example of the meaning to be attached to these different ratios a word on the case of Mayo and Longford may be useful. It will be recalled that Mayo had both a very low per capita expenditure figure and a low figure of rates to personal income. The point of the present ratio is to indicate that when these two figures are brought together and compared with similar figures for the State as a whole Mayo’s " burden " is above the average. In the case of Longford it will be recalled that that county had a high per
capita expenditure figure and also a high
ratio of rates collected with respect to incomes. Bringing these two figures together and comparing them with the average for the State it would seem that the "burden" in Longford is also somewhat above the average for the State as a whole. It will be clear that it is important to take note both of expenditure and the rate burden for the concentration of attention upon one and not the other will give a misleading impression of the situation. Concentrating just on the rate burden in the case of Mayo would give the impression that her Local Authority financial "burden " was low and in the case of Longford was very high. " Correcting" these figures for the level of expenditure (which the revenue goes to finance) gives a more true picture of the situation.
2. Cohtmns 3 and 4. The horizontal comparison
county by county of the two final columns
brings out very clearly the heavier burden of rates with respect to agricultural income as compared with the rest of the economy. Reading each column vertically, comparisons between the individual county figures and the average for the State has the same meaning as was given to similar comparison with respect to colurml 2. With respect to agri-cultural income, the Kerry " burden " seems extremely low whereas those of Longford and Westmeath seem high. The final column reflects the point we made earlier about the relatively high burden of rates on non-agricultural income in a number of the poorer counties. The low ratios (i.e., high burdens) with respect to non-agricultural rate payers in Kerry, Mayo, Galway and Donegal are particularly significant. On the other hand the non-agricultural rate payers in Meath, Offaly, Kildare and a number of the other Leinster counties seem to get good "value for money "
In the Preliminary Survey the view was put forward based on the material which was then under review that there was little evidence to suggest that the allocation or flow of Central Government grants was such as to aid particularly the poorer rather than the richer areas15 and it was suggested16 that earnest consideration should be given to the need for the introduction of some sort of equali-sation grant structure which would be directed so as to provide greater support to the poorer counties. In this section these matters are considered again in the light of the income figures now available.
In Table 6 a good deal of information relating to grants and the relationship between the grants to particular counties and the incomes of those counties is set out. We shall follow the same method with Table 6 as was followed with Table 4, i.e., the parts will be considered one by one.
The aggregate position is by no means easy to interpret. To a substantial extent the low level of grants to Dublin tends to distort the appearance of the Table. In the broad, however, the table suggests that the poorer counties do receive greater support from the State than the relatively well-off ones. Whereas the average per capita grant for the State is £8.o--and for Dublin, by far the richest county, £5.4--the average for Ulster is £9"7 and for Connacht £9"5, and though Kerry only obtains £8.2 and Wexford £7.8, Clare and Longford each obtain £io.8. This position is reflected in the ratio total grants as a percentage of expenditure. Though the average for the State is
15Preliminary Survey, p. a9. lnlbid., P. 39.
TABLE 6: THE DISTRIBUTION OF GRANTS
Grants : the aggregate position The agricultural grant Grants other than the agricultural grant
Total as Total as Total as As%of As % of As % of
of Local .% of % of income net rates As % of " other" As % of County Total Per capita Authority Income personal Total Per capita arising paid on Total Per capita Local income p.ersonal expenditure arising income in agricultura] Authority arising income
agriculture land
I 2 3 4 5 6 7 8 9 IO iI i2 13 I4 15
£000 £ £ooo £ £ooo £
Carlow . ¯ 274 8"2 47 "2 4"8 3"8 8i’5 5"7 3"6 59"5 192"5 5"8 3"3 3"4 2"7 Dublin ¯ ¯ 3,844 5"4 26"o 2"1 2"3 lO4"1 5"1 3"0 39"3 3,739"9 5"2 2"5 2"0 2"3 Kildare .. 59° 9"1 51"4 4"7 4"0 137"1 6"0 3"1 47"2 452"9 7"0 3"9 3"6 3"I Kilkenny .. 589 9"5 49"8 5"4 4"3 175"o 6"0 3"3 62 "3 414"o 6"7 3"5 3"8 3"0 Laoighis .. 439 9"7 53 "3 5"9 4"7 139"8 6"6 4"0 67 "4 299"2 6"6 3"6 4-o 3"2
Longford ¯ ¯ 80"3 209 "7 6"7 5"8 4"0
336 1o"8 53"2 9"3 6"3 126"3 7"6 7"6 3"3
Louth .. 494 7"3 39"I 3"9 4"i 99"7 7"1 4"9 59"4 394"3 5"8 3.1 3"I 3"2 Meath .. 668 10"2 52"9 5"9 4"6 194"5 6"1 3"0 46 "2 473 "5 7"2 3"7 4-2 3"3 Offaly .. 436 8"4 48"9 5"2 4-2 147"o 6"5 4"8 68"1 289"o 5"6 3"2 3"4 2"8 Westmeath .. 492 9"3 45 "8 6"0 4"5 148"5 7"1 4"9 49"5 343"5 6"5 3"2 4"2 3"2 Wexford .. 657 7"8 5o’5 5"3 4"2 208"4 5"7 3"7 76"3 448 "6 5"3 3"4 3"6 2"9 Wicklow .. 53o 9"O 47"8 5"7 4"4 lO9"5 6"2 4"o 52"I 420"5 7"2 3"8 4"5 3"5
LEINSTER . . 9,349 7"0 35"9 3"2 3"2 1,671"4 6"2 3"8 57"I 7,677"6 5"8 2"9 2"7 2"6
Clare .. 8o2 lO"8 61"5 8"3 6"4 239"8 5"9 4"6 81"7 562"2 7"6 4"3 5"8 4"5 Cork .. 2,74o 8"3 44-’9 4"5 4"2 637"2 6"5 3"6 67 "2 2, IO2"8 6"3 3"4 3"5 3"2 Kerry .. 960 8"2 55"6 6"0 4"7 285"1 5-0 3"4 lO5"9 674"9 5"7 3"9 4"2 3"3 Limerick .. I,OO3 7"5 40"5 4"3 3"7 248"4 5"8 3"2 59"5 754"6 5"6 3-o 3"3 2"8 Tipperary .. I~IIl 8"9 47-6 5"2 4"2 352"5 6"6 3"5 59"o 758"5 6"1 3"2 3"6 2"9 Waterford .. 662 9"2 44"6 4"9 4"2 138"6 6"9 3"4 47"5 523 "4 7"3 3"5 3"9 3"3 iV~UNSTER . . 7,278 8"5 47 "2 5"o 4"3 1,9oi"6 6"1 3"6 67"5 5,376"4 6"3 3"5 3"7 3"2
Galway .. 1,420 9"4 54"6 6"9 5"3 455"6 5-i 5-0 107"I 964"4 6"4 3"7 4"7 3"6 Leitrim .. 4II 12"O 67 "4 IO’O 7"2 131"7 5"4 6"2 129"o 279"3 8"2 4"6 6"8 4"9 Mayo .. 1,o16 8"1 61"9 7"2 5"3 323 "3 4-o 4"8 126"8 692"7 5"5 4"2 4"9 3"6 Roscommon.. 643 10"7 56"1 8"4 6"3 252"0 6.4 6"0 96"6 391"o 6"5 3"4 5-i 3"8 Sligo .. 524 9"7 59"6 6"9 5"5 160"1 6"o 5.1 lO6"4 363 "9 6"7 4"i 4"8 3"8
CONNACHT 4,o14 9"5 58"3 7"4 5"6 1,322"7 5"I 5"2 IIO’8 2,691"3 6"3 3"9 5"0 3"8
CavRtl . . 630 lO"9 59"5 8"5 6"7 224-8 6"8 6"5 io6"5 405 "2 7.0 3"8 5"5 4"3 Donegal .. I,O40 9"0 60"4 7"6 5"9 262"1 4"9 5"o 94"4 777"9 6"7 4"5 5"7 4"4 Monaghan .. 485 IO’I 53"3 7"5 5"8 168"1 6"5 6"5 95"3 316"9 6"6 3"5 4"9 3-8
ULSTER (part) 2,155 9"7 58"4 7"8 6"1 655"0 5"8 5"8 98 "5 1,500"0 6"8 4"I 5"4 4.2
43’8, Ulster and Connacht are able to finance around 58.4% of their expenditure by grants, Kerry 55.6, Clare 61.5, Wexford 5o.5 and Longford 53"2. Similarly an examination of column 6 suggests that the ratio grants as a percentage of personal income tend to be higher in the poorer areas. On the other hand it is clear that there are a number of the poorest counties in the State not obtaining heavy grant support, notable cases being Mayo, Kerry and Wexford. The fact that they are able to finance a high proportion of their expenditure by grants but confirms the fact that their level of expenditure is low l And, similarly, though their ratio of grants to personal income is above the average this should be interpreted as a reflection of their low personal incomes and not of their high grants !
Columns 7 to io are concerned with the role of the agricultural grant. In the Preliminary Survey a good deal of attention was given to the agricultural grant and it was suggested that though it was often thought of as a device to assist the poorer farmers and the poorer parts of the State, it was by no means certain that it did operate in that way.1~ The figures set out in Table 6 to some extent support that judgment. Though it is true that the agri-cultural grant is a much higher percentage of the net rates paid in the poorer counties and is a higher percentage--on the whole--of agricultural income, nevertheless the per capita grant in the poorer counties is less than in the State as a whole and some of the poorest counties get very low per capita support. In terms of measuring the extent to which the agricultural grant particularly helps the poorer counties it is believed that the per capita figures are perhaps the most significant and in this con-nection the low per capita grants to such counties as Mayo, Donegal and Kerry are significant. It will be noted, however, that some of the poorer counties do receive fairly substantial help, notably Longford, Cavan, Roscommon and Monaghan.
Columns I I to 15 set out the position with respect to " other grants ", i.e., total grants minus the agricultural grant. The broad picture here is not dissimilar to the aggregate position we noted earlier. On the whole the poorer counties receive
per capita grants greater than the average for the
State as a whole; the grants finance a higher proportion of their expenditures; and the grants are a higher proportion of their incomes.
l~It is appreciated that the Agricultural Grant is designed to assist the poorer farmers and the poorer parts of the State. There is no doubt that within a county area it does assist the poorer farmer--or at any rate those who have farms with lower valuations. What was disputed in the Prelinffnary Survey (and is also disputed in the present Paper) is the extent to which the very large sums of money paid out by way of the Agri-cultural Grant enables counties with large numbers of small farmers to support levels of expenditure which richer counties can afford.
The main point on grants is this. Though, as measured in a number of ways, the poorer counties seem to receive greater support from the State than the better-off ones, the fact remains that their level of expenditure is less than the better-off counties. The higher support from the State is not sufficient to enable them, without increasing their rate burdens, to obtain the same level of services. It might be argued that the figures reveal that there is an element of redistribution in the State grant system. This would be admitted. But it could not be argued that the flow of State grants goes any
substantial way to offset the disparities in income/
wealth indicated earlier in the paper.
This paper has been entirely concerned with applying to the Local Government finance scene some of the results of the Institute’s research recorded in the county incomes paper. This research has enabled certain parts of the field discussed in the Preliminary Survey to be reviewed,is From time to time in the present paper instances where the new evidence has suggested changes in the interpretations which were given on the basis of the then existing evidence in the Preli~hinary Survey have been pointed out. These have not been serious and are with respect to points 3 and 5 mentioned on the first page of the paper.
Taking point 5 first, the new material has enabled a rather clearer picture to be presented. It is now suggested that some, though not all, of the poorer counties obtained (in i959/6o) in comparison with other (better-off) counties an inadequate amount of State support. There may be many reasons for this but the fact seems clear. It is doubtful if equity arguments could defend the range of grants made available to--say--Kerry, Mayo or Wexford, even though these grants were a high proportion of incomes and expenditure; for both incomes and expenditure were low in comparison to the State as a whole.
Concerning point 3, it is thought that it was too simple a way to put the matter. With the assistance of the income figure it is now possible to measure in a rough sort of way the average burden of rates on tile two main sectors of the economy. What is now suggested is this. In some of the areas where the level of services is low the burden of the rates on the non-agricultural rate payer is higher than in areas where the level of services is better. To take the extreme cases, in Mayo, Kerry and
Donegal--18It should, perhaps, be emphasised that it is only certain parts--in particular the material covered on pp. 27-3o--which have been re-examined. This is important. The writer wishes to emphasise that all the criticisms concerning the valuation system, the agricultural grant and the general imperfections of the local rate as a tax when it is used to raise large sums of money which were made in the Preliminary
Survey still stand and are in no sense affected by the material
in the present paper.
counties with low expenditures per capita--the percentage of rates paid with respect to " other " domestic income are all above or equal to the average for the State, being 3’9 in the case of Mayo, 4"5 in Kerry and 3’7 in Donegal, compared with a State average of 3.6.
On the whole the new material supports the relevant conclusions of the Preliminary Survey. There are considerable differences in the average income or wealth of the various counties and this--as argued in that paper--hthis--as important implications when Local Authorities are being asked to provide certain very important services by the State. Quite striking was the relationship between incomes and rateable values which were set out in Table 2. Clearly, rateable value per capita is not a particularly good indicator of the relative wealth of a county and this carries important implications for the meaning of rate poundage statistics. We noted that expenditure per capita varied considerably across the State and that on the whole those counties with poor per capita expenditure figures were the relatively poor counties. Concerning the burden of rates (and leaving on one side the point about the
burden on non-agricultural incomes to which we have just made reference) the point which requires emphasis is that though the burden with respect to personal incomes is roughly similar across the State, some of the poorer counties are getting a lower level of service for the same burden of taxation. We also noted that though there was some evidence that the poorer counties did receive--on the whole--rather more support from the State by way of grants from the better-off counties, there were a number of
important exceptions to that generalisation. The final point it is desired to emphasise is one that was given emphasis in the Preliminary Survey.
THE ECONOMIC RESEARCH INSTITUTE Pubfieation Series :
1. T/re Ownership of Personal Property in Ireland
Edward Nevin
2. Short Term Economic Forecasting and its Application in Ireland
Alfred Kuehn
3. The Irish Tariff and The E.E.C.: A Factual Survey
Edward Nevin
4. Demand Relationships for Ireland
C. E. V. Leser
5. Local Government Finance in Ireland: A Preliminary Survey
David Walker
6. Prospects of the Irish Economy in 1962
Alfred Kuehn
7. The Irish Woollen and Worsted Industry, 1946-59 : A Study in Statistical Method R.C. Geary 8. The Allocation of Public Funds for Social Development
David Walker
9. The Irish Price Level: A Comparative Study
Edward Nevin 10. hdand Transport in Ireland : A Factual Survey
D. J. Reynolds" 11. Public Debt and Economic Development
12. Wages in Ireland, 1946-62
Edward Nevin
Edward Nevin 13. Road Transport: The Problems and Prospects in Ireland
D. J. Reynolds 14. Imports and Economic Gt:owth in Ireland, 1947-61
C. E. V. Leser 15. The Irish Economy in 1962 and 1963
C. E. V. Leser
16. Irish County Incomes in 1960.
E. A. Attwood and R. C. Geary 17. The Capital Stock of Irish Industry.
Edward Nevin 18. Local Government Finance and County Incomes
David Walker
Reprint Series :
1. Commentary on "Europe’s Future in Figures"