[ 3 8 8 ]
COUNTING SPERMATOZOA
BY LORD ROTHSCHILD
From the Department of Zoology, University of Cambridge, and the Marine Station, Millport
(Received 13 July 1949)
(With Three Text-figures)
INTRODUCTION
The study of fertilization and spermatozoa often requires a knowledge of the number of spermatozoa in an experiment. Several ways are available of counting spermatozoa or of assigning a number, related to sperm density, to a suspension. The most obvious of these are:
(1) Haemocytometer counts. This is a tedious and time-consuming method. The delay involved in making a count precludes the possibility of making up suspensions of known concentration before an experiment, unless another and quicker method of estimating sperm density is used as well.
(2) Estimation of total nitrogen. This method, used by Gray (1928), has some of the disadvantages of (1) and is not accurate, because the seminal plasma of sea-urchin semen contains protein which contributes to the total nitrogen measured. At the same time the proportions of spermatozoa and seminal plasma vary in different samples of semen. Information on this latter point is given later.
(3) Weighing dried semen. This method is not suitable for rapid standardization. Apart from the question of its accuracy, it suffers from some of the defects referred to in (2).
(4) Visual comparison with standard opacity tubes. This method is used in field experiments involving mammalian spermatozoa (Salisbury, Beck, Elliott & Willett, 1943). It is less suitable for sea-urchin spermatozoa where different species may have different light-absorbing and light-scattering properties.
(5) Electrical resistance of sperm suspension. So far as is known, the possibility that the electrical resistance of a suspension may vary with the concentration of sperma-tozoa has not been examined. Even if a relationship does exist between sperm density and resistance, the method requires special apparatus in the form of an alternating-current bridge and electrodes. If, in the future, the electrical method of measuring mammalian sperm activity (Rothschild, 1948) is found to be of value, the possibility of counting spermatozoa by this means might be explored, as the same apparatus would be used both for measuring sperm activity and counting them.
(6) Absorptiometric measurement of opacity. T h e application of this method to suspensions of sea-urchin spermatozoa is the main subject of this paper. Salisbury
et al. (1943) compared the haemocytometric and nephelometric methods of estimating
Counting spermatozoa 389
mammalian spermatozoa are carried out on washed spermatozoa, i.e. spermatozoa which have been centrifuged and re-suspended in some form of Ringer solution, the supernatant seminal plasma having been removed. Some investigations have been carried out on washed sea-urchin spermatozoa (Barron, Seegmiller, Mendes & Narahara, 1948), but in view of the difficulties encountered in re-suspending centri-fuged sea-urchin spermatozoa satisfactorily, it would be unwise to assume that the concentrations of sperm in samples examined before and after centrifugation followed by ' re-suspension' to the same volume, are necessarily the same. Furthermore, it must be shown that a solution such as sea water or Ringer phosphate has similar light-absorbing properties to seminal plasma, or that the effect of spermatozoa in preventing light impinging on the photocell is large compared with the effect of seminal plasma.MATERIAL
Unwashed and washed spermatozoa of Echinus esculentus.
METHOD
Haemocytometer counts. Fuchs-Rosenthal haemocytometer; depth of chamber,
200ju.. The semen or sperm suspension was diluted 25,000 times, formalin being added to kill the spermatozoa. Sperm counts on four randomly selected millimetre squares (each divided into sixteen subsquares), were made in each experiment. The total number of spermatozoa counted was 600-1000.
Photoelectric absorptiometer. Spekker (A. Hilger, Ltd.) with niters H503 and
H608. The former is a 'Calorex' heat filter, the latter Ilford's 'Spectrum Red'. The cells were 1 cm. long.
Centrifugation. Semen was centrifuged at 8000 r.p.m. in an angle centrifuge for
10 min. The procedure was repeated three times, the sperm being re-suspended each time in sea water.
RESULTS AND ANALYSIS
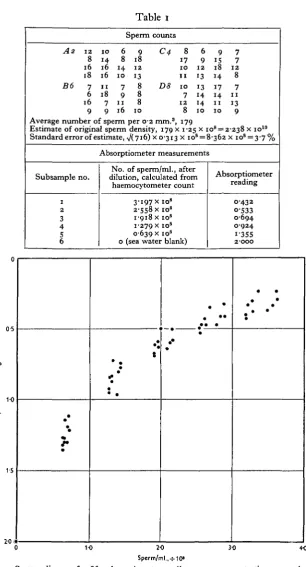
Comparison of haemocytometer and absorptiometer estimates. A typical experiment
is shown in Table 1. In this table, the letters A2, C4, B6 and D8 refer to particular square millimetres in the haemocytometer.
The experiment was repeated ten times, giving fifty comparisons of sperm con-centration in the absorptiometer cell and absorptiometer reading. The scatter diagram for these comparisons is shown in Fig. 1.
Denoting these fifty co-ordinates by x^y-^-x^y^, where x is the concentration of spermatozoa in the absorptiometer and y the absorptiometer reading, the logarith-mically linear curve which best fits the co-ordinates x^-x^y^, in the sense of least squares, when the error in x is great compared with that in y, is
y = 2e-x/P) p>o (z)
50
where p= -log10el=|o
i=l
Table i A2 B6 1 2 8 16 18 7 6 16 9 io 6 14 8 16 14 16 10 11 7 18 9 7 11 9 16
Average number of sperm Estimate of original sperm Standard error of estimate,
Subsample i 2 3 4 5 6 no. Sperm counts 9 C4 18 1 2 13 8 D8 8 8 1 0
per 0 2 mm.3, density, 179 x V(7i6)x 0-313 8 17 1 0 1 1 1 0 7 1 2 8 179 6 9 1 2 13 13 14 H 1 0
1-25 x 10 x 108 =
8-Absorptiometer measurements
No. of sperm/ml., dilution, calculated
after from haemocytometer count
0
3-197 x io8 2-558 x io8 1-918 x io8 1-279 x i°8 0639x io8
[sea water blank)
9 15 18 14 17 14 1 1 1 0 8 =
3 6 2
7 7 1 2 8 7 1 1 13 9
2-238 x io1 0 x i os = 3-7%
Absorptiometer
reacting
0-432 O-533 0-694 0 9 2 4 1-355 2-OOO 0-5 E 1-0 1-5 • • • • : e • • • • • • • • •• • • • • • • •
10 20 30 40
[image:3.451.74.381.51.619.2]Sperm/ml.,-j-IO8
Counting spermatozoa
39
11-0
0-75
y o-5
0-25
/
• • / • /
•
y
»• / •
•
* */
/
•
• •
••
[image:4.451.70.402.53.395.2]1-0 20 30 4-0
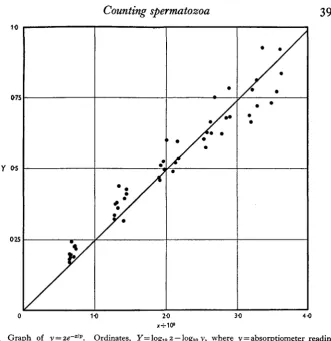
Fig. 2. Graph of y = 2e~xlv. Ordinates, Y = log10 2 — log10 y, where y = absorptiometer reading;
abscissae, x, the number of sperm/ml, in the absorptiometer; p is calculated from equ. (i"i). The individual points were obtained from the same data as those in Fig. i, with co-ordinates
Y, x instead of y, x.
Suppose that an unknown sample of semen contains N sperm/ml., and that it is diluted d times, giving an absorptiometer reading y'\ p is known from equ. ( I - I ) and x', the concentration of spermatozoa in the absorptiometer, can therefore be calculated, using equ. (i) in the form
x' = 2-3026 £(0-3010 - log10/). (1-2)
The estimate of the original concentration of spermatozoa in the sample is dx'/ml. The standard error of x' is
-,6
125 x ioe
= dx' ± 5590 *J(dx'). (2) This result can be expressed more accurately as follows:
dx'—1-645 (559o)'J(dx')^N^;dx'+1-645 (559°)V(^*')> confidence coefficient, 0-90; dx' — 1-960 ($59o)*J(dx')^N^dx' +1960 (s$9o)*J(dx'), confidence coefficient, 095; dx' —2-576 (s59o)*J(dx')^N^:dx' + 2-576 ($59o)J(dx'), confidence coefficient, 0-99.
392 LORD ROTHSCHILD
A rough test of the accuracy of the absorptiometric method of counting sperma-tozoa can be made by calculating the original sperm concentration from the five absorptiometer readings in Table i . Bearing in mind that the original semen con-tained 2-238 x io10 sperm/ml, and was diluted 70, 87-5, 116-7, X75> ana" 35° times for subsamples 1-5 respectively, the following estimates are obtained for the original sperm concentration: subsample 1, 1-885 xio1 0; subsample 2, 2-033 xio1 0; sub-sample 3, 2-170 x io10; subsample 4, 2-374 x io10; subsample 5, 2-395 x I Q 1° - The figures differ from the original haemocytometer estimate by the following per-centages: - 1 6 , - 9 , —3, + 6 and + 7 . Except in the case of subsample 1, the results are in reasonable agreement. Fig. 2 clearly shows the scatter in the low absorptio-meter reading range; in practice, the original suspension is diluted sufficiently, that is 200 times, for the reading to fall on the lower half of this curve.
10 20 30 40
Sperm/ml..-f 10"
Fig. 3. Comparison of optical properties of washed and unwashed spermatozoa of Echinus esculentus.
Counting spermatozoa 393
later). As the standard error of an estimate based on counting 950 spermatozoa is approximately ^^(950) ('Student', 1907), the accuracy of the absorptiometer is about ± 3 % .
Comparison of light-absorbing and light-scattering properties of washed and unwashed
semen. Fig. 3 is a comparison of the absorptiometer reading-sperm concentration
plot for semen diluted in the usual way (unwashed sperm) and washed spermatozoa. The latter were obtained by centrifuging the spermatozoa, pipetting off the seminal plasma and re-suspending the sperm in sea water, three times. The curves are identical, within the limits of experimental error. This is due to the effect of light-scattering and light absorption by the spermatozoa predominating over the effect of light-absorption by seminal plasma.
• Variations in number ofspermjml. in semen. Reference was made in the Introduction to variations in the number of sperm/ml, in samples of semen from different urchins. In ten samples selected at random the number of sperm/ml. 4- io10 were I-8I, 2-48, 2-58, 1-97, 2-89, 273, 2-23, 2-24, 2-30, 2-53. The maximum difference in these samples is 60 % . The density of semen was found to be about four times that of seminal plasma.
Weight of semen. Measurement of the dry weight of semen is markedly inferior to
absorptiometer measurements as a method of estimating the number of sperm in a sample. In view of the time taken to complete such measurements and the difficulty of disentangling the influence of sperm and seminal plasma, with their different densities, on the dry weight, this method of counting spermatozoa cannot be recommended.
ACCURACY OF THE ABSORPTIOMETER
In a single set of five readings, with different dilutions of the same suspension, the ratio of the concentrations will not be affected by errors in the haemocytometer count, assuming that dilution is carried out accurately. Errors due to this cause and to absorptiometer reading errors, including zero errors or non-linearity of the logarithmic readings, can be estimated by making comparisons within sets of five readings. If x is the true concentration and Y the logarithmic departure of the absorptiometer readings from 2, the five readings will give an estimate of the calibration constant
* = £(yiy> (3)
and this will minimize the sum of squares S(#-6Y)2, which on substitution of equ. (3) becomes
{S
*
F}2us
(4) For forty degrees of freedom within the ten sets of five readings, the minimized sum of squares is 1-0786, corresponding with a mean square 0-02697. The average value of b for the series is 1-7805 and the average value of S(F2) is 8-0849. The sampling variance of b is
^ y (S)
where V is the mean square residual.
394 LORD ROTHSCHILD
For true precision we require b~2V(b) which approximately equals (i-78)~2 x 0-02697 x (8-o849)~1 = (95o)-1, showing that the precision of b gives an estimate of x equivalent to making a count of about 950 spermatozoa. This applies to dilutions giving high absorptio-meter readings, which as mentioned earlier on, is done in practice.
Bull semen
Because of its practical importance, a similar analysis of nine samples of bull semen was carried out. The value of p (see equ. ( I - I ) ) was found to be 4-8520 x io7. The number of
spermatozoa JV per ml. of semen is given by the equation
^V=(335I5 x !09) (0-3010 -log10fl), (6)
where a = absorptiometer reading.
It is important to note that this equation only applies when the semen is diluted 30 times before being put into the absorptiometer, and when the absorptiometer is set to 2 for the blank with phosphate buffer, etc., in the cell. If another blank setting is used, for example m, log10m must be substituted for Iog102 in equs. ( I - I ) , (1-2) and (6). The accuracy of N in
equ. (6) is about ± i-6%. Equ. (6) was obtained from data relating to three bulls. If nine different bulls had been used, the estimate would probably have been somewhat less accurate. The experimental procedure may be summarized as follows:
(1) Set Spekker drum to 2-000 with Ringer phosphate in cell. (2) Dilute bull semen 30 times and put in cell in Spekker. (3) Obtain Spekker reading a, for example 0-90:
log10a = 1-9542 = - 0-0458. {0-3010 - log10a} = 0-3468.
(4) No. of sperm/ml, semen, 3-3515 x io9 x 0-3468 = 1-16 x io9.
SUMMARY
1. The number of spermatozoa in a sample of sea-urchin semen (Echinus
esculentus) can be accurately estimated by measuring the amount of light scattered
and absorbed by a subsample composed of semen diluted with sea water. A ' Spekker' photoelectric absorptiometer was used for the measurements, with a cell 1 cm. long.
2. The number N of spermatozoa in a sample of sea-urchin semen was found to be given by the equation
N= 8-0918 x I OI OY ' + (1-590 x i o y y )
where Y' = 0-3010 — logl oy and y' = absorptiometer reading, when the original
sample was diluted 200 times and the absorptiometer set to 2-000 for the blank. 3. The light-scattering and light-absorbing properties of washed and unwashed suspensions were found to be virtually identical.
4. The number of spermatozoa in a sample of bull semen was found to be given by the equation iV=3-3515 x io9Y' ± (5-283 x io'Vi"),
wnen the original sample was diluted 30 times and the absorptiometer set to 2-000 for the blank.
Counting spermatozoa 395
REFERENCES
BARRON, E. S. G., SEEGMILLER, J. E., MENDES, E. G. & NARAHARA, H. T. (1948). Biol. Bull. Woods
Hole, 94, 267.
GRAY, J. (1928). Brit. J. Exp. Biol. 5, 337. ROTHSCHILD, LORD (1948). J. Exp. Biol. 25, 219.
SALISBURY, G. W., BECK, G. H., ELLIOTT, I. & WILLETT, E. L. (1943). J- Da 'r
y Sci. 26, 69.