899
©IJRASET: All Rights are Reserved
Comparative Study of Neural Network based RSA
Cryptosystem on Various Parameters
Rinki Singh1, Neeru Saxena2 1, 2
I.T. Department, IMS Ghaziabad (University Courses Campus), Ghaziabad, Uttar Pradesh
Abstract: The RSA cryptosystem is supposed to be the first realization of a public key cryptosystem. Its (computational) security is
relied upon the difficulty of factorization. In order to break the RSA cryptosystem it is enough to factorize N where N is the
product of two large prime numbers, p and q. This public key algorithm is based on number theory and has the drawback of requirement of large computational power during the generation of key and its complexity. In this paper Neural Networks are trained in order to encrypt and decrypt the data and then a comparative analysis is performed on the basis of number of layers, number of neurons in each layer, learning algorithm and number of samples. The learning process is done by NN tool in MATLAB to get efficient weights which helps in evaluating the performance.
Keywords: Cryptosystem, RSA, Neural Network, Topologies, number of neurons in each layer, NN tool, MATLAB
I. INTRODUCTION
Artificial neural networks are composed of neurons which are the fastest processing units. These networks are trained such that they give the desired values against the output. The concept was taken from the human brain which is intelligent, learn from the environment or examples and fast. The implementation of human brain with the help of mathematical and computational codes is known as artificial neural network. The network used here for implementation of RSA is multilayer feed forward neural network which is based on back propagation concept that is the feedback concept. The paper includes the evaluation or empirical analysis which is done on multilayer neural network by varying its various parameters like number of layers, number of neurons in each layer, learning algorithm and number of samples. The feed forward neural network is trained for the Input samples corresponding to that target values are there. The learning process is done by MATLAB software to get efficient weights which helps in evaluating the performance. Learning of the network depends upon the input strength which is evaluated with the help of weights assigned to neurons and the input signals so therefore learning algorithm plays a vital role as it helps in getting the efficient weights for the neurons in the network. The efficiency of the network is calculated across various parameters so as to reach superlative architecture we focused on topology, neurons, epochs and time. Goal is said to be achieved when performance (µ◦/µ◦ ±) reaches to 100%.
Experimental results are provided in the form of graphs, tables and snapshots that will help in understanding the analysis.
1) RSA Cryptosystem: RSA is first public-key cryptosystems and is used for secure data transmission. In such a cryptosystem, the encryption key is public and it is different from the decryption key which is kept secret (private). In RSA, this asymmetry is based on the practical difficulty of the factorization of the product of two large prime numbers, the "factoring problem". User of RSA creates and then publishes a public key based on two large prime numbers, along with an auxiliary value. The prime numbers must be kept secret. Anyone can use the public key to encrypt a message, but with currently published methods, and if the public key is large enough, only someone with knowledge of the prime numbers can decode the message feasibly.
2) Artificial Neural Network (ANN): is a computational model which is based on the based biological neural networks. A human brain consists of neurons that process and transmit information between themselves. There are dendrites which receive inputs based upon which output is produced through an axon to another neuron. It is considered nonlinear statistical data modelling tools where the complex relationships between inputs and outputs are modelled or patterns are found. There are three types of layers: input layer middle, hidden layer and output layer. ANN are implemented based on the mathematical operations and a set of parameters required to determine the output. Among various types of ANN available we have used Feedforward Neural Network with backpropagation.
900
©IJRASET: All Rights are Reserved
A. Software Used for TrainingWork has been started by finding the value of N. For this a no. of samples has been used. In first experiment a string with 4 different symbols (A, B, C & D) has been used. Then the complete string is divided in the block size of 3 characters each and then applied the concept of number system to convert the incoming string into numeric values.
Then the numeric string has been converted into the encrypted string using standard RSA algorithm. All the above steps are implemented through a JAVA program which uses different user defined functions
1) Static void inputp() throws IOException To take input in string form and to break that strig in blocks of 3 character each and calculate equivalent numeric value.
2) Static void encrypt () To Encrypt the input string(in numeric form).
3) Static void converte() throws IOException To convert the encrypted numeric values in character form.
4) Static void decrypt() throws IOException To decrypt the encrypted numeric values.
5) Static void convertd() throws IOException To convert the decrypted numeric values in string form.
6) Static long mod(long z,int ed) To calculate (z power ed) mod n
In this way different sample values for different number of symbols have been collected. These values are the inputs of the ANN for performance evaluation on the basis of different factors. An Artificial Neural network is created with help of MATLAB Toolbox by using the newff command. The newff command is used to create a feed-forward back propagation network.
B. Syntax
net = newff
net = newff (PR, [S1 S2... SNl], {TF1 TF2...TFNl}, BTF, BLF, PF)
C. Description
net = newff creates a new network with a dialog box.
newff (PR, [S1 S2... SNl], {TF1 TF2...TFNl}, BTF, BLF, PF) takes, PR -- R x 2 matrix of min and max values for R input elements Si -- Size of ith layer, for Nl layers
TFi -- Transfer function of ith layer, default = 'tansig'
BTF -- Backpropagation network training function, default = 'traingdx' BLF -- Backpropagation weight/bias learning function, default = 'learngdm'
PF -- Performance function, default = 'mse' and returns an N layer feed-forward back propagation network. The following is an example that how network is created:
net=newff([-1 1],[1,9,1],{'tansig','tansig','tansig'});
1) Normalization: To make the adaptation of the network easier, the data are transformed through the normalization procedure that takes place right before training. Assuming that the data presented to the network are in Zp, where p is prime, the space S = [−1,
1], is split in p subspaces. Thus, numbers in the data are transformed to analogous ones in the space S. At the same time, the network output is transformed to a number within Zp using the inverse operation.
2) Evaluation: To evaluate the network performance we first measured the percentage of the training data, for which the network was able to compute the exact target value. This measure is denoted by µ. However, as network output was restricted within the range [−1, 1], very small differences in output, rendered the network unable to compute the exact target but rather to be very close to it. This fact resulted in the insufficiency of the µ measure as a performance indicator. Thus we employed the µ±v
901
©IJRASET: All Rights are Reserved
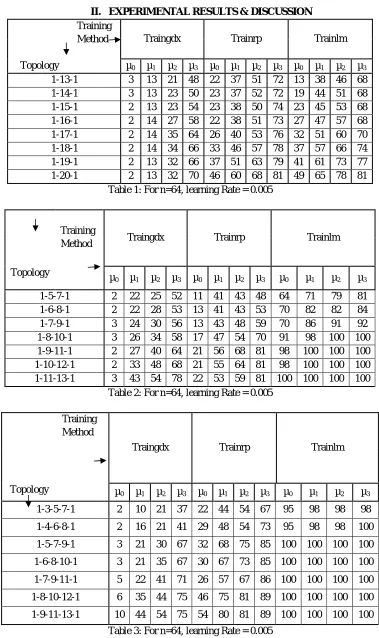
II. EXPERIMENTAL RESULTS & DISCUSSION
Training
Method Traingdx Trainrp Trainlm
Topology µ0 µ1 µ2 µ3 µ0 µ1 µ2 µ3 µ0 µ1 µ2 µ3
1-13-1 3 13 21 48 22 37 51 72 13 38 46 68 1-14-1 3 13 23 50 23 37 52 72 19 44 51 68 1-15-1 2 13 23 54 23 38 50 74 23 45 53 68 1-16-1 2 14 27 58 22 38 51 73 27 47 57 68 1-17-1 2 14 35 64 26 40 53 76 32 51 60 70 1-18-1 2 14 34 66 33 46 57 78 37 57 66 74 1-19-1 2 13 32 66 37 51 63 79 41 61 73 77 1-20-1 2 13 32 70 46 60 68 81 49 65 78 81
Table 1: For n=64, learning Rate = 0.005
Training
Method Traingdx Trainrp Trainlm
Topology
µ0 µ1 µ2 µ3 µ0 µ1 µ2 µ3 µ0 µ1 µ2 µ3
1-5-7-1 2 22 25 52 11 41 43 48 64 71 79 81 1-6-8-1 2 22 28 53 13 41 43 53 70 82 82 84 1-7-9-1 3 24 30 56 13 43 48 59 70 86 91 92 1-8-10-1 3 26 34 58 17 47 54 70 91 98 100 100 1-9-11-1 2 27 40 64 21 56 68 81 98 100 100 100 1-10-12-1 2 33 48 68 21 55 64 81 98 100 100 100 1-11-13-1 3 43 54 78 22 53 59 81 100 100 100 100
Table 2: For n=64, learning Rate = 0.005
Training Method
Traingdx Trainrp Trainlm
Topology µ0 µ1 µ2 µ3 µ0 µ1 µ2 µ3 µ0 µ1 µ2 µ3
1-3-5-7-1 2 10 21 37 22 44 54 67 95 98 98 98
1-4-6-8-1 2 16 21 41 29 48 54 73 95 98 98 100
1-5-7-9-1 3 21 30 67 32 68 75 85 100 100 100 100
1-6-8-10-1 3 21 35 67 30 67 73 85 100 100 100 100
1-7-9-11-1 5 22 41 71 26 57 67 86 100 100 100 100
1-8-10-12-1 6 35 44 75 46 75 81 89 100 100 100 100
[image:3.612.116.495.64.702.2]1-9-11-13-1 10 44 54 75 54 80 81 89 100 100 100 100
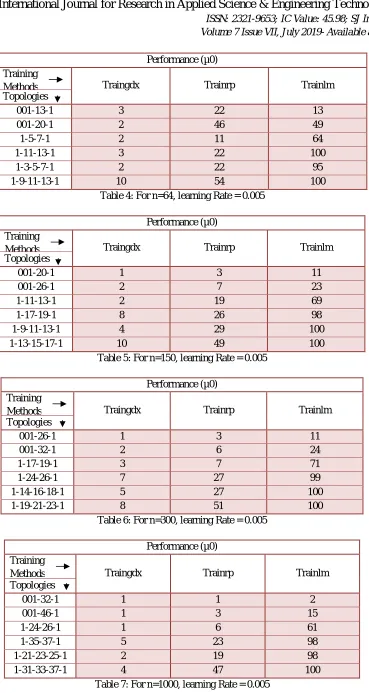
902
©IJRASET: All Rights are Reserved
Performance (µ0) Training
Methods Traingdx Trainrp Trainlm Topologies
001-13-1 3 22 13
001-20-1 2 46 49
1-5-7-1 2 11 64
1-11-13-1 3 22 100
1-3-5-7-1 2 22 95
[image:4.612.124.493.17.710.2]1-9-11-13-1 10 54 100
Table 4: For n=64, learning Rate = 0.005
Performance (µ0) Training
Methods Traingdx Trainrp Trainlm Topologies
001-20-1 1 3 11
001-26-1 2 7 23
1-11-13-1 2 19 69
1-17-19-1 8 26 98
1-9-11-13-1 4 29 100
1-13-15-17-1 10 49 100
Table 5: For n=150, learning Rate = 0.005
Performance (µ0) Training
Methods Traingdx Trainrp Trainlm Topologies
001-26-1 1 3 11
001-32-1 2 6 24
1-17-19-1 3 7 71
1-24-26-1 7 27 99
1-14-16-18-1 5 27 100
1-19-21-23-1 8 51 100
Table 6: For n=300, learning Rate = 0.005
Performance (µ0) Training
Methods Traingdx Trainrp Trainlm Topologies
001-32-1 1 1 2
001-46-1 1 3 15
1-24-26-1 1 6 61
1-35-37-1 5 23 98
1-21-23-25-1 2 19 98
1-31-33-37-1 4 47 100
[image:4.612.120.494.71.207.2]903
©IJRASET: All Rights are Reserved
A. ComparisonThe overall graph is between topologies and performance. Graph drawn with the help of various input samples and there target values which are taken with the help of RSA algorithm. Grey bar is for less than hundred samples and blue bar is for greater than hundred samples. It represents that what are be the number inputs, efficiency is completely depends upon the number of hidden layers and the number of neurons.
TOPOLOGIES EPOCHS TIME µ◦ µ◦± 2 µ◦± 5
1--7--1 10000 0:01:36 5 17 34
1--16--1 10000 0:01:39 24 38 44
1-6-8-1 10000 0:01:56 34 56 65
1-6-8-1 10000 0:01:54 46 62 70
1-6-8-1 10000 0:01:53 59 70 83
1-6-8-1 15000 0:02:56 95 99 100
1-7-9-1 10000 0:01:59 54 80 96
1-7-9-1 15000 0:03:09 78 86 91
1-8-9-1 10000 0:02:03 92 96 100
1-10-11-1 10000(Stopped at 930 )
0:00:13 100
Table 8: Result For samples <100
TOPOLOGIES EPOCHS TIME µ◦ µ◦± 2 µ◦± 5
1-5-7-1 10000 0:01:50 17% 25% 38%
1-5-7-1 10000 0:01:52 1% 20% 29%
1-5-7-1 10000 0:01:52 1% 19% 31%
1-7-9-1 10000 0:01:59 17% 31% 38%
1-7-9-1 10000 0:02:00 21% 31% 42%
1-7-9-1 15000 0:02:00 21% 35% 48%
1-10-12-1 10000 0:02:28 60% 69% 82%
1-10-12-1 10000 0:02:20 60% 75% 83%
1-18-20-1 10000(Stopped at 3854)
0:02:40 97% 100%
1-5-7-9-1 10000 0:03:00 47% 63% 77%
1-7-10-12-1 10000(stopped at 7273)
0:02:45 97% 100%
1-5-7-9-12-1 10000 0:03:55 93% 97% 98%
904
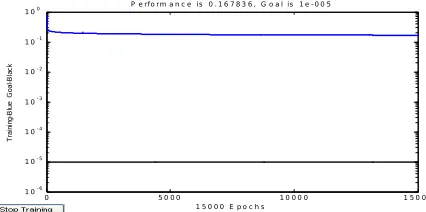
©IJRASET: All Rights are Reserved
B. Snap Shots0 2 0 0 4 0 0 6 0 0 8 0 0 1 0 0 0 1 2 0 0 1 4 0 0 1 0- 6
1 0- 5 1 0- 4 1 0- 3 1 0- 2 1 0- 1 1 00
1 4 5 0 E p o c h s
T rai n in g-B lue G oal -B lac k
[image:6.612.194.407.225.331.2]P e r fo r m a n c e i s 9 . 9 5 6 1 3 e - 0 0 6 , G o a l i s 1 e - 0 0 5
Figure 1: n=64, Topology 1-11-13-1, learning Method Trainlm, Learning Rate=0.005
0 5 0 0 0 1 0 0 0 0 1 5 0 0 0
1 0- 6 1 0- 5 1 0- 4 1 0- 3 1 0- 2 1 0- 1 1 00
1 5 0 0 0 E p o c h s
T ra in in g -B lu e G o a l-B la c k
P e r f o r m a n c e i s 0 . 1 6 7 8 3 6 , G o a l i s 1 e - 0 0 5
Figure 2: n=1000, Topology 1-26-1, learning Method Trainrp, Learning Rate=0.0005
III. CONCLUSION
From the experimental results shown in the graphs (Figure 1 & 2) as well as from the tables it has been observed that we can reach our goals by improving our topologies. The work is done for multiple topologies, where number of neurons as well as the number of layers are varied. We evaluate the performance of feed forward neural network for various numbers of samples to attain superlative architecture. Focusing only on number of neurons will increases the complexity and by increasing the number of layers unnecessarily will increases the processing time of a network. We conclude over here that performance of a system get effected by the number of neurons and number of hidden layers. By focusing only on one will not results in a better system. Therefore, to attain superlative architecture the number of neurons and hidden layers plays a vital role.
REFERENCES
[1] G.C. Meletiou , D.K. Tasoulis and M.N. Vrahatis, A First Study of the Neural Network Approach in the RSA Cryptosystem Sixth IASTED International Conference on Artificial Intelligence and Soft Computing (ASC 2002), At Banff, Alberta, Canada July 17-19, 2002, pp.483-488,
[2] G.D. Magoulas, V.P. Plagianakos and M.N. Vrahatis, Adaptive Stepsize Algorithms for On-line Training of Neural Networks, Nonlinear Analysis T.M.A., 47(5), 2001, pp.3425–3430.
[3] Akram A. Moustafa, “Performance Evaluation of Artificial neural Network for Spatial Data Analysis” Contemporary Engineering Sciences, volume 4, 2011, no.4, 2011, pp.149-163.
AUTHORS PROFILE
Ms. Rinki Singh is working as an Assistant professor, IMS Ghaziabad University courses Campus. She has an approximate 15 years of academic experience. Her areas of interest are Artificial Intelligence, Neural Network & Cryptography.