Modelling Simulation and Performance Assessment
of Multi objective Economic and Emission Dispatch
Problem Using Improved Particle Swarm
Optimization
Rakesh Kumar1, Anil Boyal2
1
M. Tech (Scholar), 2Assistant Professor, Department of Power System Engineering, Regional College of Education Research And Technology, Sitapura Jaipu , Rajasthan Technical University , Kota, INDIA.
Abstract: In the previous decade, numerous endeavors have been made to tackle the ELD issue, and different sorts of requirements or targets have been joined through different scientific arranging and optimization systems. Customary techniques incorporate the Newton-Raphson strategy, the Lambda iterative technique, the Base Point and Partitionation Factor strategies, the Gradient strategy, and so forth. Be that as it may, these exemplary scheduling algorithms require gradual cost bends to be monotonically expanding or fragment by-section direct. Considering the profoundly nonlinear nature of the component requires a very strong algorithm to abstain from adhering to neighborhood ideal. Since the issue is non-direct, procedures dependent on established analytics can't take care of these kinds of issues. The objective of the research paper is to design and simulate quantum computing based modified particle swarm optimization for multi objective emission and economic dispatch problem. The algorithm has been tested on multiple test systems with valve point loading cost function as well. Results have been compared with contemporary research and found to be efficient in comparative assessment on same test system.
Keywords: Economic Load Dispatch (ELD),Genetic algorithms (GA), Evolutionary strategies (ES), Evolutionary programming (EP), Particle swarm optimization (PSO)
I. INTRODUCTION
We can characterize economic load scheduling (ELD) as the way toward allocating load levels to generator sets with the goal that framework loads are completely and economically conveyed. In interconnected power frameworks, costs must be limited. The creation dimension of every generator set is characterized by the economic load conveyance, so the complete expense of producing and transmitting power is the most unrealistic for a given load plan. The motivation behind economic load scheduling is to limit the absolute expense of creating power. The circumstance turns out to be progressively confused when service organizations endeavor to address transmission line misfortunes and regular variances related with hydropower plants. There are various traditional methods that can be utilized to address economic load circulation issues, for example, Lambda emphasess, Newton-Raphson and Lagrangian multipliers. The whole interconnection organize is constrained by the load dispatch focus. The MW power age for every lattice is relegated by the load dispatch focus, contingent upon the essential MW interest for that region. The activity of the load control focus is to keep up the power trade between various areas and framework frequencies at the required qualities. There are numerous options in contrast to scheduling age. In interconnected power frameworks, the essential objective is to locate the real and responsive power anticipates every individual power plant in a way that limits working expenses. This is known as the "economic load scheduling" (ELD) issue. The target work is likewise called the cost work. These target capacities can bring economic costs, framework security or different objectives. The misfortune factor is known as the B factor. The fundamental motivation behind the economic load scheduling issue is to limit the all out expense of producing real power.
[image:1.612.215.400.660.712.2].
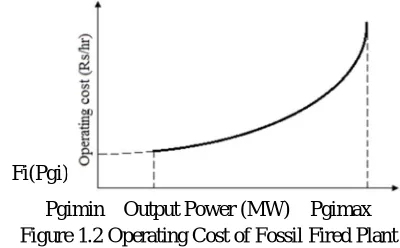
Figure 1.1 shows a simple model of the purpose of fossil plant scheduling. The cost is usually approximated by one or more secondary segments. The operating costs of the plant are shown in Figure 3.2. Therefore, the fuel cost curve in active power generation is in the form of a quadratic curve, as follows:
hr
Rs
c
P
b
P
a
P
F
(
gi)
i gi2
i gi
i/
(1.1)
Whereai, bi, ci is the cost factor of the i-th unitF (Pgi) is the total cost of generationPgi is the generation of the i-generation plant
Fi(Pgi)
[image:2.612.201.401.156.280.2]Pgimin Output Power (MW) Pgimax Figure 1.2 Operating Cost of Fossil Fired Plant
The fuel cost curve has many discontinuities,these occur when the output power is extended by using additional boilers, steam condensers, or other equipment. The is the minimum loading limit below which the operating device is uneconomical (or technically not feasible) and is the maximum output limit due to its rating
II. COMBINED ECONOMIC EMISSION DISPATCH
“The function of fuel cost is simulated and approximated as a Cubic curve, whose total expression ($ / h) is for a period of time T
and many generators N are given by:
=∑ ( ) The economic dispatch problem can be defined mathematically as an objective with two constraints:
( ) = + + +
Subject to the two constraints:
= +
≤ ≤
Where Pi: power output (MW) of the i-th generator; FT: Total fuel cost ($ / h); Fi (Pi): fuel cost per unit i ($ / h); D: Total demand
(MW); L: transmission loss (MW);Pimin, Pimax large power limit of unit i (MW); and N: totalthe number of service units. Toxic gas
released by thermal unitsBurning fossil fuel sources such as sulfur dioxide, nitrogen oxides and carbon dioxideCan contribute to minimizing the world aloneEmissions pass:
( ) = + + +
( ) = + + +
( ) = + + +
In this work, we integrated the price penalty factor hi (maximum fuel cost / maximum emissions per gas) Emission equation
[ ( ) = ( ) +ℎ ( ) +⋯ ℎ ( ) +ℎ ( )
Where hSO2, hNOx and hCO2 are price penalties SO2, NOx and CO2 are mixed with emissions Cost and normal fuel costs.
ℎ = ( )
( )
ℎ = ( )
( )
ℎ = (( )) Comprehensive economic emission scheduling problem is a problem Combination of economic load
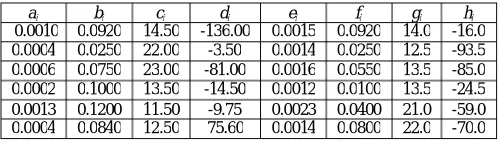
( ) = ∑ + + + Where F(Pi) is the power generation cost of the generator set ($/ hour) output power is Pi; ai,
bi, ci and di are costs Generate the coefficient i of the unit. Emission scheduling issues can also be defined as cubes Standard
functions with four transmit coefficients as:
( ) = + + +ℎ
Where E (Pi) is the emission (in kilograms per hour) and Pi is the power Generated by unit i, and ei, fi, gi and hi are transmitted
coefficient. Minimize the goal of generating electricity costs Pollutant emissions can be converted into a single Use the target of the price penalty factor. Maximum/maximum fine Factors in this study were considered to address CEED issues. The CEED problem with the maximum/maximum penalty factor can be described as
= = ∑ ( ) +∑ ℎ / ( ) Where OF represents the objective function (CEED) and FT refers to Total cost
and himax/min are maximum/maximum penalty factors Generator set can define maximum/maximum penalty factor Such as
ℎ / = ( )/ ( )
Where Pi, max refers to the maximum power (in MW) can be generated by the generating unit i. The goal of this paper is to minimize
power generation costs. And the emission of pollutant gases, i.e. the total cost Meet all other constraints. In the power generation system, need to have many equal and unequal constraints considered to optimize the actual situation system. Power balance and generator limit constraints the two most important constraints are considered here jobs. The total output power (megawatts) must be met Total load demand (in megawatts) Therefore, the total output power must Equal to the sum of total load demand and total load
Power loss (MW). It can be defined as”
= = +
Where Pi, PD and PL are total generated power, total load demand and total loss, respectively.Each power generation unit in the
power generation system has its upper and lower limits. Generate unit output Must be within this limit to work properly. This one Constraint can be defined as
≤ ≤
Where Pimin and Pimax denote the minimum and maximum limits, respectively, of generating unit i.
III. QUANTOM COMPUTING BASED PSO
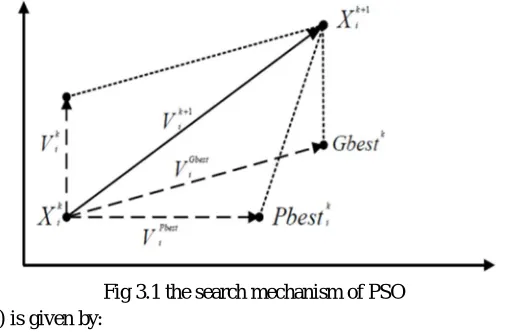
PSO gives populace based Search program, in which people are called halfway icles change, their situation after some time. In the PSO framework, Particles fly around in a multidimensional inquiry space. Every particle alters its situation as per own understanding and experience adjacent particles, utilizing the best position It is experienced without anyone else and its neighbors. Ideal in multidimensional space looking for an answer for move each particle in the gathering Get the best point by including speed position. Particle speed is influenced three segments, to be specific latency, psychological and society. The inertial segment reenacts the inertial conduct of winged creatures flying the past way. The Cognitive parts mirror the memory of feathered creatures about its best area and social the segment reenacts the memory of winged creatures the best area in a portion of the icles. Particle development around the multidimensional hunt space until the point when they locate the best arrangement. Adjustment speed of each can utilize current speed and count specialist the separation to Pbest and Gbest is as per the following.
V = W × V + C × r × Pbest −X + C × r × Gbest −X
Where, V The speed of individual i when iterating k, X Individual i is in the position of iteration k, W inertial weight C1 ,
C2 acceleration factor, Pbest The best position of individual i in iteration k, Gbest
Fig 3.1 the search mechanism of PSO The modified velocity equation (6) is given by:
= . . + () − + () −
= 2
2− − −4
Where = + , > 4
The convergence characteristic of the system can be controlled by . Contraction factor method (CFA) must be greater than 4.0 to guarantee stability. But as Increase Factor K is reduced, diversification is reduced, Produces a slower reaction. Usually when
Using shrinkage factors, Set to 4.1 (ie C1, C2 = Therefore, the constant multiplier K is 0.729.QPSO, proposed and developed by
Sun et al., is the expansion of PSO in the field of quantum computing. The concept of qubits and revolving doors is here to introduce the improvement of demographic characteristics Diversity. Qubit and angle Represents the state of the particle rather than the position and the particle velocity completed in the basic PSO. Thereby, QPSO has powerful search capabilities and powerful search capabilities Fast convergence feature. The basic difference between a qubit and a classical bit is the latter can stay at the same time Superposition of two different quantum states,
| ⟩= |0⟩+ |1⟩
In the above equation, and are complex numbers that satisfy the equation
| | + | | = 1
The rotation state is represented by | 0> and the rotation state is It is represented by | 1>. As can be seen from (1), a qubit is Represents two information states (| 0> and | 1>) simultaneously. This superposition state can also expressed as
| ⟩= sin |0⟩+ cos |1⟩
Where the phase of the qubit is represented by the relation among and The relation among and can
be defined as the position of the particle in QPSO can be described
as arctan
= ± ln Where xid
is the position of the ith particle and pid is local attractor of particle i is located between pbest and gbest and u is a uniformly
distributed random number in the range [0,1]. The value of L can be used following equation
= 2 | − |
Where is the only parameter of QPSO, which can be calculated using the following equation
= (1−0.5). − + 0.5
And the local attractor p can be represented as below
= . + (1− ).
a b c d e f g h 0.0010 0.0920 14.50 -136.00 0.0015 0.0920 14.0 -16.0 0.0004 0.0250 22.00 -3.50 0.0014 0.0250 12.5 -93.5 0.0006 0.0750 23.00 -81.00 0.0016 0.0550 13.5 -85.0 0.0002 0.1000 13.50 -14.50 0.0012 0.0100 13.5 -24.5 0.0013 0.1200 11.50 -9.75 0.0023 0.0400 21.0 -59.0 0.0004 0.0840 12.50 75.60 0.0014 0.0800 22.0 -70.0
IV. RESULTS
The research work done in this dissertation is associated with the minimization of fuel cost and emission dispatch while maintain the network constraints with consideration and non-consideration of valve point effect.
The problems addressed in this research work are as follows-
A. Formulation of economic load dispatch for different test systems.
B. Implementing economic load dispatch problem considering valve point effect for different test systems.
C. Implementation of economic load dispatch problem using modified particle swarm optimization for valve point effect for
different test systems.
D. Implementation of combined emission and economic load dispatch using improved cost function and quantum particle swarm
optimization.
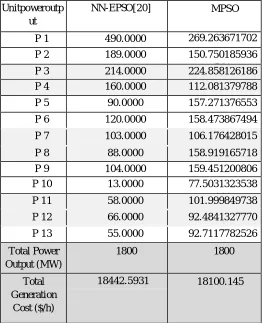
[image:5.612.199.404.286.624.2]This system consists of 13 generating units and the input data of 13-generator system are given in Table . In order to validate the proposed Modifed-PSO method, it is tested with 13-unit system having non-convex solution spaces. The 13-unit system consists of thirteen generators with valve-point loading effects and have a total load demands of 1800 MW and 2520 MW, respectively output.
[image:5.612.239.371.437.566.2]Table-1 Parameter’s Value of Constraints Parameter
Table 2
[image:5.612.186.437.585.656.2]Power Data for Test System of 6 Generators
Table 3
Data for 6 Generator System with Emission Coefficients
Table 1indicates the basic parameters of particle swarm optimization technique used for simulation. Table 2 indicates the power constraints for 6 generator system and table 3 explains the data required for system modeling for developing emission dispatch problem for multiple objective optimization system.
Parameters Values
PopulationSiz e
1000
Maximumiterat ions
100
Number ofruns
100
Dimension 6
Generatin g
Pmi n
Pmax
(MW)
1 50 200
2 20 80
3 15 50
4 10 50
5 10 50
Table 4
Comapartive Analysis of Combined Emission and Economic Dispatch of Proposed Method
Power Lagrange SA PSO QPSO MPSO
P1 50.65 50 50 50.00 50.00
P2 21.20 20.00 20 20.00 20.04
P3 15.46 15.00 15 15.00 15.057
P4 22.6846 20.61 22.11 22.9 22.208
P5 21.3002 22.49 20.6 20.04 22.63
P6 21.1181 21.89 22.31 22.03 20.06
Fuel Cost
($/h) 2734.21 2702.78
2701.796 2701.476 2058.5
Emission 2642.702 2607.46 2593.1844 2583.6485 2440.4
[image:6.612.175.437.396.719.2]Modified QPSO technique is successfully implemented to solve multiobjective CEED problem. Here, CEED is represented using cubic criterion function. Unit wise max/max price penalty factor is considered to convert both objectives into a single objective. Simulation results verify the effectiveness of QPSO in solving this multiobjective problem by achieving reliable, robust and suitable solutions with fast convergence characteristics. The obtained results are compared with other well-known methods like Lagrangian relaxation, PSO and SA which demonstrate QPSO’s superiority over these methods to solve the CEED problem. Small numbers of generating units have been considered in this research due to the unavailability of data for large power generation systems.
Table 5
Result for 13 Generator System Valve Point Effect Unitpoweroutp
ut
NN-EPSO[20] MPSO
P 1 490.0000 269.263671702
325
P 2 189.0000 150.750185936
561
P 3 214.0000 224.858126186
401
P 4 160.0000 112.081379788
931
P 5 90.0000 157.271376553
459
P 6 120.0000 158.473867494
880
P 7 103.0000 106.176428015
040
P 8 88.0000 158.919165718
706
P 9 104.0000 159.451200806
129
P 10 13.0000 77.5031323538
038
P 11 58.0000 101.999849738
940
P 12 66.0000 92.4841327770
156
P 13 55.0000 92.7117782526
324 Total Power
Output (MW)
1800 1800
Total Generation
Cost ($/h)
V. CONCLUSION
This research centers around estimation and incitement of economic load dispatch issue under various working conditions. It likewise gave the arrangement including valve point impact and losses for various test frameworks. Accordingly, three points were built. Initially, built the numerical model of economic and outflow load dispatch with cubical cost works under valve point impact and non-valve point impact with and without losses. Second one is to explain numerical aftereffects of economic load dispatch with altered quantum particle swarm optimization. The third one is similar investigation of reproduced results with existing soft computing issues. This research fundamentally considered the enhanced quantum PSO technique. It is utilized to give the arrangement including numerical investigation. The adjusted PSO technique requires less number of cycles to achieve union, and is progressively exact and not delicate to the variables.
REFERENCES
[1] H. T. Yang, P. C. Yang and C. L. Huang, "Evolutionary Programming Based Economic Dispatch for Ubits With Non Smooth Fuel Cost Functions", IEEE Transaction on Power System, vol. 11, No. 1, pp. 112-117, Feb. 1996.
[2] Neural-Net Based Real-Time Economic Dispatch For Thermal Power Plants MiodragDjukanovic Milan CalovicBorkaMilogevikDejan J. Sobajic IEEE Transactions On Energy Conversion, Vol. 11, No. 4, December 1996
[3] Tarek BOUKTIR, Linda SLIMANI and BELKACEMI, "A Genetic Algorithm for Solving the Optimal Power Flow Problem", Leonardo Journal of Sciences, Vol. 3, No. 4, pp. 44-58, January-June 2004.
[4] Jeyakumar, D. N., T. Jayabarathi, and T. Raghunathan. "Particle swarm optimization for various types of economic dispatch problems." International Journal of Electrical Power & Energy Systems 28.1 (2006): 36-42.
[5] Comparison of genetic algorithm and particle swarm optimization Dr. Karl O. Jones International Conference on Computer Systems and Technologies - CompSysTech’2005
[6] TodorovskiMirko, RajicicDragoslav, “An initialization procedure in solving optimal power flow by genetic algorithm”, IEEE Transactions on power systems, May, 2006
[7] A Hybrid Genetic Algorithm–Interior Point Method for Optimal Reactive Power Flow Wei Yan, Fang Liu, C. Y Chung, Member, IEEE, and K. P. Wong, Fellow, IEEE transactions on power systems, vol. 21, no. 3, august 2006
[8] Roy, Ranjit, and S. P. Ghoshal. "A novel crazy swarm optimized economic load dispatch for various types of cost functions." International Journal of Electrical Power & Energy Systems 30.4 (2008): 242-253.
[9] Das, Swagatam, Ajith Abraham, and AmitKonar. "Particle swarm optimization and differential evolution algorithms: technical analysis, applications and hybridization perspectives". Advances of Computational Intelligence in Industrial Systems.Springer Berlin Heidelberg, 2008.1-38.
[10] Laouer, Mohammed, et al. "New Approach of Optimal Power Flow with Genetic Algorithms."Acta Electro technical et InformaticaVol 8.2 (2008): 35-42. [11] M. I. Mosaad, M.M. El Metwally, A.A. El Emary and F.M. El Bendary(2010): ‘ On-Line Optimal Power Flow Using Evolutionary Programming Techniques’
Thammasat Int. J. Sc. Tech., Vol. 15, No. 1, January-March 2010 .
[12] L.H. Wua, Y.N. Wanga, X.F. Yuana and S.W. Zhoub, Environmental/Economic Power Dispatch Problem using Multi-objective Differential Evolution Algorithm, Electric Power Systems Res. 80 (2011) 1171–1181
[13] Zhisheng, Zhang. "Quantum-behaved particle swarm optimization algorithm for economic load dispatch of power system."Expert Systems with Applications37.2 (2010): 1800-1803.
[14] Chen, Ying-ping, and Pei Jiang. "Analysis of particle interaction in particle swarm optimization. "Theoretical Computer Science 411.21 (2010): 2101-2115. [15] Mukhopadhyay, Sumona, and Santo Banerjee. "Global optimization of an optical chaotic system by chaotic multi swarm particle swarm optimization."Expert
Systems with Applications 39.1 (2012): 917-924.
[16] Aniruddha Bhattacharya, Pranab Kumar Chattopadhyay, Solving economic emission load dispatch problems using hybrid differential evolution, Applied Soft Computing, Volume 11, Issue 2, March 2011, Pages 2526-2537
[17] Cai, Jiejin, et al. "A fuzzy adaptive chaotic ant swarm optimization for economic dispatch."International Journal of Electrical Power & Energy Systems 34.1 (2012): 154-160.
[18] Kumar, Rajesh, et al. "A novel multi-objective directed bee colony optimization algorithm for multi-objective emission constrained economic power dispatch."International Journal of Electrical Power & Energy Systems 43.1 (2012): 1241-1250.
[19] Raglend, I. Jacob, et al. "Comparison of AI techniques to solve combined economic emission dispatch problem with line flow constraints."International Journal of Electrical Power & Energy Systems 32.6 (2010): 592-598.
[20] S. Kirkpatrick, C. D. Gelatt, Jr., M. P. Vecchi, “Optimization by Simulated Annealing”,Science, New Series, Vol. 220, No. 4598, pp. 671-680, May 13, 1983. [21] Masaya Yoshikawa, Hironori Yamauchi, and HidekazuTerai, “Hybrid Architecture of Genetic Algorithm and Simulated Annealing”, Advance on line
publication, 20 Aug 2008.
[22] Y.J. Jeon and J.C. Kim, “Network reconfiguration in RDS using SA and TS”, IEEE /PES, Winter Meeting, pp. 2329-2333, 2000.