203
©IJRASET: All Rights are ReservedBig Data Analytics for Finding Diseases using
Symptoms
Anshu Rashmi, Prateek Singh(Advisor)1
1
Department Of CSE, Sam Higginbottom University of Agriculture, Technology and Sciences, Allahabad
Abstract: To study the probabilistic knowledge assortment mechanism in cloud for helping patients in finding diseases & symptoms and perform the correlation analysis of this collected knowledge. To propose a random prediction model that is meant to foresee the long run health condition of the foremost correlative patients supported their current health standing and To evaluate the proposed model through the performance analysis of the projected protocols through in-depth simulations within the cloud atmosphere. A cloud-enabled massive knowledge analytic platform is that the best thanks to analyze the structured and unstructured knowledge generated from attention management.
Keywords: Big Data, Expert Recommendation,XAMPP,PHP,CAD
I. INTRODUCTION
Determination of medicine ailments may be a developing concern and a standout amongst the foremost difficult difficulties for current drug. As indicated by the globe Health Organization's current report, medicine disarranges, as an instance, epilepsy, Alzheimers ill health and stroke to cerebral pain, influence up to 1 billion people round the world. AN expected half dozen.8 million people bite the dirt every year attributable to medicine issue.
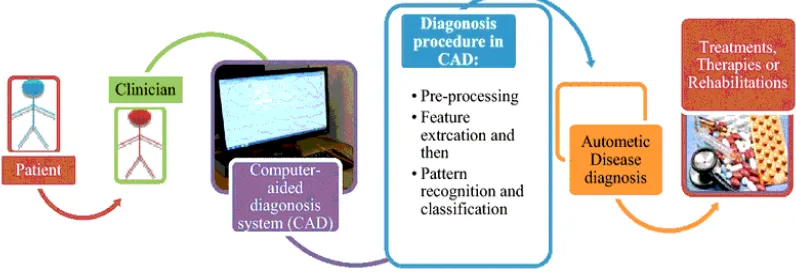
Current conclusion innovations (e.g. engaging reverberation imaging, electroencephalogram) produce large quantity data (in size and measurement) for location, observant and treatment of medicine sicknesses. once all is claimed in done, examination of these medicative monumental data is performed physically by specialists to acknowledge and comprehend the variations from the norm. It is extraordinarily difficult assignment for a person to gather, oversee, break down and adjust such substantial volumes of data by visual review. after, the specialists are requesting mechanized finding frameworks, known as "PC supported analysis (CAD)" which will naturally acknowledge the medicine anomalies utilizing the restorative monumental data. This framework enhances consistency of determination and builds the accomplishment of treatment, spare lives and diminishes price and time. As of late, there square measure some examination works performed within the advancement of the CAD (Fig.1.1) frameworks for administration of restorative monumental data for determination appraisal.
This paper investigates the difficulties of restorative Brobdingnagian data giving and what is more presents the concept of the CAD framework however it functions. This paper likewise provides a study of created CAD ways within the region of medicine ailments analysis. This investigation can facilitate the specialists to possess some thought and seeing however the CAD framework will facilitate them during this purpose.
[image:1.612.126.524.566.706.2]204
©IJRASET: All Rights are ReservedII. BACKGROUND OR RELATED WORK
In the realm of prescription, medicine scatters unit the foremost hard to analysis, deal and screen because of the sophisticated sensory system. Finding of medicine maladies and their medicines request high accuracy, devotion and talent. These days, gift day innovation and frameworks amendment neurologists to produce acceptable medicine care. medicine disarranges unit infections of the body's sensory system. Basic, chemistry or electrical variations from the norm at intervals the complex body part, spinal string or utterly totally different nerves can originate a scope of aspect effects.
Because of high volume, speed and many-sided quality of the restorative information, it is very troublesome for the specialists to combination, oversee, investigate and adjust the expansive volumes of information for conclusion, treatment analysis and transcription. Reconciliation of high amount physiological information is that the wonderful check for the specialists to convey clinical suggestions. Supporting therapeutic specialists or neurologists throughout the time spent finding a right conclusion to a theory terribly} very convenient means that is extremely sexy to spice up a patient's result. As a rule, the investigation of those large measures of knowledge is performed physically through visual review by neurologists/specialists to acknowledge and comprehend variations from the norm from healthful imaging and flag info.
A. Theorem 1
Probability of visit ℘V of a patient to a hospital is at least fdδw .
B. Proof
Let, f be the frequency of visits by a patient Pkij to the ith department of kth hospital, where i∈DP and k∈H . Hence, the probability
of frequency of visits ℘f of a patient to the hospital within the window w can be expressed as fw . Similarly, the visiting probability
to a department ℘DP of a patient within the hospital is 1/∑ı=1δDPi . Probability of a patient consulted by a doctor within one
department ℘D=1/∑ı=1dDi . If there are d numbers of doctors present in δ numbers of departments in a hospital, the total
probability of visits of a patient can be expressed as ℘V=℘f * ℘DP * ℘D . Further, ℘V can be fw * 1∑ı=1δDPi * 1∑ı=1dDi . If we
proceed further, ℘V(w) becomes fdδw .
It is to be noted that probability of visits of a patient increases monotonically with f and w . In another scenario, a BAN (Bkij ) is associated with the department in a hospital, which generates data with time. Similarly, the indoor patients also generate data time to
time. In both scenarios, probability of frequency of visits (℘f ) is set to be 1, as the BAN or indoor patients can generate data
throughout the observed time (w ).
C. Theorem 2
Probability of consultation of a BAN ℘BA or indoor patients in a department is at least 1dδ .
D. Proof
Let, Bkij be the jth BAN associated with ith department of kth hospital, ∀i∈DP and ∀k∈H. If dand δ are the number of doctors and
departments present in a hospital, respectively, the visiting probability of a patient to the doctors and to a department
are ℘D and ℘DP, respectively. The total probability can be expressed as ℘BA=1 * ℘DP * ℘D.
Hence, ℘BA=1 * 1∑ı=1δDPi * 1∑ı=1dDi. Finally, ℘BA can be obtained as 1dδ.
III.PRESENTATIONOFTHEMAINCONTRIBUTIONOFTHEPAPER/SCOPEOFRESEARCH
[image:2.612.62.539.584.723.2]The main contribution of this research paper is to protect the life of all creatures and control to the disaster.We can save to everything with in time. The scope of this research paper will provide the different types of knowledge, answers related to diseases.
205
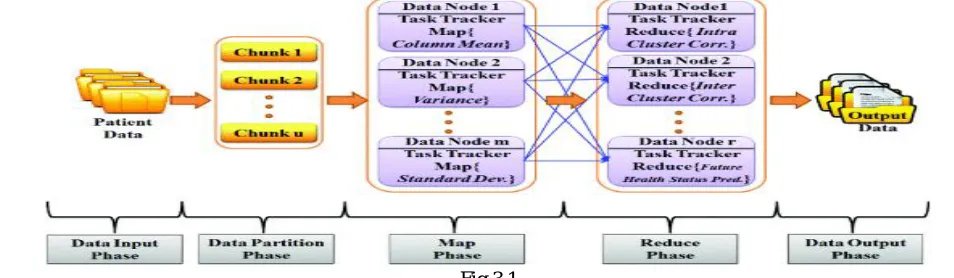
©IJRASET: All Rights are ReservedA. Data Input Phase: It is starting phase in which data (Patient data) are collected in a file. That file is known as Patient Data (BAN) in fig 3.1
B. Data Partition Phase: It is second phase in which collected data (Patient data) are partitioned on basis of same types of patient & diseases, make a file. That file is known as Chunk (Fig 3.1).
C. Map Phase: It is next phase in which data (Data Node) are collected in a file. That file is known as Data Node (1, 2,….m) in Fig 3.1.
IV. METHODOLOGY AND DISCUSSION
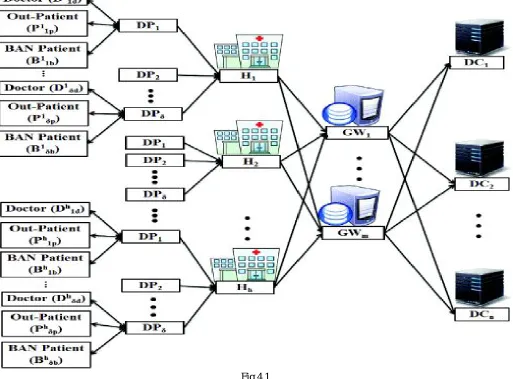
Consider a cloud-based healthcare environment with h numbers of hospitals in a set H= {H1, H2, Hh}, where h∈H as shown in Fig
(4.1). Let various departments be associated with one hospital and for simplicity, it is assumed that same and equal numbers of
departments are present in each hospital. Let, DP= {DP1, DP2, DPδ} be the set of δ numbers of departments associated with each
[image:3.612.51.564.279.658.2]hospital. Besides, each department is coupled with different numbers of doctors, out-patients and BAN patients, which are the sources for generating the big data. It is to be noted that out-patients are the patients who visit the hospital for treatment without staying there overnight. BAN patients are the chronic patients fitted with smart body sensors to monitor their health condition round the clock. For simplicity, throughout the paper, we refer to the out-patients and BAN patients as patients and BAN, respectively.
Fig.4.1
Let, d be the numbers of doctors present in a set Dkij , where j={1,2,…,d} in the ithdepartment of kth hospital, ∀i∈DP and ∀k∈H .
Thus, Dkij= {Dk1d∪Dk2d∪…∪Dkδd}, ∀i∈DP, ∀k∈H. For example, D321 represents the doctor 1 that belongs to the department 2
in hospital 3. Let, Pkij be the set of patients, where j= {1, 2,p} in ith department of kthhospital, ∀i∈DP and ∀k∈H .
206
©IJRASET: All Rights are ReservedTherefore, Pkij={Pk1p∪Pk2p∪…∪Pkδp} , ∀i∈DP , ∀k∈H . For example, P321represents the patient 1, which belongs to the
department 2 in hospital 3. It is assumed that patients with BANs are also admitted to a hospital, which could be either a patient or a BAN at a time. Similarly, let b be the number of BANs present in a set Bkij ,
where Bkij={Bk1b∪Bk2b∪…∪Bkδb} , ∀i∈DP , ∀k∈H and different number of BANs are available in various departments within a
hospital. For example, B321 represents the BAN 1 that belongs to the department 2 in hospital 3.
In our proposed model, a window based temporal data collection and monitoring model is used to enhance the quality of patient monitoring. Let, T={0,1, 2,…,t} be a continuous time frame, which is divided into w number of windows, where each window consists of z units of time duration. Each time duration could be considered as a minute, an hour, a week, a month or a year that depends on the applications. Accordingly, Dkij(w) , Pkij(w) , and Bkij(w) represent the volume of data generated from the doctors, patients and BAN, respectively in each window w . The collected data within window w are stored in different cloud data centers as
shown in Fig. 1. Let, {DC1, DC2,…,DCn} be the N numbers of geo-distributed data centers located in the cloud, where n∈N .
These data centers are connected through M numbers of gateways G= {GW1, GW2,…,GWm} , where m∈M . In our
framework, H numbers of those hospitals are connected with those N numbers of geo-distributed data centers via M numbers of gateways.
V. STEPS TO INSERT / PREPARE THE CODE
VI. PROGRAMMING WHICH IS ESSENTIAL FOR MAKING FUTURE HEALTH PREDICTION MODEL
In this section, we predict the future health status of the patients based on their current health parameters (Ψ). Note that the patients
are grouped together in a set (Ωıȷ ) in a particular department δ based on their correlated values (Γakδ(w) ). throughout the
207
©IJRASET: All Rights are ReservedLet, S= and O= be the state and observe area set in HMM, severally. The respiratory illness patients’ future health prediction is taken into account because the application of our planned prediction model. Let, the ith Flu patient (Pi) be treated by the jth doctor
(Dj) having ψ health parameters within window w0 as the initial case. A sequence of hidden states γ= such as a runny nose (Rn),
sneeze (Sn), throat infection (St), i.e. γ= are found by the doctor at different time instances during observations. However, it's assumed that every observation is related to totally different chances to create the surroundings a lot of realistic. while not losing
generality, the initial probability (Π) is considered, where Π=. Let, αıȷ be the transition probability from state ı to state ȷ. An
emission probability βıȷ is defined to estimate how likely the patient feels during observation Oȷ on each arrival time, which affects the state Sı .
[image:5.612.39.569.191.729.2]VII. RESULTS & CONCLUSION
208
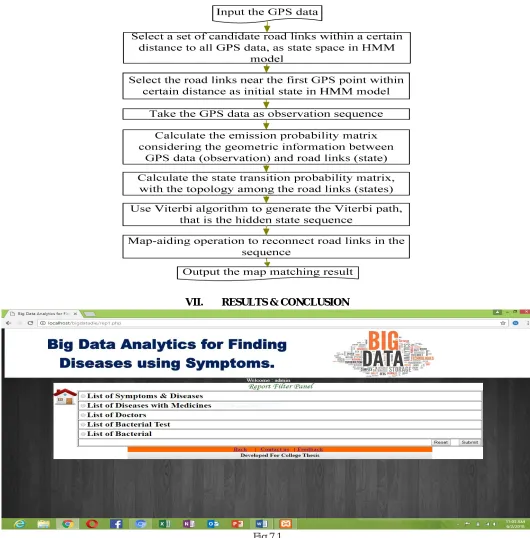
©IJRASET: All Rights are Reserved [image:6.612.53.557.99.405.2]In Fig 7.1 represents the report filter panel where all records are saved. List of symptoms & diseases, list of diseases with medicine, list of doctors, list of bacteria tests, list of bacteria all related data are saved.
Fig 7.2
On the basis of symptoms (fig 7.2) we can easily have found out relates to medicines, diseases, test and doctors related information.
Fig 7.3
[image:6.612.62.550.426.698.2]209
©IJRASET: All Rights are Reservedmedicine facilities on basis of symptoms, save lives and reduces cost and time and. Finally, a stochastic prediction model is designed to foresee the future health condition of the most correlated patients based on their current health status. Performance evaluation of the proposed protocols is realized through extensive simulations in the cloud environment, which gives about 98.4% accuracy of prediction, and maintains 91% of CPU and bandwidth utilization to reduce the analysis time and death percentage. we can easily determine medicine details or others details regarding any diseases and so on by my software(model) and safe life’s.
REFERENCES
[1] Assinder, N. (2006, June 20). Why is Reid looking at new law? BBC.co.uk. Retrieved January 29, 2006.
[2] Brooks-Gordon, B., Adams, C., Bilby, C., Fenton, M., Kenworthy, T., Duggan, C., & Mc Carthy, L. (2004). A Systematic Review of Psychological Treatments for Adults who have Sexually Offended or are at Risk of Sexually Offending. Final report for NHS National Programme on Forensic Mental Health R & D. Retrieved 22/02/2007.
[3] Burn, M. F., & Brown, S. (2006). A review of the cognitive distortions in child sex offenders: An examination of the motivations and mechanisms that underlie the justification for abuse. Aggression and Violent Behaviour, 11, 225-236.
[4] ‘Child sex offenders plan condemned’ (2007, June 1). bbc.co.uk. Retrieved June 14, 2007.
[5] Harrison, K. (2007). The High-Risk Sex Offender Strategy in England and Wales: Is Chemical Castration an Option? The Howard Journal, 46, 16-31. [6] Denov, M. (2003). To a safer place? Victims of sexual abuse by females and their disclosures to professionals. Child Abuse and Neglect, 27, 47-61.
[7] Duarte N. C., Becker S. A., Jamshidi N., et al. Global reconstruction of the human metabolic network based on genomic and bibliomic data. Proceedings of the National Academy of Sciences of the United States of America. 2007;104(6):1777–1782. doi: 10.1073/pnas.0610772104.
[8] Edwin Morley-Fletcher -2016: Challenges in data intensive healthcare.
[9] Fitch, K. (2006). Megan’s Law: Does it protect children? (2) An updated review of evidence on the impact of community notification as legislated for by Megan’s Law in the United States. London: NSPCC.
[10] Gregory S. Nelson ThotWave Technologies, Chapel Hill, NC 2017:A Practical Guide to Healthcare Data:Tips, traps and techniques.
[11] Haggart C. R., Bartell J. A., Saucerman J. J., Papin J. A. Whole-genome metabolic network reconstruction and constraint-based modeling. In: Verma M., Jameson D., Westerhoff H. V., editors. Methods in Systems Biology. chapter 21. Vol. 500. Academic Press; 2011. pp. 411–433. (Methods in Enzymology). [12] Henry C. S., Dejongh M., Best A. A., Frybarger P. M., Linsay B., Stevens R. L. High-throughput generation, optimization and analysis of genome-scale metabolic models. Nature Biotechnology.2010;28(9):977–982. doi: 10.1038/nbt.1672. [PubMed] [Cross Ref].
[13] Mark d’Inverno et.al (13 March 2012)Just as conventional institutions are organizational structures for coordinating the activities of multiple interacting individuals, electronic institutions provide a computational analogue for coordinating the activities of multiple interacting software agents.
[14] Pavel Tichy et.al (10 October2011): Design and integration of multi-agent systems are becoming more and more important since there is evidence of a shift of multi-agent application deployment from academic or lab testing areas to real world applications such as manufacturing, aerospace, logistics, and networking. [15] Radrich K., Tsuruoka Y., Dobson P., et al. Integration of metabolic databases for the reconstruction of genome-scale metabolic networks. BMC Systems Biology. 2010;4, article 114 doi: 10.1186/1752-0509-4-114. [PMC free article] [PubMed] [Cross Ref].
[16] Raman K., Chandra N. Flux balance analysis of biological systems: applications and challenges.Briefings in Bioinformatics. 2009;10(4):435–449. doi: 10.1093/bib/bbp011. [PubMed] [Cross Ref].
[17] TF7 Healthcare subgroup -2016: Healthcare Opportunities.
[18] Tran, M. (2007, June 18). ‘Police Smash global web pedophile ring’. Guardian.co.uk. Retrieved June 24, 2007.
[19] Travis, A. (2007, April 11). Home Office disowns plan for UK version of Megan’s Law. Guardian.co.uk. Retrieved April 11, 2007.