Research Project
Department of Computer Science
University of Canterbury
A TOOL FOR MEASURING THE EFFECTIVENESS
OF
UNIVERSITY COMPUTING SERVICES
M. CHEN
TABLE OF CONTENTS
Page
ACKNOWLEDGEMENTS i i
1. INTRODUCTION 1
2. BACKGROUND 2
3. THE NATURE OF THE PROBLEM 4
4 . THE MAJOR EXPLORATORY AREAS 5
5. CONSTRUCTION OF THE TECHNIQUE 9
6. RESULTS 17
7. CONCLUSIONS FROM THIS ANALYSIS 21
REFERENCES 23
APPENDICES
Appendix A: A Look at the New Zealand
Universities 26
Appendix B: Computing Services offered at
the University of Canterbury 29
Appendix C: Questionnaire used and
summary of the responses 30
Appendix D: The SPSS program for data analysis 42
Appendix E: Statistical analyses for
ACKNOWLEDGEMENTS
I would like to thank my supervisor, Mr J. Good,
for his help and untiring words of encouragement;
Mr N.S. Roberts of the Political Science Department for
assistance in the design of the questionnaire; and
Dr W.E. Davis and Mrs F.W. Thompson of the Computer Centre
1 • INTRODUCTION
Criteria for evaluating computer systems have
traditionally been considered by computer scientists
and professionals from the viewpoint of machine efficiency
rather than user satisfaction. This has been justified by
arguing that, although some explanation of human behaviour
is required in any form of man-computer interaction,
11 [it is] not part of the legacy of the computer sciences"
[Jutila and Bararn 1971, p. 344). But since i t is the human
user who utilises the computer as a problem-solving tool,
he will judge and base future expectations of how well the
tool performs for him. So, no matter how efficient the
system components are, if the services provided by the
computer system do not meet the needs of its users, the
system is a failure: and there have been many such failures.
A university computing environment provides an excellent
test bed in which to examine the needs of a varied user
population, and to discover the crucial factors determining
local user satisfaction. In addition, the New Zealand
universities are all similarly equipped and founded, making
i t possible to compare the different ways of providing
similar services, and to postulate the corresponding effects
on user satisfaction.
The primary aim of this project is to develop a
general tool for use in such a comparative investigation.
In this process, a pilot study carried out at the University
of Canterbury tested hypotheses about user characteristics,
the nature of man-computer interaction, and the overall
2. BACKGROUND
User-oriented evaluation must firstly be viewed 'in
relation to the wider concept of "man-computer interaction".
Several authors have tried to define this esoteric
relation-ship [Davis 1966; Licklider 1960; Shackel 1969] and formulate
possible models [Carbonell 1969]. It is the nature of the
link that exists between man and computer that must be
clarified, before any valid hypothesis on user satisfaction
may be postulated.
Previous literature has tended to consider specialised
environments, as" ... innovation studies were rampant;
evaluation of user effectiveness was virtually non-existent"
[Sackman 1970, p. 10]. For example, the comparison of
time-sharing versus batch processing has been extensively studied
[Gold 1969; Hansen 1976; Sackman 1970; Smith 1967]. The
approach has been to measure levels of user performance,
rather than satisfaction of user needs. Many have recognised
the important role of human factors, but are constrained by
lack of experimental measurement methods.
The majority of the research has been in commercial
applications. As part of his doctoral dissertation, McKaskill
[1977] carried out a comparative organisational survey to
investigate factors which influence the effectiveness of
computer-based information systems. The objective was to
determine characteristics of the user, system, and
organisation, and relate them to some measure of system
effectiveness. Similarly, the extensive survey of Eason
within each organisation. Four indices (task fit, ease
of use, user support, and indirect consequences) were
constructed to summarise user responses, and proved useful
in job type comparisons, and evaluating individuals and
groups. Their most valuable contribution was in identifying
the problems to tackle for man-computer interaction.
University computing service applications have
concerned the role of university computing and characteristics
of university users. Whether university computing is a
political process [Wiste 1974], managing critical resources
[Mosmann and Stefferud 1971], or part of a formal
organisational model [Gross 1968; Varanelli 1978], adequate
provision of services is still emphasised. Users may be
studied according to their pattern of resource utilisation
[Hunt et al. 1971; Haralambopoulos and Nagy 1977] or by the
rate at which they learn to use the system effectively
[Jutila and Baram 1971]. Particular services may be picked
out as representing important factors in user satisfaction,
such as consultative services [Alty et al. 1978] or the level
of instructional computing [Mosmann 1977].
However, so far there has been no overall study of
university computing services~ la McKaskill. The essential
questions that need to be asked for such a study are:
What is practicable to investigate?
How are the services to be evaluated?
3. THE NATURE DF THE PROBLEM
The framework of the problem is to assess the extent to
which university computing services meet user needs. Thus
our primary concern is with effectiveness - how well the
services perform, rather than efficiency - how much of the
available resources are being used. We believe that the
extent to which individual user's needs are satisfied,
depends on three components:
(i) Nature of the computing services.
(ii) Nature of the users and their needs.
(iii) Nature of the interaction which exists between them.
A detailed analysis is required to ascertain what are
the services, who are the users, and how do they interact
with the services. Certain relationships may emerge as
being obvious in establishing satisfaction or dissatisfaction
of the individual user (e.g. turnaround time is important to
students); others may be less direct (e.g. to what extent
does previous experience influence present satisfaction).
Testing these relationships with a large sample of university
users should highlight the sensitive areas on the provision
of computing services at Canterbury.
In the broader perspective, the future projection of
this analysis into a comparative study of the New Zealand
universities could pinpoint the merits of different
approaches to these sensitive areas. The current computer
configurations and funding structure of the universities are
4. THE MAJOR EXPLORATORY AREAS
4.1. Provision of Computing Services
Definition 4.1.1.
We define computing services as all the facilities made
generally available to assist users in the performance of
their tasks.
These would include hardware and software, hours of
availability, consultative and documentary services,
ancillary services, funding and accounting routines.
The term "computing $ervices" is preferred over "computer
services" as having a more general connotation, but the
distinction is purely arbitrary. Also, in this project
the computing services under study are those provided by
the Computer Centre of the university.
In order to gauge the satisfaction level of users, one
must determine the actual services provided by the Computer
Centre. A list of the services provided by the University
of Canterbury appears in Appendix B. Questions on the use
of these services fall naturally into the following
categories: the method of using the computer, from feeding
parameters to writing complex programs; the communication
method employed, such as batch or on-line; the frequency of
use of consultative services, reference manuals and
informational media; the methods of input preparation and
output distribution.
In addition, the continuing support and development of
these services is very important, for" .. computer centres
.i university ..• support must be responsive to requests
thrown at it" [Selfridge 1973]. However, from the Computer
Centre's view, i t is often a tradeoff between satisfying
user needs and meeting certain Centre requirements,
e.g. extending the hours of availability may cause security -:-1
problems. Also, as the range and maturity of facilities
increase, so do user expectations, and the Computer Centre
must cater accordingly for this.
4 • 2 • The User Population
Definition 4.2.1.
We define a computer user as any person who makes use of
the computing services in any type of application.
Typically this person will not be an expert in computing,
but utilises the computer as a problem-oriented tool. Eason
et al. [1974, p. 8] define such a person as a "naive computer user".
Within the university environment, the user population
is a heterogeneous mixture of academics, students, and
researchers. They all have a common aim in their utilisation
of the computer, but differing emphases on factors important
to their task performance, such as turnaround time, access to
facilities, and quality of documentation and consultative
services.
It would seem logical to use a behavioural model of the
computer user; " .. because nearly all the evaluations are
essentially trials with humans, the experimental methods of
the human sciences must be used if validity is to be ensured"
insufficient and at best only serve" .. as a set of
evaluation criteria by which a third party may assess
whether a particular system is likely to fulfil the needs
of a particular kind of user" [Eason et al., p. 7).
What is required then, is a description of the user
profile. This will include his status as a user, purpose
for using the computer, the major type(s) of work done
(often equated to pattern of resource utilisation), and the
level of the user's previous experience in computing. This
last factor is especially important in forming the bias
(one would hypothesise) for future expectations. The period
and place of previous computing instruction and knowledge of
various programming languages form some of the building
blocks in the profile of a typical university user.
4 • 3 • The Nature of the Interaction
The nature of the link or interface that exists between
the user and the computer is highly tenuous and needs to be
explained. Firstly we distinguish between the user's mode
and medium of interaction. The mode may be explained as the
use of a range of software facilities, whereas the medium is
the communication method employed. For example, a
statistical package user running batch programs is
communicating via the batch medium, but his mode is
described as feeding parameters into packages.
The interface as seen by Eason et al. [1974) comprises
two distinct (sometimes opposing) functions: the interface
as a link, relating the physical and psychological aspects
of man to the hardware and software of the computer; and the
unnecessary complexity not required for his task.
Whatever the function of the interface, certain
satisfaction levels are engendered by the users through
their interaction with the services. These may be general
attitudes to batch use, interactive use, the overall
disposition, or particular frustrations with the adequacy
of the consultative services, documentation or data
5. CONSTRUCTION OF THE TECHNIQUE
5.1. Formulation of the Questionnaire
5.1.1. Justification
Why use a questionnaire? Ne justify its use because of
the "value of questionnaire surveys as useful exploratory
aids - aids that uncover and highlight key problems and
areas based on expressed attitudes and opinions of current
and potential users" [Sackman 1970, p. 37]. Social
scientists have traditionally used questionnaires for this
type of purpose, and i t was felt that a general survey of
user attitudes was required for the first phase of this
project.
5.1.2. Layout of the Questionnaire
On the basis of the features discussed in Section 4
on computing services, user population and the nature of the
interaction between them, a table of user characteristics
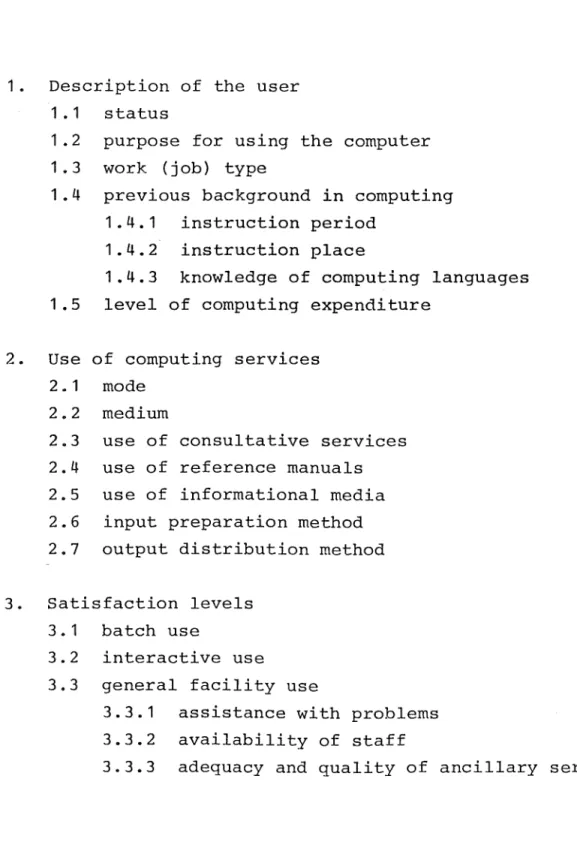
was formulated (Table 5-1). The content of the questionnaire
was formulated from this table. The three logical
subdivisions within the table represent the three major
components under investigation. The questionnaire comprised
31 questions, with two additional comment sections available
for user assessment of the computing services, and of the
questionnaire itself.
5.1.3. Preliminary Survey
A small sample of forty users were selected at random
from the monthly summary of user projects, to participate
"I
j
Table 5-1. User Characteristics
1. Description of the user
1.1 status
1.2 purpose for using the computer
1.3 work (job) type
1.4 previous background in computing
1.4.1 instruction period
1.4.2 instruction place
1.4.3 knowledge of computing languages
1.5 level of computing expenditure
2. Use of computing services
2.1 mode
2.2 medium
2.3 use of consultative services
2.4 use of reference manuals
2.5 use of informational media
2.6 input preparation method
2.7 output distribution method
3. Satisfaction levels
3.1 batch use
3.2 interactive use
3.3 general facility use
3.3.1 assistance with problems
3.3.2 availability of staff
hoped that ambiguities and irrelevancies in the questionnaire
would be ironed out before the actual pilot study. The
'
feedback from this preliminary survey was of great value in
improving the layout and content of the questionnaire. For
example, some users found i t difficult to distinguish among
work type alternatives; they did not consider themselves as
belonging exclusively to one category, but to several
categories in varying amounts. This question was
subsequently modified to allow for more than one alternative.
Also, some questions were applicable in some time periods,
not in others; there was no allowance for the wide
distribution of computing activity over some time period.
A small analysis of the results showed interesting results
and relationships that needed to be verified and compared
with a larger sample.
5.2. Selection of the User Sample
5.2.1. Sample Size Determination
A full-scale study of all the users at Canterbury
University would be a time-consuming task, though i t would
provide a true representation of user attitudes at this
university. The problems of determining a significant
sample size are well-known [Mace 1964]. Qetermining exactly
who are the users then became particularly evident, when a
sample size for the pilot study had to be selected. An
inspection of the Computer Centre's user file (consisting
of all registered projects, including subaccounts for
under-graduate users of the B6718) revealed that much of the
information was out-of-date and many users had since left
file and comparing i t with the project registration forms,
reduced the original figure of 900 users to about 600
current users at Canterbury University. The sample size
selected was 295 users (300 were actually chosen, but five
had already taken part in our preliminary survey). This
seemed large enough to get a representative sample, yet
not too large for processing constraints.
5.2.2. Sampling Technique
To increase the reliability of sample results,
the technique of proportionate stratified sampling [Butcher
1965; Hansen 1963, ch. 5] was chosen. With this technique
the population is divided into various strata, and
independent, random selections are taken from each stratum.
The proportion of the individuals per stratum in the sample
must be the same as the proportion represented by that
stratum in the total population, e.g. if students represent
60% of the total population of 1000 users, then for a sample
size of 300, 60% or 180 of those selected should be students.
Proportionate stratified sampling tends to produce a
more representative sample in the sense that "the sampling
error of a mean [from the stratified sample] is nearly always
smaller than the standard error in a simple random sample of
the same size" [Bhtcher 1965, p. 7].
The user population was divided into two categories:
(i) External users; and
(ii) Internal users, who were subdivided into departments,
and further into categories of staff and students.
The population from which the sample was chosen did
system, as the survey was primarily aimed at
investigating the services provided by the
B6700 and its satellites.
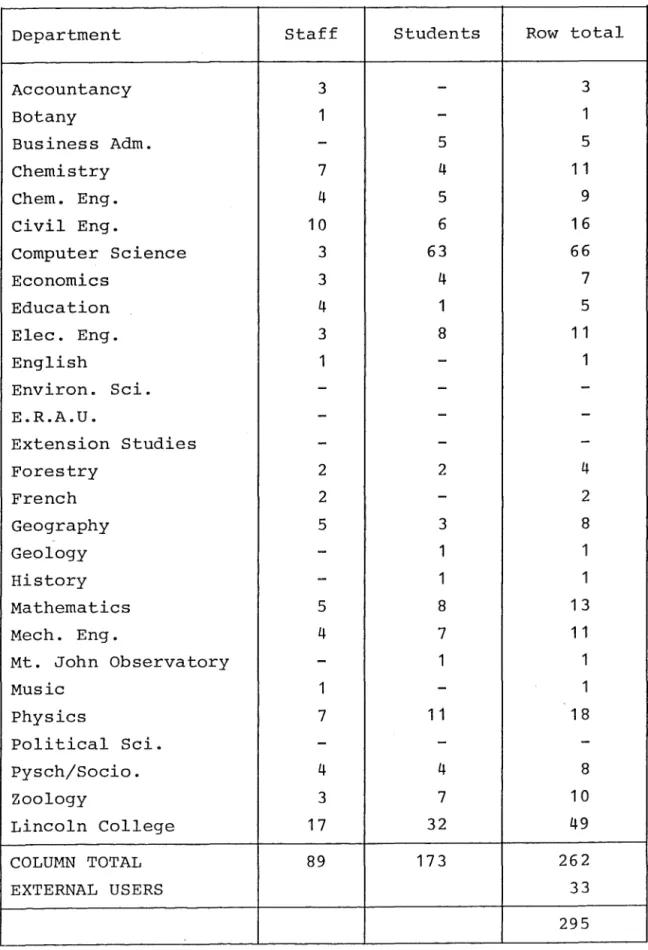
A breakdown of the numbers chosen in each category per
department is shown in Table 5-2.
5. 3. Analysis
After questionnaire collection and data entry,
results were analysed using a statistical computer package.
The main computer packages available were Basis, SPSS, and
Teddybear. SPSS [Nie et al. 19 70] was chosen mainly for
availability of up-to-date documentation and ease of analysis
by subprogram control cards.
For each user, various "satisfaction indices" were
constructed to represent levels of satisfaction with
particular services. These were:
(i) Batch index - an indication of the attitude towards
various aspects of the batch service, such as turnaround
time; queue structure, location of RJE facilities etc.
(refer to Question 21 of the questionnaire in Appendix C).
(ii) Cande index - an indication of the attitude towards
aspects of the interactive service, such as response time,
assistance, range of facilities etc. (Question 22 in
Appendix C) .
(iii) Ancillary services index - the attitude towards
support facilities such as data preparation, documentation,
consultative services etc. {Questions 23-31 in Appendix C).
(iv) Overall index - the general attitude towards all
aspects of the computing services represented by the average
Table 5-2. Breakdown of Sample by Department and Category
Department Staff Students Row total
'
'j
Accountancy 3
-
3Botany 1
-
1Business Adm.
-
5 5Chemistry 7 4 1 1
Chem. Eng. 4 5 9
Civil Eng. 10 6 16
computer Science 3 63 66
Economics 3 4 7
Education 4 1 5
Elec. Eng. 3 8 1 1
English 1
-
1Environ. Sci.
-
-
-E.R.A.U.
-
-
-Extension Studies
-
-
-Forestry 2 2 4
French 2
-
2Geography 5 3 8
Geology
-
1 1History
-
1 1Mathematics 5 8 13
Mech. Eng. 4 7 1 1
Mt. John Observatory
-
1 1Music 1
-
1Physics 7 1 1 18
Political Sci.
-
-
-Pysch/Socio. 4 4 8
Zoology 3 7 10
Lincoln College 17 32 49
COLUMN TOTAL 89 173 262
EXTERNAL USERS 33
services questions, not the average of the three indices.
The first three indices were, calculated as the average of
answered questions in the appropriate section. If a user
did not use a particular service, such as the interactive
service, the appropriate index was set to zero and did not
contribute to any subsequent analysis. Each of the four
indices could range from 1-5, corresponding to opinions
ranging from "highly dissatisfied" to "highly satisfied".
Having established a general feel for user attitudes
towards the provision of computing services, cross-tabulation
techniques were used to identify the more sensitive
interactions. Thses were exposed by looking at variations
in satisfaction levels significantly at variance with those
in the full sample.
There remains a very large number of interactions to be
studied, but this detailed analysis based on the data base
obtained from the survey, is not part of this project. Our
objective was to develop a technique for exposing and
analysing particular interactions, about which particular
questions should be asked. The answers to the questions may
be provided by the analysis, or further data may need to be
obtained from the users concerned. The questions might be
like these:
Are, say, FORTRAN users significantly more satisfied
with batch services than, say, ALGOL users? If they are,
why is this so?
Do users with some or first knowledge of assembler
find services easier or more difficult to use? Again, if
-:~ Is there a typical growth path for particular types of
users? For instance, do package users become FORTRAN users,
or vice versa?
There is some dissatisfaction with batch turnaround.
A fruitful study that could be carried out quite simply,
would be to measure and compare the users' perceptions,
expectations, and realisations of turnaround. We believe
that users' satisfaction with services may be related at
least as much to their feelings about the services, as i t
6. RESULTS
6.1. Response Rate
Of the 295 questionnaires sent out, 209 of them were
returned. This represents a response rate of 70.85%.
However, of those 209 returned, 22 of them were unanswered
for such reasons as the user being away on sabbatical leave,
having left the university, unable to be contacted, or
preferring not to fill in the questionnaire because had
not made any recent use of the services. Therefore the
effective response rate was 187/295
=
63.4%.A copy of the questionnaire used in the survey and a
summary of the responses for each question are provided in
Appendix C. The percentages of responses for each question
will not always add up to 100 as some users omitted various
questions. The SPSS program written to analyse the data
appears in Appendix D.
6.2. Analysis of Particular Interactions
Appendix E contains some of the analyses done on
particular observed relationships. Table E-1 summarises
the frequency distributions for the four satisfaction indices
explained in Section 5.3. As expected with surveys of this
kind, most of the indices indicate a "middle of the road"
or "indifferent" attitude. The arithmetic means of the
batch, general and overall indices all fall into the category
3.0 - 3.5 ("indifferent" to somewhat "satisfied"), with
standard deviations of approximately 1. The Cande index
mean is slightly lower at 2.5 - 3.0 (somewhat "dissatisfied"
with the interactive service, though how significant this
indication is, requires further investigation, as only 42
out of the 187 users were Cande users. (Further analysis
might reveal for instance, that users of the interactive
service tend to be more experienced or otherwise more
demanding in their expectations. Or else that the
inter-active service per se is less satisfactory than the batch
service).
The breakdown of users into their level of usage of
batch and Cande is indicated in Table E-2. The sample chosen
is seen to consist predominantly of batch-only users (73.8%)
with 20.9% of the users, using both facilities. That is,
94.7% of the respondents made use of the batch services.
Due to this high proportion, i t seemed beneficial to
investigate properties of batch use, such as turnaround,
and breakdowns of batch use by interaction medium or user
status. Table E-3 is a cross-tabulation of the interaction
medium against the batch index. It is interesting to note
that the only users in the lowest category 1.5 - 2.0
(tending to "highly dissatisfied" to "dissatisfied") of the
batch index, are the local batch users. The spread of the
index for local batch users is obviously more on the low
satisfaction side than any of the other categories. An
investigation into the reasons for this dissatisfaction with
local batch would probably involve a follow-up interview to
ask the users which aspects of the batch service were
causing the dissatisfaction.
One interesting observation from the summary of
responses in Appendix
c,
was the frequency distribution foronly 12% of the users were highly dissatisfied and the
distribution was very normal (mean 3.041, skewness -0.176),
nevertheless the 12% represented 20 people who felt very
strongly that the quality of documentation was very low.
It was decided to find out what type of users were
represented in this group of 20. Table E-4 lists the
cross-tabulations of the documentation variable against
user status, computing expenditure and user work type.
It is very apparent that the highly dissatisfied with
documentation users come from the ranks of the academic
staff (they represent 75% of those highly dissatisfied).
The correlation is n9t so obvious for the expenditure or
worktype variables, although we can say that the users
spending $20-$50 per month tend to be more dissatisfied
(52% fall into categories "highly dissatisfied" or
"dissatisfied") than the small or large spenders; and that
dissatisfied users tend to do number crunching, data
processing and computer modelling. Of the 30.4% of users
in categories "highly dissatisfied" and "dissatisfied",
these three types account for 72% of "highly dissatisfied"
users, and 68% of "dissatisfied" users.
(Note: The statistics provided for the cross-tabulation
of status against documentation, substantiate the evidence
that academic staff are very dissatisfied with documentation.
The chi-square value is a representation of whether any
systematic relationship exists between the two variables.
A large chi-square value usually implies a systematic
relationship, while a small chi-square implies statistical
38.87 - a fairly large value. To test whether this is
significant, we look at the significance value provided,
which is 0.0011. This means that the probability of
obtaining this chi-square value or larger, with 16 degrees
of freedom (the number of cases) is less than 0.0011,
i.e. we can conclude that a systematic relationship does
exist between user status and the satisfaction (or otherwise)
of documentation quality. Roughly speaking, for only
1 time out of 1000 would this be due to chance. Hence the
chi-square value is clearly statistically significant at the
7. CONCLUSIONS FROM THIS ANALYSIS
7.1. Implications for the Questionnaire as a Tool
The questionnaire has been most useful in providing ihe
essential data required for investigations of user
satisfaction with the provision of computing services.
The comments made by the users on the format and content of
the questionnaire are summarised in Appendix C. It is
,,
apparent that some abiguities still exist, the main complaint
being that categories are not always mutually exclusive.
These expressions of opinion will enable further improvements
on the questionnaire to be made for future surveys.
7. 2. Implications for the Analysis Technique
There are obviously several more types of interactions
that could be studied from the raw data provided by the
survey. It was not the objective to carry out a detailed
analysis; rather i t was wished to expose and analyse
particular sensitive areas. In this, the analysis technique
has been successful. An extension of the analysis would be
to include a follow-up interview technique to obtain
clarifications and additional data unobtainable from a
general attitude indicator such as the questionnaire.
7. 3. Implications for Broader Investigation
It has become obvious that the survey data has provided
us with a valuable data base, which is able to be processed
in a variety of ways. From this data base, i t is possible
to carry out analyses of various interactions, in order to
of university computing services. It has been possible to
gauge the implications and problems associated with
investigations in this area. It is hoped that research will
continue to develop in measuring effectiveness of computing
services at Canterbury and will extend to a comparative
study of services at all the New Zealand Universities. The
data we have, can show what are the sensitive areas at
Canterbury. The broader study should indicate whether
patterns of satisfaction and dissatisfaction observed
locally, apply more generally. It also may suggest which
of the techniques for providing computing services (in
environments which are in many ways very similar) are
REFERENCES
Alty, J.L. and Coomb, M.J. 1978. The Provision of
Face-to-Face Guidance to Non-Professional Computer
Users in Universities. IUCC Newsletter Vol. 6,
No. 1 , 11-13.
Butcher, H.J. 1965. Sampling in Educational Research
Manchester: The University Press.
Carbonell, J.R. 1969. On Man-Computer Interaction:
A Model and Some Related Issues, IEEE Transactions
on System, Science and Cybernetics Vol. ssc-5, No. 1,
18-26.
Davis, Ruth M. 1966. Man-Machine Communication.
In Annual Review of Information Science and
Technology, Cuadra, C.A. (ed.), Vol. 1,
New York: Wiley, 221-254.
Eason, K.D., Damodaran, L. and Stewart, T.F.M. 1974.
A Survey of Man-Computer Interaction in Commercial
Applications, Report No. LUTERG No. 144, Loughborough:
Department of Human Sciences, University of Technology.
Gold, M.M. 1969. Time-sharing and Batch Processing:
An Experimental Comparison of Their Values in a
Problem-Solving Situation, Communications of the ACM
Vo 1 . 1 2 , No . 5 , May 1 9 6 9 , 2 1 9- 2 5 9 .
Gross, E. 1968. Universities as Organizations: A Research
Approach, American Sociological Review, Vol. 33,
518-545.
Hansen, H.H., Hurwitz, W.N. and Madow, W.G. 1953. Sample
Survey Methods and Theory, Vol. 1: Methods and
Applications, New York: Wiley.
Hansen, J.V. 1976. Man-Machine Communication: An
Experimental Analysis of Heuristic Problem-Solving
Under On-Line and Batch Processing Conditions,
IEEE Transactions on System, Science and Cybernetics,
-=~
Haralambopoulos, G. and Nagy, G. 1977. Profile of a
university computer user community, Int. J. Man-Machine
Studies, Vol. 9, 287-313.
Hunt, E., Diehr, G. and Garnatz, D. 1971. Who are the
users? - An analysis of computer use in a university
computer center. AFIPS Spring Joint Computer
Conference 1971, 231-238.
Jutila, S.T. and Baram, G. 1971. A User-Oriented
Evaluation of a Time-Shared Computer System, IEEE
Transactions on System, Science and Cybernetics,Vol SMC-l,Nu2
Oct . 1 9 7 1 , 3 4 4 - 3 4 9 .
Licklider, J.C.R. 1960. Man-Computer Symbiosis, IRE
Transactions on Human Factors in Electronics,
Vol. HFE-1, March 1960, 4-11.
Mace, A.E. 1964. S~mple-Size Determination,
New York: Reinhold.
McKaskill, T.P. 1977. Unpublished Ph.D. dissertation,
London Graduate School of Business Studies, London.
Mosmann, C.J. 1977. Evaluating Instructional Computing:
Measuring Needs and Resources for Computing in Higher
Education, EDUCOM Monograph Series 2.
Mosmann, C.J. and Stefferud, B. 1971. Campus Computing
Management, DATAMATION March 1, 1971, 20-23.
Nickerson, R.S. 1969. Man-Computer Interaction: A
Challenge for Human Factors Research, IEEE Transactions
on Man-Machine Systems, Vol. _r..1..MS-10, No. 4, part II,
164-180.
'
Nie, N.H., Hull, C.H., Jenkins, Jean G., Steinbrenner, Karin
and Bent, D.H. 1970. Statistical Package for the
Social Sciences (2nd ed.), New York: McGraw-Hill Inc.
Sackman, H. 1970. Man-Computer Problem Solving,
Princeton, N.J.: Auerbach.
Selfridge, R.G. 1973. User Demands vs. User Resources vs.
What They Really Ought to Have?. Closing address on
the ACM-SIGUCC Conference on User Services in Academic
Computing Centers, April 2-5, 1973, SIGUCC Newsletter,
Shackel, B. 1969. Man-Computer Interaction - The
Contribution of the Human Sciences, IEEE Transactions
on Man-Machine Systems, ,Vol. MMS-10, No. 4, 149-163.
Smith, L.B. 1967. A Comparison of Batch Processing and
Instant Turnaround, Communications of the ACM,
Vol. 10, No. 8, 495-500.
Varanelli, A. Jnr. 1978. An Effectiveness Index for Use
in University Computing Management, SIGCSE Bulletin,
Vol. 10, No. 1, 232-238.
Wiste, R.A. 1974. University Computing as a Political
APPENDIX A: A Look at the New Zealand Universities
There are seven universities in New Zealand; their
geographical layout and current machine configurations are
indicated in Fig. A-1. Computing services are provided by
the individual university computer centres. Funding is
now based on submission of quinquennial estimates from each
university to the government, and the subsequent allocation
of block grants. In earlier days, the uneven development
of the computing services at the different campuses was very
much a reflection of the extent to which those universities
were prepared to invest their own funds in computing.
In 1970 the government provided a $3.425M special grant
to the universities to purchase computer equipment and
facilities for the following quinquennium 1970-1974. This
has led to th~ current configurations of B6700 processors
at Auckland, Massey, Victoria, Canterbury and Otago, with
on-line access (originally DC1200 equipment, now PDP11/70
and PDP11/40 respectively) for Waikato and Lincoln. There
was then a deliberate attempt to provide equivalent computer
services to the individual user, whatever his university.
Although the hardware configurations are similar in all
universities, the implementation at the computer centres has
proceeded very autonomously. This has resulted in different
ways of providing services at each university, in areas
such as charging policies, queueing and priority structures,
hours of availability, range of interactive facilities etc.
Hence a unique opportunity has arisen. The universities may
I
I
. I
~
·j
satisfaction, obtained from different ways of providing
'
'J
_-,
'
:.1
NEW ZEALAND UNIVERSITIES
UNIVERSITY OF WAIKATO
ARTS, SCIENCE
PDPll/70
LINCOL~ COLLEGE
AGRICULTURE
PDPll/40
HASSEY UNIVERSITY
ARTS, SCIENCE, VETERINARY SCIENCE, AGRICULTURE
B6700
AUCKLAND UNIVERSITY
ARTS I SCIENCE I
COMMERCE. U.W, FINE
ARTS, ARCHITECTURE,
ENG I NEER ING, MED IC INE
B6700
u.w,
B6700
UNIVERSITY OF CANTERBURY
Figure A-1
UNIVERSITY OF OfAGO
ARTS, SCIENCE1 LAW, COMMERCE, MEDICINE, DENTISTRY
B6700
B6700
0
The New Zealand Universities
100
APPENDIX B: Computing Services offered at the University
of Canterbury
Hardware
Software
B6718 computer
224K words of memory (fast, bulk, planar)
Various peripherals including card readers,
line printers, card punches, paper tape readers,
paper tape punches, VDUs
X-Y plotter
GT44 Graphics system
a wide range of language compilers
statistical and numerical analysis packages
Ancillary support
professional data preparation facilities
RJE stations at Lincoln and Engineering
CANDE interactive services
accounting routines
Human support
duty programmer
Computer Centre staff (28)
computer users' group
departmental liaison officer
Informational support
User's Guide
Newsletter
suggestions book
message of the day
Ansatel service
on-line documentation
APPENDIX C
Questionnaire used and
USER PERSONAL EXPERIENCE
(1) Which one of the following best describes your
status as a user?
(2)
1. Academic staff member
2. Postgraduate student
3. Undergraduate student
4. External user
5. Other {please specify)
.
.
.
. .
.
.
.
. . .
. . . .
.
.
. .
.
. .
Which one of the following best describes your
major purpose for using the computer?
1. Because i t would be impossible to undertake
the work otherwise
2. The work would otherwise be limited in scope
3. To save time and effort
4. The computer itself is an inherent part of
the study
(33%0
(23%)
(26%)
(13%)
(5%)
(33%)
(14%)
(19%)
(33%)
(3) Which one of the following best classifies the major
type of work you do on the computer. If you cannot
decide among alternatives, enter two.
1. Number crunching, i.e. large amount of CPU time
2. Package analysis, i.e. extensive use of statistical
and other packages
3. Data processing, i.e. large amount of I/0 and
information retrieval
4. Developing computer models
5. Teaching,. e.g. CAL
,D
aD
,CD ..
:.:i
(4) How long a period of instruction in computing
have you received?
1. None
2. Less than one week
3. One week - one month
4. One month
-
six months5. Over six months
(5) Where did you receive your instruction (if any)
in computing?
1. Not app~icable
2. Machine company training course
3. Computer Centre service course
4. Self-taught instruction course
5. University unit
(12%)
(13%)
(16%)
(18%)
(41%)
(9%)
(2%)
(8%)
(16%)
(51%)
6. Other (please specify)
···~···(15%)
(6) What -is your average gross expenditure on computing
per month?
1. Less than $5 (28%)
2. $5 - $20 (34%)
3. $20
-
$50 (13%)4. $50 - $100 (8%)
5. Over $100 (10%)
6. Don't know (7%)
.. D
~D
If your use of the computer involves writing programs (as opposed
~* ±o providing data for packages), answer questions (7) and (8).
btherw1se please leave blank.
i
;
*
(7) How do you write your programs?*
1. In collaboration with others (apart from
consultants, etc.)
2. By yourself
(10%)
(70%)
(8) Once your typical program is developed, will i t :
1. Be used repeatedly with different parameters (35%)
and/or data?
2. Have provided the end solu~ion to the problem
and will not be run again?
(32%)
3. Be run again after modification or incorporation(l3%)
with other programs?
(9) Please indicate the extent of your knowledge in the
following languages, and the percentage of your work
done in them.
No
Workable ca12able % work done
Knowled9:e & fluent in this lan9:ua9:e
1. FORTRAN 1 2 3 4 5 , ... 1 l,3
2. ALGOL 1 2 3 4 5 u, I I,.,.,
3. COBOL 1 2 3 4 5 ·,ot- l1,1,
4.
PL/1 1 2 3 4 5':1.8 ~
5. Assembler lang. 1 2 3 4 5 3 ....
(any type) . h.
6. Statistical & 1 2 3 4 5 1 ... I
'-~~
other packages
7. Other lang. (if 1 2 3 4 5 ~2.
applicable)
.
.
.
.
. .
.
. . .
.
.
. .
.
.
*
See Notec
i'o)
Which of the languages in Question 9 did you learnfirst (indicate one from 1 - 7)?
.. D
,qD
~D
L7D
3,D
.~sD
3~0
*30
2
D
USE OF SUPPORT FACILITIES
ill) How do you principally use the computer?
1. By feeding parameters/data into given packages (30%)
2. By writing small procedures or sections to be
added to a supplied program
(5%)
3. By writing entire source programs to solve a (54%)
problem
4. By writing batches of programs to solve a major (11%)
problem
(12) Through which medium do you usually communicate with
the computer?
1. Local batch at Computer Centre
2. Remote through CANOE terminals
3. Remote batch at Lincoln College, Engineering
batch terminals
(62%)
(6%)
(30%)
4.
Give your requirements to someone else, who (2%)interprets them and gives back the desired results
(13) How would you summarise the distribution of your
computing activity over a year?
Very Irregular
1 (13%)
Sporadic Regular
2 (9%) 3 (35%) 4 (27%) 5 (l6%)
(14) Roughly speaking, how often do you consult a Duty Programmer?
Never Yearly Monthly Weekly or more often Daily
1 (18%) 2 (35%) 3 (37%) 4 (l0%) 5 (0%)
(15) How often do you consult reference manuals?
Never Occasionally All the time
Yes No
(16) Do you have a copy of the User's
1 5
Guide?
(54%) (46%)
(17) Do you receive regular copies of
the Newsletter? 1 5
(49%) (51%)
(18) How many User's Group meetings do
you attend per year?
0 1 2 3 4 or more
(19) How do you usually prepare the majority of input
for your programs and data?
1. Use professional data preparation facilities
at the Computer Centre or Lincoln College
2. Do own keypunching
3. Explain your needs to someone else
(51%)
(44%)
( 4%)
'
~ (20) How do you normally receive output for your problems?
·J
1. Pick i t up_from the Computer Centre or batch (81%)
terminal yourself
2. Have i t brought to the department by courier (17%)
3. Receive a report prepared by someone else from (1%)
computer output
,,D
,.D
5~0
If you.have particular conunents about any questions in this section, please add them to those in Question 32.
Highl! dissatis ied
(21) Are you a batch user? If so, how
satisfied are you with:
1. Turnaround time
2. Hours o-f ava.ilabili ty of batch
facilities
3. Present queue and priority
structure
4. Extent to which you are advised
of unscheduled de~ays (due to breakdowns, etc.)
5. Location of batch facilities
(RJE or Centre)
(22) Are you a CANDE user? If so, how
satisfied are you with:
1. Response time for editing
2. Response time for execution of
tasks
3. Hours of availability of CANDE
4. Range of facilities available
5. Ease of obtaining assistance in
case of breakdown during a CANDE session
1 (5%)
1 (5%)
1 (2%)
1 (5%)
1 (2%)
1 (17%)
1 (7%)
l (22%)
1 (7%)
1 (8%)
Neither satisfied nor dissatisfied
2 (28%) 3 (26%)
2 (22%) 3 (26%)
2 (7%) 3 (37%)
2 (l6%) 3 (44%)
2 (l0%) 3 (34%)
2 (23%) 3 (50%)
2 (2l%) 3 (43%)
2 (37%) 3 (15%)
2 (17%) 3 (20%)
2 (13%) 3 (49%)
HiCJhli satisfied
4 (31%) 5 (10%)
4 (28%) 5 (20%)
4 (38%) 5 (17%)
4 (20%) 5 (14%)
4 (27%) 5 (27%)
4 (10%) 5 (0%)
4 (l9%) 5 (10%)
4 (20%) 5 (7%)
4 (37%) 5 (20%)
4 (23%) · 5 (8%)
How satisfied are you with:
( 23) Response of Computer Centre to problems that
you experience (e.g. software bugs, hardware 1 (4%)
breakdowns, supply shortages, etc.)
( 24) Adequacy of the Duty Programmer service 1 (4%)
( 25) Availability of Computer Centre staff 1 (1%)
(26) Quality and administration of data
1 (1%)
preparation facilities
(2 7) Quality of available documentation 1 (12%)
(28) Willingness of Computer Centre to make
1 (2%)
provision for an unusual requirement
(29) The User's Group as a medium of conununicating 1 (2%)
your needs
(30) Adequacy of computing funds to support
1 (2%)
your projects
( 31) Fairness of the charging algorithm 1 (4%)
s
(18%)D
2 (8%) 3 (42~) 4 (27%)
~5
2 (13%) 3 (41%) 4 (30%)
s
(12%)"'D
2 (l0%) 3(40%) 4 (32%)
s
(18%)D
1>1
2 (10%) 3(35%) 4 (25%) 5 (29%)
1,80
2 (19%) 3 (33%) 4 (27%) 5 (9%)
,'io
2 (4%) 3(53%) 4 (25%) 5 (17%)
,oD
2 (7%) 3(83%) 4 (5%) 5 (3%)
,,0
2 (8%) 3(23%) 4 (33%) 5 (34%)
,0
2 (ll%) 3(33%) 4 (28%) 5 (14%)
~D
w
.·I
I (32) GENERAL ASSESSMENT
If you have any additional suggestions or criticisms regarding
the provision of computing services at present, we would be
glad to receive them. It would be helpful if you could list
the characteristics of the Burroughs system and its satellites
under the following
headings:-Helpful/Good/Supportive Frustrating/Unsatisfactory
Various comments were received. The main points are listed
below:-too complicated WFL commands
introductory courses for CANOE and WFL commands would be helpful.
low quality of documentation in general
not enough primers for new users
(33) GENERAL COMMENT
Any other general comments. In particular, if you have any
conunents regarding this questionnaire (format, depth, content,
etc.), we will be pleased to receive them.
The main faults with the questionnaire format are listed
below:-non-mutual exclusivesness of questions 2, 8, 9, 11, 12
question 4 should specify over which time period
question 5 should perhaps included "overseas" as an alternative
more specific questions on particular aspects of the service, e.g. plotter
quality, use of GT44, etc.
THE~E ARE 9 PAGES TO THIS QUESTIONNAIRE. PLEASE CHECK THAT YOU HAVE
.. -:,
Notes on Summary of Questionnaire Responses
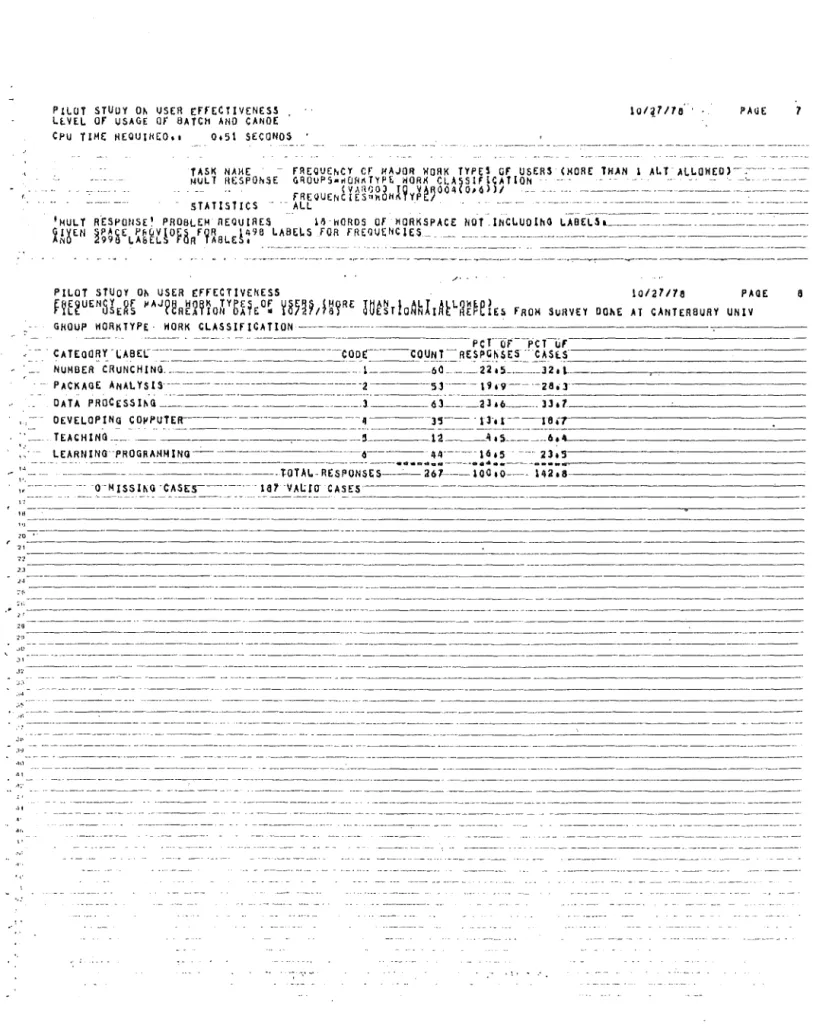
1. Question 3 is the major type of work done on
the computer. As there could be some overlap
of categories, up to two alternatives were allowed.
This is handled by SPSS as a multiple response
question. The frequency distributions, according
to number of responses and number of respondents,
are shown in Table C-1.
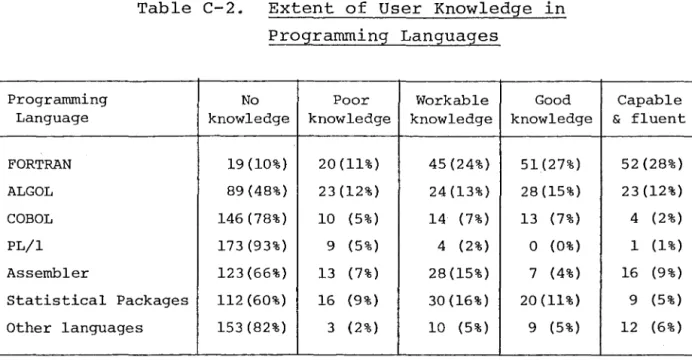
2. Question 9 is the user's current knowledge and
use of various 'programming languages. This was
divided into two sections:
(i) The extent of knowledge in the
programming languages.
(ii) The percentage of present work done
in this language.
The summaries are represented in Tables C-2 and
C-3 respectively.
3. Question 10 is the programming language learnt
first by the user. The distributions are
i
.,
-_,
PtLOT STUDY O~ USER EffECTIVENESS . LEVEL or USAGE or BATCH ANO CANOE CPU TtME HEOU!HE0,1 0,51 SECONDS
1oq_1110' · PAUE 7
TASK NAHE - rRE:QUEhCY er HAJOR WORK TYPES or USERS (MORE THAN 1 ALT ALLOH(D)- .--··-. --
---MULT fl~SPOhSE GROUPS•nOR~TYPo WORK CLASSIFICATION · -· · - · - ·- -· -- ·. -~- ·
-.. f'AEQUEN~H~~~aHnY~~, 004 ' 0 ' 6 ))/ .... -- ... - - - · - - -
---.---s TATIS TICS . - ALL · .. ···- - - .. - -· - - -- ---
· + ~
-I HULT R°ESPOIISE! PROBLEM REQUIRES 18-WORDS Of WORKSPACE NOT .lNCLUOlhG l . A B E L h - - - · - - - ·
X~~EN ~~~ gEL~g~n
Oro/9~aLd
~96 __ L_A~E_L_s_ ~~R-fR[QtJENCIE~:::__:::--_·::::.::_~==----~---=---·----/ ' -'
PILOT STUDY O~ USER EffECTlVENESS 10/27/78 PAGE 6
~~E~UEN8~ER~ ~AJ~~R~~~~o~yb~~Eo~ ~87~~,~~9RE
JUt~rlo~~l1AtL~~FelE~
fROM SURVEY DOhE AT CANTERBURY UNIV GHOUP WORK TYPE· HOAK CLASSlflCATlON ---·--- - --- -- ·- ·· --- · Pcr·-or--Pc
y-·u,
-- . CATEOO~~
-LABEC::::=-__::::-_::::-.--::::-·----·---~QO_C--'C_O_Ll~_L=RE~P~~SE~_.:_-_£~SE.S---·---==---NUMBER CRUNCHING _______________________ l - - - 6 L - . - 2 2 , s _ . _____ J 2 e l ,
--- PACKAGE ANALYsis---· -2 5 3 1 9 , 9 · 2 e , 3 ·
-DATA PROCESS lh-<i
~===--~---=~~---=-~=1·----6·3~~=3l
•6~~--- Jl, 7 __ _DEVELOPING CO~PUTE'1" ___________________ 4 -35-- · n·, r----re •
.. - - - --··- - - -- - -
---TEACH tN(l ___ - - - 5 12 ____ .\,:; ______ t,,,L__
LEARNING'PROGRAMMINo---·--·---0--- 44·----·1615 · ---- 2 3 ,
-- -- -- -- ---·-·---·--
....
---~····---..,---··--- - - - 'J'.OT AL.- RESPONSE'S--- 3 6 l'---too 10--· l 4 2 • 8
>--- ---
0 ·MISSiliG 'CASE'.r--- · 107 ·VAl.;IlT CASES- - - · - - - -- - - -- -
-•• 20 '
21
2J
·
-· - - - - -· - · - - - · - - · - - - · ~ - - - ·---·----
---·--- - - - -- - - ---· - - - ---
-J~·
- - ---
---· ---~---·---·
·
·
---·---
-· - - - -· - -· - - -· -· -- - - · - - --··---
-.. - - · - - - . - - - · - · · - - - · - - - -· ·
-- -- -- -- -- -- -- -- -- -- -- · -- · · ·
---";'"'" ' ~ '
Table C-2. Extent of User Knowledge in '
Programming Languages
Programming No Poor Workable Good
Language knowledge knowledge knowledge knowledge
FORTRAN 19 (10%) 20 (11%) 45(24%) 51 (27%)
ALGOL 89 (48%) 23(12%) 24 (13%) 28 (15%)
COBOL 146(78%) 10 (5%) 14 (7%) 13 (7%)
PL/1 173 (93%) 9 (5%) 4 (2%) 0 (0%)
Assembler 123 (66%) 13 (7%) 28(15%) 7 (4%)
Statistical Packages 112 (60%) 16 (9%) 30(16%) 20 (11%)
Other languages 153 (82%) 3 (2%) 10 (5%) 9 (5%)
Table C-3. Percentage of Present Work Done in
Programming Languages
Programming No work
Language done 1-25% 26-50% 51-75% 76-99%
FORTRAN 42(23%) 40(21%) 27(14%) 9 (5%) 24(13%)
ALGOL 113(60%) 21 (11%) 15 (8%) 22 (12%) 10 (5%)
COBOL 161 (86%) 15 (8%) 8 (4%) 0 (0%) 1 (1%)
PL/1 185(99%) 2 (1%) 0 0 0
Assembler 153(82%) 30(16%) 1 (~%) 2 (1%) 1 (\%)
Stats. Packages 126 (67%) 26 ( 14%) 6 (3%) 3 (2%) 11 (6%)
Other languages 170(91%) 10 (5%) 3 ( 2%) 4 (2%) 0
Capable & fluent
52(28%)
23 (12%)
4 (2%)
1 (1%)
16 (9%)
9 (5%)
12 (6%)
100%
45(24%)
6 (3%)
2 (1%)
0
0
15 (8%)
APPENDIX D
:
-..;
-"
_J
SPSS FOR ~6700, VERSION H, REL.EASE 7121 LEVEL i2,001,0281005
CE.FAULT Sp ACE Al.LOCATION,, --. --ALLOWS FOR, t ---50 -TR ANSFORMA Tl Oh S
hCR~Si'ACE . - 17500 WORDS --- .. 400 RECODE VAL.LIES • LAG V , A R 1 A B L . E S ~
-THA1'SPACE 2500 WORDS _______________ 600 _If/COMPUTE OPERAT_ION_S __
PAGESIZE--- --70 - - - --- --- -- -
--RUN NAME ---- PILOT STUDY ON USER EFFECTIVEhESL . . . _ - - -
---rILE NAME USERS, QUESTIONNAIRE REPLIES FkOM SURV~Y OCNE AT CAhTERBURY UNIV _ _ _ _ _ _
I~PUT MEDIUM" CARO - - - -- - - -
-VAR!ASLE LIST SVCUDE,STATUS,PURPOS,YAR003 lC VAR053 - -
-INPUT FORMAT .. FIXED (F6,019Fl,O,F3,0,Fl,O,F3,0,F1101f310,Fl,Q1F31Q 1 F l t 0 1 F 3 o 0 1
-F1,0,F310,Fl,O,F3,0,Fl,0,30Fl,~)
- - - . -
-·---ACCORDING TO YOUR INPUT FORMAT• VARIABLES ARE TO -BE~REAO-AS.f"OLLOkS
VARIABL.E FORMAT "RECORD --- - COL.LIMNS
--- --- - --- svcooe: F --6,
STATUS F l,
PtJR?OS f l. VAR003 F l I
VAR004 f l •
VA~OOS F 1,
V~_R006 f l.
VAR007 F l I
YAROC8 --- F
l:
VAR009 __ F VAROlO F' 3 I --- V ARO 11 - - f 1 I0 1 1•. 6
-8
f
~=
~-0 - 1 9 • 9 · - ----0 -- - --- l 10- 10---0 -- --- _ 1 --- 1 1 • l l
a 1 12· 12
0 ---1---13- · 1J --
---0---1----14-- 14
g
- - - - 1 - -ii: --
i~
----V~R012 ---- F 3 •
0 1 · 19• 19
-0 - - - 1 - - - - -20•. 22
-VA HOU f 1,
VAH0l4 F
I
IVAR015 F '
0 _____ 1 ____ 23- 23
8 --- l-- H: -H
---_______ _ ____ ~!~8H
, r'
a ---1---- 2s· 30-f I
VAROlS f 3•
--- --- --- YAR019 F l I
~!~8~~ ~
r:
VAR022 F 3 I
VAR023
0 ______ L. ___ 31• _ 31 _
O l 32• 34
0 - - - - 1 ---- 35• 35
-8 -~- =::-1 -~-::
~$:H
8 --- l - :g: H
,"'
-
~l:
--- VAR024
---··--- --- VAR025 F 11
F l I
g
-===l=t~=:-:~_-_--:_-_-_-_-______
---
~·--- -- ·- VAR026 VAR027 F l I
--- ---·--- VA~023 - F l.
VAR029 I' l.
VAH030 f l.
YAROJI - f l.
VAHOF F
l'
VA~O 3 F '
YAR034 f l I ---·--- YAR035 F 11
- - - · VA AO 36 F l•
VAR037 F l.
VAR038 F'
l:
VA~039 - F - - ----·---· --·-· - VAR040 - F l I
VAR04l F l I VAR042 F l •
VAR043 F 11
0 1 46• 46 .
0 --- 1 --- 47 • 4 7 - - -
0 148• 48
-g --
-t - .
~~=;g
---0 - - 1 - 51· 51 -0 - ---- 1 - - 52• s2
0 _____ l --- 53• 53
-0 1 54• 54
0 - - - 1-·- 55• SS
-0 - - - - 1 - - 56• 56 0 1 57• _ 5 7
-8----l-- 5~:
§~ - - - -c
0 - - -l - - 60- -60
0 _ _ _ 1.__01• 61
-0 1 62· 62
0 ----1- 63• 63
"' --; .., "'" ,, --.:: <:i c:- ;:-.: .::.
-
-· ..;;_ ..;;_ .:; :'. '::.- --·· --- --- ACCORD ING-TO-YOUR ·INPUT- FORMAT
,--VARlA8LES-ARE-TO-eE-REA!rAS-FOLLOlls---. ___________ VARIABLE FORMAT __ -REC ORO _:_::_~COLUMNS --- ·-- - - r
--- - · VAR044 -- f l • 0 ·· --- · -1 ·- ··-64•--· 64 - ·
- - - · V AR045 ---F l • 0---· ---1 ---65• 65 -VAR04~ f l • 0 ______ L__ 66• 66
~~~g~ 8 ---~
1:
g
----l---
g~: -· g~
~:~2~z ---
~1:
g--
1 ---
n:
n
---VAR051 F l, 0 l 71• 71
r-VAR052 f li O l 72• 72 ··--- ---·
---VAR053 - F le O · ---- 1 --- 73• 73 ··- - -
-T,iE I/,PUT FOR~AT PROVIDES FOR 54 VARIABLES, - . 54 WILL BE -READ______ - --- - - - ---- - - _.
IT PROVIDES fcw·-1 REC OROS. ( 1 CARDS 1 ) PER CAse:-.---· A MAXIMUM-of---73-I COLUMN~_:-ARE .. --USED-·orr rRECOR_D_,_-_ _ _ _ _ _ _ _ _ _ _ _ _ _
____ _ N OF CASES _ . . 167 ..
-VAR LABELS SVCODE SURVEY CODE/
ST A TUS USER CLASS If'ICAT I ON/ - -··· ---· PURPOS PURPOSE FOR USING COMF~TER/
V,RC03 MAJCR ~CRK HP~ ALT 1/ . . . ····-- ____ _
~1~~g~ ~~~~§DWtfK1~g~u~~io~' IN COMPUTING/______________
-v ~R·J06 PUCE Uf INSIRUCT ~UN Ii', CUMPUT!NO/
-VA?.007 AvER4GE COMPU1!NG ~xFEhO, PER.M~NTH/ _ _ _ _ _ _ _ _ _ _ _ _ _ _ _ _ _ _ _ _ _ _ VARv08 PROGHAM hRITING METHOC/
VAR009 PROGRAM PURPOSE/ ---- ---
---VAROlO FORTRAN >WRK I I - --·
--- .. --- --- - - - VAROll AMOUNT FORTRAN KNOWLECGE/_____ -VAROl2 ALGCL aO~K 1 I
·vAR013 AMOUNT ALGOL KNOW~ECGE/-
---~----V,ROl4 COBOL WOHK 1 I ·
-- -- -- -- -- --- VARul5 AHOuNT f.080L KNCWLECGE/.
VAROl6 PLl "ORK l I
VAROl7 AMOUliT f'Ll KNO~LEDGE/
---VAR018 ASSC:MbLE~ wO~" ~ I - - - · ·
VAR019 A~OUNT ASSE~BLER Ki',C~I.EOGE/ _____
---V~R020 STATS PACKAGE hORK ~ I
VAR02l AHOUNT 5TATS PACKAGE
KhOWI.ECGE/·--- KhOWI.ECGE/·--- VARv22 OTHER L..-\NGS li I
- ---
---·-VARU23 AMOUNT UTHER LANG K N O • I . E O G E / -VAR024 LANGUAGE LEARNT FIRST/
. VAR025 MODE Of COMPUTER USE/ . VAR026 MEDIUM OF COMMUNICAlICh/ · -VAR027 DISTRIBUTION or COMPUTING ACTlVlTY/
VARu28 DUTT PROGRAMMER USE/
VAR029 REF"ERO,CE ).(AN UAL USE/ . . ---
-~=~8??
~B~r~IEDJ 2~~iE,TTEH/---VARo32 ATTEND USERS G~OUP ~EEl!N~S/
VAR033 INPUT PHEPARATION MOOE/
VAR03~ OUTPUT COLLECT!ON MOOE/ ·
---VAR035 BATCH Tl!HNAROUND TIME/ -
-VAR036 HOURS Of BATCH AVAILAeI~ITY/ VAR037 BATCH QUEUE & PRIORITY/ .
;J
"'
VAR038 UNSCHEDULED BATCH DELAYI/
-VAR039 LOCATlO~ or BATCH FAC,l.lTlES/
VAR040 CANBE EDITING REsPgNs JIME/ - - -
CC-VAR042 HOURS OF CANOE AVAILA8 LITT/
VAR041 CAN E TASK EXECUTI N
lMU
·--VAR043 CANCE RANGE OF FACILIT lS/ . -VAR044 EASE Of UBTAINI~G CANC A5SISTANC~/ VAR045 RESPONSZ: OF CC TO PHQdL~MS/ .-VAR046 ADEQUACY OF DUTT PRWG
StRVICE/-VAR047 AVAILABILITY Or CC STAFF/ ..
-VAR048 DATA PRtPARATION f"ACIL!TIES/