A Recommendation
for the Future SCADA User Interface for the PWS
The analysis and design of the SCADA visualization and job assistance features for DMT’s Pressurized Water Scrubber
Bachelor Thesis Egbert Janssens s0184500 July 2013
University of Twente Faculty of Engineering Technology Industrial Design Engineering
Post office box 217 7500 AE Enschede The Netherlands
Dirkse Milieutechnologie BV.
Yndustrywei 3 8501 SN Joure The Netherlands
Mentor at University of Twente Ir. M.E. Toxopeus
Chairman of the exam committee Dr. Ir. M.B. de Rooij
Summary
DMT Environmental Technology BV. (Joure, the Netherlands) is active in the field of environmental engineering. One of their products is the PWS
(Pressurized Water Scrubber) to upgrade biogas. Each PWS plant can be controlled by a SCADA user interface. Currently there is a different user interface for each PWS and users often have a hard time performing their tasks with it. The UI’s are very user-unfriendly and give users access to any setting the interface provides. This could result in undesirable errors that have a negative effect on the overall performance of the biogas upgrading process. The current user interface also lacks functionality to improve the ease of and communication between all users.
The report offers a recommendation for redesign of the PWS SCADA user interface. To support this recommendation an example of how the interface could be designed has been used. Implementing this redesign
recommendation will greatly improve the ease for all users.
One of the new aspects of the redesign is the usage of different user levels to restrict the possibilities of different types of users and to ensure safety. To control the interface it is required that users authenticate themselves. Once authenticated users can control the PWS or change any of the alarm or PID settings. The level of complexity a user has is dependant on the user level of a user. The SCADA system also uses a users username as input for several job assistance features like the data log and the chat and print screen function.
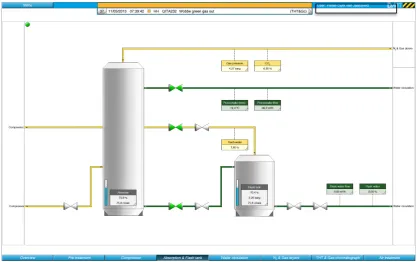
The plants overview page shows all information a user needs to read the PWS process and gives the opportunity to make adjustments to the control settings. The representation is as minimal and as clean as possible. All PWS elements are aligned to a grid and the orientation of the process is presented logically.
The subsystem pages provide full information with all concerning PWS parts and parameters. The build-up of subsystems is consistent to the overview page, keeping all screens as clean as possible to retain comprehensibility.
The redesign stimulates the use of (European) standards. Using standard parts and applying the NEN standard for the colouring of pipelines ensures consistency within the interface and also between the interfaces of all PWS plants DMT offers in the future.
The recommendation improves and implements new features to ease the user and improve their performance. A user does not have to search an entire screen for the exact location of an alarm because the alarm bar offers the option to jump to this location by clicking a single button. The user interface shows the general state of the entire plant as well as the state of individual subsystems to keep the user informed at all times. It is also possible to simulate specific parameters and check their behaviour. Simulated parameters will be presented different from normal process
parameters. This report defines all kind of job assistance features to improve the future PWS user interface.
Samenvatting
Dirkse Milieutechnologie BV. In Joure is een bedrijf dat zich onder andere richt op het maken van producten voor het creëren van biogas. Een van deze producten is de complexe PWS (Pressurized Water Scrubber). Elke PWS installatie wordt bediend door middel van een SCADA user interface. Op het moment wordt er voor elke PWS een ander bedieningspaneel gebruikt. Daarnaast is de bediening erg ongebruiksvriendelijk en geeft de gebruiker volledige vrijheid in bediening. Dit heeft als resultaat dat er vaak ongewenste fouten worden gemaakt met een negatief effect op de algehele prestatie van het maken van het biogas.
Daarnaast ontbreekt er functionaliteit om het gebruiksgemak van de gebruiker zowel als de communicatie tussen gebruikers te verhogen.
Dit rapport biedt een aanbeveling voor het herontwerp van de user interface. Dit wordt ondersteund met een uitgebreid voorbeeld van hoe de toekomstige interface ontworpen zou kunnen worden. Het toepassen van de aanbeveling zal het gebruiksgemak voor alle gebruikers sterk verbeteren.
Het herontwerp ondersteunt meerdere user levels om gebruikers te beperken in veiligheid te waarborgen. Om de interface te kunnen bedienen en toegang te krijgen tot de regel instellingen en functies is het vereist om in te loggen. Hoeveel rechten een gebruiker heeft is afhankelijk van het user level van deze gebruiker. Het inloggen is tevens vereist voor enkele toegevoegde functies binnen de interface zoals de print screen functie, chat functie en de data log.
De volledige overzichtsweergave van de installatie is afgestemd op wat gebruikers moeten kunnen aflezen en waar basis gebruikers aanpassingen in kunnen maken. Deze weergave is zo minimaal – zo schoon – mogelijk gehouden. Alle onderdelen zijn uitgelijnd en de oriëntatie van het proces wordt logisch gepresenteerd.
De verschillende subsysteem schermen tonen een volledig overzicht met alle bijbehorende PWS onderdelen en parameter schermen. De opbouw van deze weergave is gelijk aan die van het overzicht. Dit houdt alle schermen zo overzichtelijk mogelijk en zorgt voor een begrijpelijke representatie.
Dit rapport stimuleert het gebruik van standaarden voor het interface
ontwerp. Standaard onderdelen zorgen en het toepassen van de NEN norm voor kleurcodering van pijpleidingen zorgen voor consistentie binnen een interface maar ook tussen de interfaces van verschillende installaties.
De aanbeveling verbetert en implementeert nieuwe functies om het de gebruiker gemakkelijker te maken. Een gebruiker hoeft de schermen niet meer af te zoeken naar alarmen aangezien de alarm balk een knop geeft om direct naar de exacte locatie te springen. De interface laat de huidige status van zowel het hele proces als individuele subsystemen zien en geeft de mogelijkheid om parameter instellingen te simuleren. Het rapport beschrijft naast de bovenstaande functies nog meer nieuwe of verbeterde functies om het gebruiksgemak voor alles gebruikers te vergroten.
Preface
Executing this project for Dirkse Milieutechnologie BV has been a great and valuable experience. The people in Joure as well as at the customers in Zwolle in Wijster were always very kind and willing to help but from time to time were critical as well.
Generally my project went pretty smooth although the first couple of weeks were very chaotic. The underlying process knowledge was missing therefore it took a couple of weeks in order to understand the PWS process. The inclusion of this knowledge was required in order to understand the issues of the current user interface, users and to start tackling this project.
During the project I got confronted with my own planning. At first I planned the analysis phase way shorter. During the first weeks I already noticed this phase always requires more time than expected. Future projects will definitely be planned more realistic and the analysis topics require more preparation in order to decrease some of the time it will take.
Besides planning my own work I have also learned it is important to make appointments well in advance. Everyone at DMT was very busy while I was not full time in Joure whereby it was sometimes hard to plan a meeting.
On a positive note, I am very satisfied with the result I have created. Although there is always room for improvement, I have surely pointed DMT in the right direction in order to greatly improve the future PWS user interface.
I would like to thank everyone who provided me assistance during my project. The following people I would like to thanks in particular:
Jort Langerak, for being my mentor at DMT and guiding me throughout the entire project, providing important information about the PWS and customer experience.
Marten Toxopeus, for being my mentor at the University of Twente, guiding me throughout the entire project and for a cheerful conversation every now and then.
Contents
1. Introduction ... 7
2. Background ... 8
2.1. About DMT ... 8
2.2. DMT Services ... 9
2.3. DMT Products ... 9
2.3.1. Origin of biogas ... 9
2.3.2. The PWS ... 10
2.4. General SCADA user interface analysis ... 11
3. Problem description & research approach ... 14
4. Analysis phase ... 15
4.1. Usage Analysis of the current user interface ... 15
4.1.1. Low-end user basic task description ... 15
4.1.2. High-end user basic task description ... 16
4.1.3. Usage analysis summarized ... 17
4.2. Current PWS SCADA User Interface ... 17
4.2.1. Overview layout and functionality ... 17
4.2.2. Subsystem layout and functionality ... 20
4.2.3. Global interface functionality ... 21
5. Design fundamentals ... 23
5.1. User profiles ... 23
5.2. Hardware restrictions ... 23
5.3. Usability heuristics of Nielsen ... 24
5.4. Specific SCADA interface guidelines ... 25
6. Desired features ... 26
6.1. Functional requirements ... 26
6.2. SCADA user interface requirements ... 27
7. Conceptual design phase ... 30
7.1. Connecting to the server ... 30
7.2. Controlling the user interface ... 30
7.3. User interface components ... 30
7.4. Design preparations ... 31
7.4.1. Parameter settings ... 31
7.4.2. Alarm settings ... 31
7.4.3. Alarm severity ... 31
7.4.4. PID settings ... 32
7.4.5. User levels ... 33
8. Final concept design ... 35
8.1. Framework ... 35
8.1.1. Top frame: menu ... 35
8.1.2. Top frame: state bar ... 36
8.1.3. Top frame: alarm bar ... 37
8.1.4. Top frame: current user ... 38
8.1.5. Top frame: DMT logo and frame colour ... 38
8.1.6. Top frame: quick stop ... 38
8.1.7. Bottom frame: navigation buttons ... 39
8.2. Framework decisions ... 39
8.2.1. Subsystem division ... 39
8.2.2. Non-parameter frame visualization and composition ... 39
8.2.3. Parameter and part frame visualization and composition ... 40
8.2.4. Subsystem abbreviations ... 40
8.3. PWS representation ... 40
8.3.1. PWS vessels ... 40
8.3.2. Other components ... 41
8.3.3. Valves, compressors and motor ... 41
8.3.4. Pipes ... 43
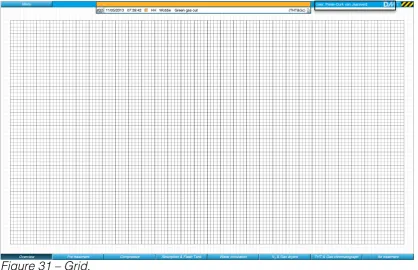
8.3.6. Grid ... 45
8.4. PWS Overview page ... 46
8.5. PWS Subsystem page ... 48
8.6. Job assistance features ... 49
8.6.1. Alarm history ... 49
8.6.2. Alarm settings ... 50
8.6.3. Chat ... 51
8.5.4. Data log ... 52
8.6.5. Parameter list ... 53
8.6.6 Trend module ... 56
8.6.7. Change user ... 56
8.6.8. General PWS control ... 57
8.6.9. Print screen ... 57
8.6.10. Quit ... 57
9. Verification of requirements ... 58
9.1 Functional requirements evaluation ... 58
10. Comparison ... 60
10.1. General UI improvements ... 60
10.2. Job assistance improvements ... 61
11. Conclusion ... 63
12. Recommendations ... 64
13. List of sources ... 66
Appendix A – Functional requirements evaluation ... 67
Appendix B – Large user interface images ... 70
Appendix C – Example of the design process ... 80
Appendix D – Style sheet ... 89
1. Introduction
Dirkse Milieutechnologie BV. is active in the field of environmental engineering. One of the main products DMT offers customers is the
Pressurized Water Scrubber (PWS) to upgrade biogas to a high standard. The PWS can be controlled by a SCADA user interface and each PWS has its own way of controlling.
DMT offered the project to write a recommendation for the redesign of the SCADA user interface of the PWS to improve the overall ease for the user.
One of the aspects of this redesign project is the analysis of the interfaces that are currently used and – even more important – the users of these interfaces. Besides this analysis one of the other key aspects is the improvement of current and implementing new job assistance features to ease the user during the execution of their tasks.
One of the most important design principles to support the recommendation for redesign comes from Nielsen (Nielsen & Mack, 1994). Those usability heuristics for user interface design serve as a great guideline in order to create a successful user interface.
During redesign it is also kept in mind that users are very bound to habits. In this case the habits concerning the use of other computer software influence the design decisions made for the redesign. Using those habits in the
redesign will make it easier to learn a new interface.
2. Background
This chapter contains background information concerning the company DMT and their products. This will be followed by general information about SCADA systems.
2.1. About DMT
DMT (Dirkse Milieutechnologie BV) was founded in 1987 by Rob Dirkse and is now owned by Erwin Dirkse. The company is located in Joure, a village in the northern Netherlands. Just as every human being, every organization has its mission in life and unique talents no other company has. The organization’s talents, skills, background and products determine its Purpose for Existing. The five most important matters DMT Environmental Technology BV (DMT) aims to achieve follow almost naturally from this. These five matters are called the Big Five (for Life). Everything DMT does is connected to the Purpose for Existing and the Big Five (for Life).
Figure 1 – DMT’s office in Joure.
DMT’s Big Five for Life:
1. DMT aims to clearly distinguish itself from its competitors by continuous development, acquisition and the realization of innovative and sustainable solutions in environmental technology.
2. DMT offers its clients high-grade and sustainable solutions that represent social responsibility and good entrepreneurship with a foundation of professionalism, high quality and integrity.
3. With its products and services, DMT aims to contribute positively to the needs of its clients, thus improving the quality of life on this planet, the success of the company and the interests of its stakeholders.
4. DMT consists of a team of enthusiastic employees who strive to continually improve themselves through work experience and training. DMT offers a challenging and stimulating work environment, especially for Dutch and foreign high achievers.
5. DMT sees co-operation with other organizations and the exchange of knowledge as essential for offering total solutions to the market. These solutions are sold worldwide through a network of agents, distributors and partners.
throughout the world on a daily basis in order to resolve questions together with our clients.
2.2. DMT Services
DMT is active in the field of environmental engineering and contracting. Since the beginning our target has been to realize environmental projects for many applications.
DMT’s knowledge and years of experience made the company a professional partner for industries and governmental institutions. Experts analyse the problem and advise the customer which solution is best. Client minded searching for new solutions and possibilities; a clear concept in which DMT combines the search for technical intelligent solutions with an efficient and therefore competitive way of project realization.
Clients are contracting the specialists of DMT environmental Technology for a very wide range of environmental problems. DMT offers the following services:
- Research, development, consultancy and design - Engineering and Contracting
- Rental of equipment and installations - Service and maintenance
- Pilot testing
- Equipment and projects - Pilot research
- Engineering and project realisation - Replacing of (tower) fills
- Safe disposal of residual substances - Optimization of purification plants - Improvements of purification methods - Airflow and odour measurements
2.3. DMT Products
DMT offers various products for (bio)gas, water or air treatment. The following section provides some background information about biogas and biogas upgrading with the Pressurized Water Scrubber (PWS).
2.3.1. Origin of biogas
Biogas can be produced in different ways. A first option is as a result of landfill, which produces biogas by nature. A second option is collecting biogas by the digestion of biodegradable waste like biomass, manure or organic waste. Biogas created from digestion mostly consists of methane and carbon dioxide but depends on the digested mass. Table 1 shows the composition of biogas.
Substances Percentage (%)
Methane (CH4) 55 – 75
Carbon dioxide (CO2) 25 – 45
Nitrogen (N2) 0 – 0,3
Hydrogen (H2) 1 – 5
Hydrogen Sulphide (H2S) 0,1 – 0,5
Other Traces
Table 1 – Biogas composition
The downside of raw biogas is that it contains less methane than natural gas, resulting in a lower energetic value of the gas. Raw biogas also contains a lot of other substances that have a negative effect on the energetic value of the gas.
Cleaning biogas is also called upgrading biogas. The process of upgrading biogas removes harmful substances and lowers the percentage CO2 in the biogas composition. The quality of biogas is expressed by the Wobbe index. Gasses with equal Wobbe index give an equal energetic value on a specified gas burner.
Upgrading biogas can be realised through different treatments. The first kind treatment involves washing the gas with water or chemicals. Other treatments split different gas substances using membranes or adsorption of carbon dioxide under pressure.
2.3.2. The PWS
Treating biogas with the PWS method does not use any chemicals and supports low implementation- and maintenance costs with respect to other upgrading techniques. The following section describes the general process and different stages of the PWS. An impression of the PWS plant is shown in figure 2.
Figure 2 – PWS Plant from the outside. Biogas pre-treatment:
In this phase raw biogas is put under pressure up to 8-10 bar as preparation for the second phase.
Water circulation:
[image:10.595.91.282.359.561.2]air treatment phase and the regenerated water will be used again to wash raw biogas.
Biogas post-treatment:
The gas flow coming from the scrubber (water circulation phase) will pass a carbon filter to remove small traces of hydrogen sulphide and organic chemicals. After this filter the washed biogas contains a lot of water. To remove the water, the gas is being dried in a gas dryer. After the gas is being dried it will pass a HEPA filter where bacteria and dust will be removed. Thereafter the gas quality will be checked and nitrogen will be injected. The reason for the nitrogen injection is the high percentage of methane in the gas composition. This percentage is higher than the precondition for Gronings gas - the Dutch quality standard for gas. The gas chromatograph checks the final composition of the gas. If the composition of the gas is right the Wobbe index will show a number between 43,46 and 44,41. The final step is the injection of THT (tetrahydrothiophene) that will add the odour of the gas. Naturally the gas is odourless which can cause dangerous situations.
2.4. General SCADA user interface analysis
The PWS plant will be operated by a SCADA system. SCADA is an abbreviation of Supervisory Control and Data Acquisition and is the gathering, forwarding, processing and visualizing of measure and control signals of industrial plants. A SCADA system uses a computer where SCADA software is installed on. This software eases the exchange and visualisation of plant data for human operators. Besides data exchange and visualisation the plant can also be controlled using the user interface the SCADA software provides. Operating the user interface goes with computer mouse and keyboard. A SCADA system can be split in to two parts:
1: Supervisory Control:
2: Data Acquisition:
The second part of the SCADA system gathers, forwards, processes and saves all process data and serves as input for process reports. Those reports will be analysed to optimize and improve the plant.
The SCADA system communicates with the PLC, controllers and other electronics within the plant. The system can read process data, give commands and change parameters whereby a SCADA system regulates itself.
Figure 3 – SCADA user interface example 1.
The plant will be schematically presented on the computer screen using different kind of graphic elements with different functions – creating the user interface of the plant (Fig. 3 & Fig. 4). The plant can be controlled and managed using this user interface. The control philosophy and alarm monitoring is beyond basic user interface level (i.e. on programming level) and determines what can be controlled, when an alarm occurs and many other safeties. Handling protocols, data storage, reporting and communicating are other typical functions a SCADA system can offer.
A SCADA system works with different levels of complexity to which user groups are linked. Each user group has different rights within the SCADA system (user interface).
The SCADA software will be installed on (multiple) server computers dedicated to the plant. Users can gain access to the user interface by using remote connect software and require an internet connection. Whenever there is a problem with the internet or the server computer it is impossible to control the plant.
For more information about SCADA systems, see http://www.tech-faq.com/scada.html
Source figure 3: http://electro-repair-indo.blogspot.nl/2012/12/operator-interface.html
3. Problem description & research approach
Dirkse Milieutechniek (DMT) in Joure – The Netherlands – is active in the field of environmental engineering and contracting. One of their main products is the Pressurized Water Scrubber (PWS) to upgrade raw biogas to the level of natural biogas.
Renewable energy is becoming increasingly popular and most of all of particularly great importance in the future. The PWS contributes to the generation of green gas that can be used in households, industry and many more applications. Over the years the PWS installation has become increasingly complex. Operators have to be able to manage and analyse large data streams and if necessary intervene in the process by changing certain parameters through a SCADA user interface (control panel). Currently there is no standard user interface that is being used for the installation. The interfaces that are currently used are – especially for operators – too complex.
Every customer has different guidelines and requirements and therefore every user interface is completely different. DMT holds a vision where future PWS installations provide the same user interface – possibly with minimal adjustments because every PWS installation is a little different. The basic user interface functionality and visualization must be the same for every future PWS. Functionality (user interface features) and visualization are two main components the user interface consists of.
The first aspect to this vision is to adapt the visualization of the user interface to the user group. There are different user groups with a wide range of user characteristics. DMT believes that a solid user and usage analysis will provide useful input for the future representation. Optimizing the visualization will increase the productivity, ease the user in their daily work and make the job more satisfying to perform. But more importantly, new or inexperienced users will be motivated, willing to learn and it will decrease the time to learn how to execute their task with the user interface.
The second aspect is implementing useful features that will assist users in executing their task. DMT believes that much more could be accomplished in the way of implementing job assistance features to the user interface. These features would decrease the difficulty of managing and analysing large data streams the PWS contains and clarifies when the user has to intervene in the process. Providing job assistance features will add new functionality and will optimize current functions the SCADA interface has to offer.
4. Analysis phase
In the analysis phase a lot of information concerning the current users, usage and user interface will be gathered. In the end this information will lead to the preparation of the desired features and wishes for the redesign of the PWS user interface. The analysis phase starts off with an analysis of the usage and users of the currently used PWS interfaces followed by the analysis of the current user interface. Findings of both analyses are included in this section.
4.1. Usage Analysis of the current user interface
To get the best possible input about the current user interface multiple interviews have been conducted with both low and high-end users. The purpose of the interview is to find the basic way of work with the interface, difficulties experienced while carrying out their tasks and to discover all thoughts and wishes for task assistance features.
The low-end user group consists of (head) operators at the plant in Zwolle (Rova). DMT (service) engineers are part of the high-end user group.
The findings of the interview with low-end users are summarized below. 4.1.1. Low-end user basic task description
An operator’s function is to monitor the state of the PWS using the PWS SCADA user interface. This interface shows different kind of information including a schematic representation of the PWS, (important) data and occurring alarms. Besides the current state it is also possible to retrieve data from the past.
When the PWS runs steady an operator just has to monitor user interface in the overview screen. At the start of their shift they write the most important parameters down in a paper archive. Whenever an error occurs it is stated in the alarm bar and it is an operators’ task to locate the position of the alarm and research what is wrong. Experience learned that the PWS usually will regulate itself and the alarm will be solved in a short amount of time. If not, an operator has access to all parameter settings and will try to solve the problem by making some changes in one of the PLC settings. Most of the times operators have too little process knowledge to solve the alarms themselves. As a result DMT will be contacted (by phone) to solve the problem.
Every now and then an operator has to start or stop the installation or change the control settings of individual subsystems. To do so they can simply click on the different control options the user interface offers.
Before an operator starts to work with the interface they will get a short course about the biogas upgrading process and a guided course where the basic usability tasks with the interface will be taught. It is important to note that those courses usually are too short and operators have trouble understanding them.
Difficulties experienced:
- Operators have access to all parameters on one hand but too little process knowledge on the other hand. This might result in even more issues while trying to solve an outstanding alarm. Another result could be that the right parameter to change could not be found due to the massive amount of options an operator has.
- Operators have a hard time locating the position of the alarm. Although alarm bar does inform the user about the subsystem the alarm is located in, users still have a hard time finding the exact location of the alarm. This is mainly caused by the chaotic representation of the PWS and the minimal visualisation of alarms within a subsystem.
- It is unclear whether the installation runs in steady state in the overview screen. To retrieve this information users are forced to click on one or more subsystems. Those subsystems are even more detailed (and chaotic) and low-end users have a hard time working with it.
- Whenever a parameter is changed the user interface does not log nor visualize the change of a parameter. This way a temporary change could easily be forgotten and might result in another alarm.
- It is not possible to control the PWS in the overview screen or start/stop the plant with one button. Every individual subsystem has to be enabled or disabled in order to start or stop the entire plant.
- In case of emergency there is no way to shut down the plant immediately.
Wishes for task assistance features:
- The user interface should filter the amount accessible data to decrease confusion and prevent even more undesirable errors to occur.
- The operator would like to see a redesign of the schematic representation to make it easier to read the interface and work with it. - Part and parameter names (tags) should be more understandable. - Control settings for the entire plant accessible in the overview screen. - Subsystem control settings accessible in the overview screen.
- Alarms in the alarm bar should help the user with finding the exact location of the alarm in the user interface.
- Instead of writing parameters down in a paper archive it would easy to have a data log implemented within the user interface.
- A quick way to stop the plant in case of emergency. 4.1.2. High-end user basic task description
DMT engineers are the designers of the PWS and have expert process knowledge. Specific names of PID controllers, set points of all different kind of data and the usability of the interface is common knowledge. The engineers might be expert because it is their own field of research, but there are still some problems even they can not find as quick as they want too.
When a new plant is being installed commissioning is required. Engineers will use the SCADA interface to enter and change different data for a couple of days or weeks. Every single parameter has to be accessed manually. Whenever the plant runs in stable state an operator takes over and will start monitoring the plant using the user interface.
Difficulties experienced:
- Every parameter setting has to be entered manually. The commissioning phase will take quiet some time, especially when a lot of small parameter changes have to be done.
- Whenever a parameter is changed the user interface does not log nor visualize the change of a parameter. This way a temporary change could easily be forgotten and might result in another alarm.
- It is not possible to filter the data shown in the alarm history page. - There is no easy way of communicating data (no export functionality). - In case of emergency there is no way to shut down the plant
immediately.
Wishes for task assistance features:
- The engineer would like to see a redesign of the schematic representation to make it easier to read the interface and work with it. - DMT engineers would like to include a parameter list where every
parameter setting could be changed individually. This would decrease the time required of the commissioning phase and ease their work during service provision.
- A data log where all parameter changes are being saved. Changes made in the past are easily traceable.
- Simulation mode to test single parameters. The user interface should visualize whenever a parameter is simulated.
- User interface should support a way of user authentication. Individuals should each get a certain user level to improve safety and decrease the amount of undesirable errors.
- Include a function to filter the data in the alarm history and other future data representations. Filtering data will decrease the time it will take to find certain information.
- The engineer would like a print screen function to promote communication between operators and/or engineers.
- A quick way to stop the plant in case of emergency - Chat functionality with in the user interface.
4.1.3. Usage analysis summarized
The conducted interviews gave valuable input for the redesign of the user interface. There is a lot of room for improvement concerning the basic representation and current functionality on one hand and implementing new functionality like data logs, parameter lists and user levels.
4.2. Current PWS SCADA User Interface
None of the current PWS SCADA user interfaces is the same. To get a brief understanding of basic PWS interface elements the SCADA user interface of the PWS in Wijster (Attero) and Zwolle (Rova) will be analysed. As with every PWS SCADA interface, actions will be performed with a computer mouse and keyboard. This section will provide a description of the functionality and user interface elements of both the PWS SCADA interfaces. It is important to mention that the user interfaces are not designed by DMT. It is a product of the customer, programming company and DMT.
4.2.1. Overview layout and functionality
Matter Zwolle Wijster
Biogas Yellow Green
Water Green Blue
Air Blue Blue
THT Purple Purple
Table 2 – Colour difference between Zwolle and Wijster for different matters.
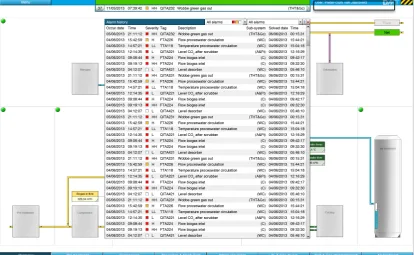
Both interfaces divide the plant into multiple subsystems. Users can recognize the subsystem division by the partitioning of the planes on the overview page (Fig. 5 & 6, item C). To view one of the subsystems in detail, one can simply click on the desired subsystem plane. More information about the subsystem representation and functionality will follow later this section.
Besides the basic PWS representation the SCADA user interfaces provides a lot of information about the plant and options to control the PWS like a users current location, the alarm bar, parameter frames, alarms and/or warnings, navigation elements and features. The user interface always provides a users current location (Fig 5 & 6, item D).
The alarm bar is used to notify any possible alarm that may occur at any time (Fig 5 & 6, item E). Information communicated by the alarm bar is the amount of active alarms, date and/or time, alarm description and the alarm type. Next to the alarm description there is a button/icon to view the alarm history (Fig 5 & 6, item F).
Important parameter frames shown on the overview page help users to get a good read on the current state of the plant (Fig 5 & 6, item G). Parameter frames are connected to parts or pipes by a thin line. To view more parameters or access their settings users should navigate to the desired subsystem.
[image:19.595.89.508.200.553.2]Besides the alarm bar the user interface does also show the location of the alarm in the interface by colouring the alarm or warning indication in the bottom right of the associated sub system plane (Fig. 5, item H) or colour the alarming part red (Fig 6, item H).
Figure 6 – Overview page, PWS user interface Wijster.
Both user interfaces contain a lot of elements used to navigate through the user interface. In Zwolle (Fig. 5), most options – while in the overview page – are hidden under the menu button (Fig. 5, item I). Wijster (Fig. 6) on the other hand, always shows every subsystem navigation button regardless the current displayed page (Fig. 6, item I). Zwolle’s interface shows two extra buttons, one to view the Trend module and the other to reset the alarms (Fig. 5, item J). Way more buttons are shown in the navigation panel of Wijster. These options give the user the possibility to view trends (Fig. 6, item J), reset alarms, fully start or stop the plant, view process steps and plant releases (Fig. 6, item K) and show or hide extra information and tags (Fig. 6, item L).
4.2.2. Subsystem layout and functionality
Both Zwolle and Wijsters subsystems give more control options, a realistic part representation and provide the user with more information about the state of the plant. Zwolle’s interface does not have subsystem control functionality in the overview but provides this function in the subsystem page (Fig. 7, item A). It is also possible to navigate between subsystems by pressing the buttons on the bottom of the screen (Fig. 7, item B). To change a parameter in Zwolle, the settings icon next to the parameter frame (Fig. 7, item C) should be pressed. When pressed the parameter settings window will pop up positioned at the position of the mouse pointer. To close the window a user can simply press the cross at the top right of the pop up window. Whenever the state of a valve, motor or compressor could be changed there is a button next to or below this part (Fig. 7, item D). To view additional settings users can click on the valve, motor or compressor resulting in a pop up window similar to the parameter settings pop up. To access a parameters graph, the graph icon inside the parameter frame should be pressed (Fig. 7, item E). A graph window will pop up positioned at the location of the mouse pointer. Pressing the cross button at the top right will close the graph window. It is important to note the pop up windows cannot be moved.
Figure 7 – Water circulation subsystem, PWS user interface Zwolle.
The user interface will notify the user whenever there is an (in)active alarm located in the subsystem. Connected to the parameter frames are circles that will colour red whenever that parameter has an active alarm. When there is no alarm these circles will be green in Zwolle (Fig. 7, item F) or white in Wijster (Fig. 8, item B).
PWS valves, PID’s, motors and compressors show their current state using the same colours as the alarm notification. Green for active and automatic mode (Fig. 7, item G), white for inactive, red whenever something is wrong and yellow for hand mode (Fig. 8, item C). Below these parts there is extra information given like the percentage a certain valve is opened.
Both user interfaces also show dotted lines between parts or parameter frames. This line means that the linked parts or parameters are related to each other (Fig. 7, item H & Fig. 8, item D).
Extra functionality the Wijster interface provides is the link between subsystems within the subsystem window. Clicking one of the subsystem buttons a pipe leads to will take the user to that subsystem (Fig. 8, item E).
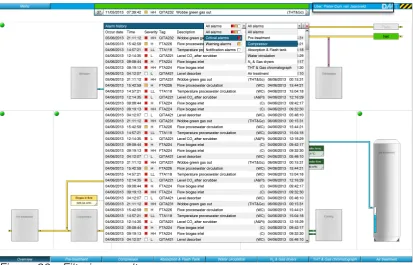
Figure 8 – Absorption process subsystem, PWS user interface Wijster. 4.2.3. Global interface functionality
Alarm history, alarm settings and the trend module are features the interface offers.
The alarm history contains a log of all alarms up to the last server reset. This page is used whenever information about the PWS state in the past is required.
The trend module shows one or more parameters in a single or multiple graphs. Trends are very important in the current user interface, especially for experienced users. A lot of process information could be derived from the trend module by selecting multiple parameters and view their trend during a certain point in time. This information will help users with alarm management and improve the general process of the PWS.
5. Design fundamentals
This chapter contains design fundamentals that serve as solid basis for future design of the SCADA user interface. The design fundamentals are a direct result of the user and usage analysis and the findings of the current user interface analysis. This chapter also contains important guidelines concerning the design of general user interfaces and the design of SCADA user interfaces in specific.
5.1. User profiles
Generalization of the findings of the task analysis and interviews with operators in Zwolle and Wijster as well as the task analysis interviews with engineers at DMT have led to two user profiles. This profile table (Table 3) serves as guideline for the design of the new user interface.
User
characteristics Operators (new focus group) Engineers (current focus group)
Age Range from about 18 to 65 years Range from about 20 to 65 years
Sex Mostly male Male and female
Educational
background Mostly (very) limited educated. UK GCSE's At C level.
No experience at all in the field of chemical or process engineering.
Generally University of Professional Education of University of Science.
Specialists in chemical, mechanical and process engineering.
Educated to design and manage PWS plants.
Physical
limitations Colour physical limitations that might lower blindness. No further the performance of their task.
No physical limitations that might lower the performance of their task.
Experience Some experience with desktop operating systems or smartphone user interfaces. Unknown with the details or technology behind interfaces.
Minimal experience with SCADA interfaces.
Average experience with operating system of smartphone user interfaces.
Very experienced in using SCADA interfaces.
Using specific knowledge to research and develop current and future plants.
Attitude and
motivation Having trouble to process a large amount of information.
Usually bound to habits and find it hard getting used to new technologies that aim to ease their usage with the system.
Will be enthusiastic about change and are willing to learn new things.
Engineers find it important that the new technologies are easy to learn but most of all ease them with their work as much as possible.
Routine Only basic tasks are seasoned.
Specific actions are unknown. High experience could lead to tunnel vision. Commonly used methods could shadow other useful functionality the interface provides.
Table 3 – User profiles.
5.2. Hardware restrictions
The future SCADA interface should be able to run on a smartphone or tablet. Common aspect ratios of smartphones and/or tablets are 3:2 and 16:9. To suit as much of these displays as possible the orientation of the user interface is an important aspect to keep in mind.
Most of the time operators use a desktop computer in the control room of their company. Those computers are not equipped with speakers to notify the user by sound. If the future design contains sound notification it is important users know about this functionality.
Authentication methods of both operators and engineers require an Internet connection. For future design of the SCADA interface more Internet applications could be implemented to improve its versatility.
5.3. Usability heuristics of Nielsen
In interface design it is most important to design an interface for the main user. To reach this goal Jakob Nielsen offers ten heuristics as rules of thumb to work towards when designing an interface (Nielsen & Mack, 1994). Those are often used to investigate and evaluate usability of an existing interface. A new user interface design conform those general principles will most likely be more useable than interfaces that don’t.
Nielsen’s usability heuristics are as follows:
1. Visibility of system status.
The system should always keep users informed about what is going on, through appropriate feedback within reasonable time.
2. Match between system and the real world.
The system should speak the users' language, with words, phrases and concepts familiar to the user, rather than system-oriented terms. Follow real-world conventions, making information appear in a natural and logical order.
3. User control and freedom.
Users often choose system functions by mistake and will need a clearly marked "emergency exit" to leave the unwanted state without having to go through an extended dialogue. Support undo and redo.
4. Consistency and standards.
Users should not have to wonder whether different words, situations, or actions mean the same thing. Follow platform conventions.
5. Error prevention.
Even better than good error messages is a careful design which prevents a problem from occurring in the first place. Either eliminate error-prone conditions or check for them and present users with a confirmation option before they commit to the action.
6. Recognition rather than recall.
Minimize the user's memory load by making objects, actions, and options visible. The user should not have to remember information from one part of the dialogue to another. Instructions for use of the system should be visible or easily retrievable whenever appropriate.
7. Flexibility and efficiency of use.
inexperienced and experienced users. Allow users to tailor frequent actions.
8. Aesthetic and minimalist design.
Dialogues should not contain information which is irrelevant or rarely needed. Every extra unit of information in a dialogue competes with the relevant units of information and diminishes their relative visibility.
9. Help users recognize, diagnose, and recover from errors.
Error messages should be expressed in plain language (no codes), precisely indicate the problem, and constructively suggest a solution.
10.Help and documentation.
Even though it is better if the system can be used without documentation, it may be necessary to provide help and documentation. Any such information should be easy to search, focused on the user's task, list concrete steps to be carried out, and not be too large.
5.4. Specific SCADA interface guidelines
The next guidelines are an addition to Nielsen’s usability heuristics for user interface design. The following guidelines are specific for the design of SCADA user interfaces:
1. Use a workable resolution.
SCADA software often runs on computer systems with basic hardware. Therefore an ideal resolution for a SCADA interface is 1280x720 pixels. Pretty much every device will be able to display the interface without positioning issues.
2. Proper area designation.
SCADA interfaces often communicate large amount of information to users. To minimize the amount of presented noise a proper area designation is ideal.
3. Use appropriate size UI elements.
The minimum button size for computer software is 16x16 pixels (Microsoft, n.d.). Active SCADA user interface areas should be at least this size.
4. Use clear colour ratio
Clear visual difference between different parts of the SCADA user interface improves usability.
5. Present a clear view
SCADA interfaces often work with pop-up windows, drop down menus or similar forms of screen coverage. Minimization of noise presented on the screen improves usability. Navigation elements and pop-ups may best be placed at the border of the screen or the source of the pop-up.
6. Constrained controls
6. Desired features
With reference to the analysis of the end users and the current interface a list of requirements is made. The requirements are split in two different parts. The first part includes functional requirements to assist users on their jobs. The second part focuses on the requirements for the SCADA user interface. Both lists serve as guidelines for the future design of the SCADA user interface of the PWS.
6.1. Functional requirements
1. The interface should support a way of authentication.
a. Each group of users will have a different level of interface complexity. • The user interface should display the current level of complexity. b. Each group of users will have different control rights in the interface.
2. The interface should ease the user by decreasing the difficulty of reading and understanding the current state of the PWS.
a. The schematic representation of the PWS should be understandable. • Schematic representation should only display relevant PWS parts,
dependant on the level of complexity and the data the users require to see.
• Schematic representation should be logically positioned.
b. The user interface should display the current general state of the PWS. c. The user interface should display relevant data.
• The amount of presented data is dependant of the level of complexity.
d. The user interface should filter accessible settings of data.
• The amount of accessible settings is dependant of the level of complexity.
e. The user interface should filter accessible trending modules.
• Accessible trending modules are dependant of the level of complexity.
3. The user interface should support job assistance features that decrease the difficulty of controlling the PWS.
a. Interface navigation elements should speak for themselves. • Clickable elements should present themselves as clickable. • The user interface should have clear start/stop buttons.
• Active and/or inactive interface elements should clearly present their current state.
b. Navigation between different layers of the user interface should require minimal amount of actions.
c. Changing values should require minimal amount of actions. d. Pop-up windows should not obstruct the rest of the interface.
• The interface should support multiple pop-up windows.
• Pop-up windows should be moveable or have a fixed position in the interface.
4. The interface should improve the PWS uptime by decreasing the amount of critical errors and help users solve occurred errors more efficient in a shorter amount of time.
a. The user interface should have a clear way of notifying an alarm. b. The user interface should state the severity of the alarm.
c. The user interface should show the amount of outstanding alarms. d. The user interface should show the position of the occurring alarm in
the schematic representation of the PWS.
• Alarm notifications should create a link between the notification and the position of this alarm in the schematic representation of the PWS.
e. Alarms should help the user solving the problem.
• Alarm notifications should inform the user with important information concerning the alarm.
f. The system should automatically log changes of data. Corresponding tag, date and time, user who made the change and attached notes will be logged with it.
• The user interface should present a way to visualize these data logs.
g. The system should support a simulation modus that could be turned on when a test is being done.
• The user interface should give the option for simulation mode. • The user interface should communicate whether or not simulation
mode is active.
h. The user interface should contain DMT contact information.
• The user interface should give an option to visualize DMT’s contact information for required service.
5. The user interface should match DMT’s company image.
a. Interface representation should match DMT’s colour composition. b. The interface should contain a DMT logo.
6. The user interface should fit within the stated hardware restrictions. a. The user interface should work with mouse and keyboard.
b. The user interface should be designed conform the stated screen resolution.
c. The user interface should work on tablet or smartphone.
• Visualisation of the interface on the computer monitor should also fit tablets and smartphones.
d. The SCADA system should support job assistance features that could easily import/export data and communicate these over the internet.
7. The user interface should present PWS parts, tags, connections and other elements following understandable (international) standards.
a. PWS parts should be standardized for future PWS SCADA interfaces. b. Tag names, colouring and positioning should be applied in a
consistent way.
c. Line colouring, positioning and direction should be applied in a consistent way.
6.2. SCADA user interface requirements
The user interface design should ease the user conform Nielsen’s usability heuristics.
1. The SCADA user interface design should be accessible.
a. The interface should be operable with a mouse and keyboard.
• Condition: operational resolution will be 1280x800 pixels. c. The interface should be operable on a tablet of smartphone.
d. The interface should be workable without reflection or dust being an issue.
e. User interface elements should be visible and understandable. • Condition: buttons will be at least 16x16 pixels.
f. Colour-blind users should be able to work with the user interface without having trouble understanding it.
• Gray-scale interface elements must have the same effect as coloured elements.
g. Interface elements should not restrict nor over inform users.
2. Heuristic: Visibility of system status.
a. The user should be informed which part of the interface is currently displayed.
b. Schematic representation of the interface should be presented understandable for all users.
c. The user should at all times be informed about the current state of the system.
d. The user should be able to retrieve (the most important) data in a blink of an eye.
e. The user should be informed about unresolved alarms.
f. User interface should immediately provide the user feedback when navigating with mouse and/or keyboard.
3. Heuristic: Match between the system and the real world. a. All users must understand every displayed text and icons. b. Schematic representation should match the real PWS.
c. Tags must be used consistent for both user groups to promote communication.
4. Heuristic: User control and freedom.
a. The user interface should provide a clear way to undo changes.
b. The user interface should provide a clear way to navigate through different parts of the interface.
c. The user interface should provide an easy way to navigate through different menu structures the interface offers.
d. The user interface should provide a clear way to close windows.
5. Heuristic: Consistency and standards.
a. Control functions should be used in a consistent way. b. Positioning of presented information should be consistent.
c. User interface design conform understandable colour standards for all users.
6. Heuristic: Error prevention.
a. Whenever an action results in an error, the interface should inform the user and ask for confirmation.
7. Heuristic: Recognition rather than recall.
a. Objects, actions and options should be visible.
b. Hidden options should be displayed by a single modification.
c. Information should not have to be remembered from one parts of the interface to another.
8. Heuristic: Flexibility and efficiency of use.
a. Frequently used interface options should be visible throughout the entire interface in a consistent way.
9. Heuristic: Aesthetic and minimalist design.
a. Irrelevant information should not be displayed at all.
b. Rarely used information will be hidden behind another layer but could be accessed with ease.
10. Heuristic: Help users recognize, diagnose, and recover from errors. a. Error messages should be understood by all users and precisely
indicate the problem.
7. Conceptual design phase
By means of the large amount and information and prepared desired features a concept design has been made for the future SCADA PWS user interface. The following section will explain this design in general and detail and argue the design decisions that were made.
At first it will be explained how the interface (server) will be approached and how it will be controlled. This will be followed by a brief overview of the parts the interface is built of. All screen displays and functionality will be addressed in detail afterwards. It is important to note that sections 7.1. Connection to the server and 7.2. Controlling the user interface are preconditions for the redesign.
The decisions made will be argued and explained why this will improve the overall ease of the user interface and in what way it will assist a user in their work.
7.1. Connecting to the server
The SCADA system will be installed on a server computer that is dedicated to the PWS installation. Users can connect to this server from any computer around the world. In order to connect to the server a user has to install remote-connect software on their computer. Establishing the connection to the server will require (at least) an IP address and password and an internet connection. The server does allow multiple logins at the same time without users having to share the same screen.
When the connection is successful the user will gain access to the interface. At that moment it is possible to authenticate within the user interface itself to gain more rights to control the PWS. If a user decides not to authenticate, they won’t have access to any of the plant settings. By default the user interface will show the user authentication window after the connection to the server is being made. Users will not have to reconnect to change user levels. Clicking the menu button will give the option to “Change User”. The remainder of this report will provide further explanation about user authentication and the visualization of this window.
7.2. Controlling the user interface
The user interface will be controlled with a mouse and keyboard. It is also possible to use the touchscreen of a smartphone or tablet to control the interface but this will lower the ease of controlling it. While the conceptual design is mainly focused on mouse/keyboard control, future use of a tablet or smartphone is definitely kept in mind in the positioning of the user interface elements.
7.3. User interface components
The future design will have a fixed frame – one at the top and one at the bottom of the screen – where PWS information and user interface navigation elements are built in. The plant overview or one of the multiple detail screens of subsystems will cover the remaining space of the screen and will be called ‘the active area’ of the user interface. These different views will give the user insight in the state of the PWS and give access to a wide variety of PWS settings.
7.4. Design preparations
Before the development of the interface design it is important to realise that there is a lot of specific information and data the SCADA user interface has to present. The most common data are date, time, sensor and PID tags, descriptions and specific alarm and PID information.
In order to prepare for the redesign the different parameter settings (including settings alarm and PID) require a detailed investigation. The findings will be implemented in the final concept design (see Section 8). 7.4.1. Parameter settings
The SCADA user interface will show the user several parameter frames on each screen. Users will have access to expand the parameter frame showing the parameter settings. This frame will show the alarm and PID settings for this parameter. Whether the user can make changes in this frame is dependant on their user level.
7.4.2. Alarm settings
A parameter can have the following alarm settings (Table 4). The alarm signal the system provides must be visualized by the user interface. By communicating this information a user can intervene in the process to solve the alarm.
Alarm type Alarm explanation
HH Higher-high alarm value. When a parameter exceeds this value the system will give an HH-alarm signal.
LL Lower-low alarm value. When a parameter falls below this value the system will give a LL-alarm signal.
H High alarm value. When a parameter exceeds this value the system will give an HH-alarm signal.
L Low alarm value. When a parameter falls below this value the system will give a LL-alarm signal.
Table 4 – Alarm types.
Every alarm type is split in to two different settings. The value for HHin will activate the HH-alarm where the value for HHout will deactivate the alarm again. Some parameters have only got the two HH and H alarm settings. Others have got H1, H2, L1, L2 in addition to the HH and LL alarm types.
7.4.3. Alarm severity
Every alarm is linked to a level of severity. The different alarm types (HH and H) already give an indication about the severity but not all HH-alarms are the same. When an alarm occurs it will be communicated to the user naming the alarm type and the severity of the alarm. Alarms will be divided in to three different levels:
Severity Explanation Urgent
(red) Critical alarm. A user must intervene in the process. If not, the PWS could stop running in the end. Non-urgent
(orange) Non-critical alarm. Ignoring this alarm could lead to an urgent alarm. Notification
The alarms are split in to urgent and non-urgent alarms because of the difference in consequences they have. The HH alarm type is usually a hard safety alarm. An active HH is therefore (almost) always an urgent alarm. H alarms are less urgent, but most certainly require attention to prevent the alarm from getting urgent. The user interface does provide an option to change the severity of a single alarm. Whether a user can change this setting depends on their user level. More about changing the severity of alarms will follow later this report.
7.4.4. PID settings
Besides the alarm settings the expanded parameter frame will also show the PID settings of a parameter. Possible settings are listed in table 6.
PID setting Setting explanation
SP Setpoint value.
P Proportional value.
I Integral value.
D Derivative value.
MAX Maximum (percentage).
MIN Minimum (percentage). Table 6 – PID settings.
A PID controller calculates a value as the difference between a measured process parameter and a desired setpoint. The controller will minimize the difference by adjusting the process control inputs using an algorithm involving the P, I and D. Whenever a user makes a change to one of the alarm or PID settings, it will result in a change of the biogas upgrading process. In the extreme a wrong input could even lead to dangerous situations. Therefore it is important to provide insight in the meaning of the different parameter settings and the consequences changes can cause.
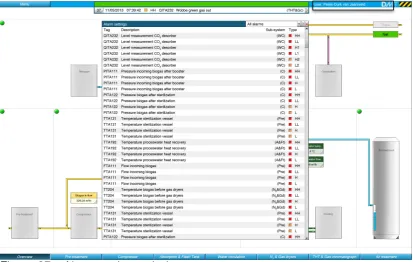
Figure 9 – Parameter list. 7.4.5. User levels
Analysing the final parameter list learned that the amount of different user levels differ from the amount shown in figure 9. There will be 5 different levels, each having different rights within the future user interface. The table below states each level and adds a corresponding colour the user level can be recognized with.
User level Corresponding colour
Operator 1
Operator 2
DMT service
DMT expert
Safety
Table 7 – User level colours.
User levels Operator 1 and Operator 2 will be used at the customer of DMT. Operator 1 can perform basic control tasks and change a minimal amount of parameter settings. Operator 2 has access to a few extra parameter settings and it is the intention that only a few – the more experienced – operators at the customer will use this level. The DMT service level is used by engineers and provides access to most of the PID settings to fully control the plant. DMT experts will have the addition of the ability to adjust most of the alarm settings and the required user level to change a parameter setting up to DMT expert level. The reason why there are two different DMT levels implemented in the system is because even DMT process engineers do not know every single plant from the top of their head and every plant is (a little) different. When a lesser-experienced engineer provides 24-hour service to the customer this user should not be able to change hard safety settings. The safety level has access to every setting and can change every possible required user level. Only the programmers of the SCADA system can access the safety level.
required because features like the print screen function, the chat function and the data log require a users username as input for the data they save and present.
Dividing the users in to five different groups has multiple advantages. One of the most important is a safety issue. As read in the user and usage analysis (see section 4) there is only one level implemented in the current SCADA system. This level is used by both high and low-end users and could result in undesirable situations, usually caused by unintended mistakes made by low-end users.
For safety reasons there has been a timer built in the interface. Whenever a user has not been active within the user interface for a short amount of time – 10 minutes for example – the user will automatically be logged out. This does apply to every user level except for the Operator 1 level.
On the other hand there are some alarm settings that serve as hard safety for the PWS. Even DMT engineers – whether they are DMT service or DMT expert – should not be able to change these settings to secure safety at all time.
8. Final concept design
This section will explain every part of the conceptual design in detail and argue why the implemented features and design is chosen.
8.1. Framework
The framework of the final concept features several navigation elements and important information for the user. The window the frame is built in the aspect ratio 16:10 (1280x800). The top frame includes the following features:
- Menu button; - General state; - Alarm bar; - Current user;
- DMT logo and frame colour; - Quick stop button.
The bottom frame features buttons to navigate between the overview and the different subsystems of the plant. Figure 10 shows the visualization of the framework.
Figure 10 – Framework. 8.1.1. Top frame: menu
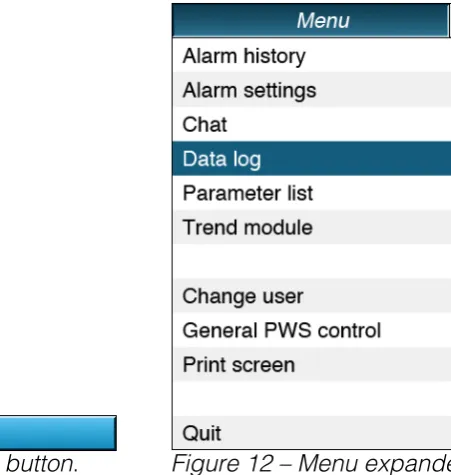
Figure 11 – Menu button. Figure 12 – Menu expanded.
A detailed description of all menu features will follow further this report. 8.1.2. Top frame: state bar
The state bar is a new feature to the user interface. The state bar will change colour to help a user to get a quick read on the current state of the plant. When the bar is coloured green the plant is running without any problems. An orange state bar indicates minor deviations and tells the user to check the process. The plant will could possibly shut down in the near future when the state bar turns red. The red state requires immediate action in order to get the plant running in stable state again.
The state bar is implemented because current interfaces did not visualise the overall state of the plant. At some customers operators will not be able to monitor the plant during the entire day. In between the different tasks they have to perform they will check up on the system. Therefore it is important to visualize the overall state of the plant in a clear way. This way an operator does not have to search the entire interface for small alarm or state indications as with the current user interface. Regardless of the current screen it is always possible to get a quick read of the current state of the plant. The size and positioning of the bar – wide bar in the top-centre of the screen – contribute positively to the meaning of the state bar. The table below clarifies the different states of the state bar (see Fig. 13).
State bar colour Required action
Green Stable-state: no actions required. Orange Notification-state: attention required. Red Action-state: action required.
White grey PWS inactive. Table 8 – State overview.
[image:36.595.185.411.71.309.2]