ORIGINAL RESEARCH
BRAIN
Improved T2* Imaging without Increase in Scan Time:
SWI Processing of 2D Gradient Echo
S. Soman, S.J. Holdsworth, P.D. Barnes, J. Rosenberg, J.B. Andre, R. Bammer, and K.W. Yeom EBM 2
ABSTRACT
BACKGROUND AND PURPOSE: 2D gradient-echo imaging is sensitive to T2* lesions (hemorrhages, mineralization, and vascular lesions), and susceptibility-weighted imaging is even more sensitive, but at the cost of additional scan time (SWI: 5–10 minutes; 2D gradient-echo: 2 minutes). The long acquisition time of SWI may pose challenges in motion-prone patients. We hypothesized that 2D SWI/phase unwrapped images processed from 2D gradient-echo imaging could improve T2* lesion detection.
MATERIALS AND METHODS: 2D gradient-echo brain images of 50 consecutive pediatric patients (mean age, 8 years) acquired at 3T were retrospectively processed to generate 2D SWI/phase unwrapped images. The 2D gradient-echo and 2D SWI/phase unwrapped images were compared for various imaging parameters and were scored in a blinded fashion.
RESULTS:Of 50 patients, 2D gradient-echo imaging detected T2* lesions in 29 patients and had normal findings in 21 patients. 2D SWI was more sensitive than standard 2D gradient-echo imaging in detecting T2* lesions (P⬍.0001). 2D SWI/phase unwrapped imaging also improved delineation of normal venous structures and nonpathologic calcifications and helped distinguish calcifications from hemor-rhage. A few pitfalls of 2D SWI/phase unwrapped imaging were noted, including worsened motion and dental artifacts and challenges in detecting T2* lesions adjacent to calvaria or robust deoxygenated veins.
CONCLUSIONS: 2D SWI and associated phase unwrapped images processed from standard 2D gradient-echo images were more sensitive in detecting T2* lesions and delineating normal venous structures and nonpathologic mineralization, and they also helped distinguish calcification at no additional scan time. SWI processing of 2D gradient-echo images may be a useful adjunct in cases in which longer scan times of 3D SWI are difficult to implement.
ABBREVIATIONS:2D SWI⫽SWI-processed 2D GRE; PU⫽phase unwrapped; 3D SWI⫽SWI-processed 3D GRE; GRE⫽gradient-echo
G
radient-echo (GRE) imaging is a robust MR imaging method for evaluating intracranial hemorrhage, mineral-ization, and venous structures1,2and is routinely used whenbrain MR imaging is performed. The image contrast in GRE is dependent on T2* relaxation, which refers to decay of trans-verse magnetization caused by a combination of spin-spin re-laxation and magnetic field inhomogeneity. However, an ad-ditional form of image contrast can be generated by exploiting the phase information of GRE images. Depending on the TE, substances with different magnetic susceptibilities come out of phase with their surrounding tissue. Thus phase images can contain valuable information about local susceptibility changes among neighboring tissues. Using phase images to either enhance the contrast of T2*-weighted magnitude images or, on their own, as a complementary form of image contrast is called susceptibility-weighted imaging.3SWI better accentuates the paramagnetic properties of blood products than 2D GRE imag-ing and adds the ability to distimag-inguish blood products from calcifica-tion. While SWI has shown clinical utility in the evaluation of hem-orrhage, arterial venous malformations, small vessel diseases,
Received December 16, 2012; accepted after revision February 21, 2013. From the Department of Radiology (S.S., P.D.B., K.W.Y.), Lucile Packard Children’s Hospital, Stanford University, Palo Alto, California; Department of Radiology (S.J.H., J.R., R.B.), Lucas Center, Stanford University, Stanford, California; and Department of Radiology (J.B.A.), University of Washington, Seattle, Washington.
Paper previously presented in abstract form at: American Society of Neuroradiol-ogy 49th Annual Meeting and the Foundation of the ASNR Symposium, June 4 –9, 2011; Seattle, Washington.
Please address correspondence to: Kristen W. Yeom, MD, Department of Radiol-ogy, Pediatric MRI and CT, Lucile Packard Children’s Hospital, Stanford University, Room 0511, 725 Welch Rd, Palo Alto, CA 94304; e-mail: [email protected]
Indicates open access to non-subscribers at www.ajnr.org Indicates article with supplemental on-line table
EBM
amyloid angiopathy, cavernous malformations, multiple sclerosis, trauma, tumors, and hemosiderosis,3-13routine clinical implemen-tation may be difficult due to the longer acquisition time (between 5 and 10 minutes3-5,14-17), particularly in children who are motion-prone and often require sedation.
Proponents of SWI have suggested that high-resolution 3D GRE images are crucial to optimally visualize cancellation ef-fects between veins and background tissue and to avoid rapid dephasing across voxels that can occur by using a 2D GRE acquisition.3,4,18For this reason, vendors typically use 3D GRE sequences with resolutions on the order of 0.5⫻1.0⫻2.0 mm, resulting in acquisition times ranging from 5 to 10 minutes (de-pending on other imaging parameters and the MR imaging sys-tem used). In addition, TEs in SWI are typically optimized to maximize the phase difference between the venous and surround-ing parenchymal tissue, usually a TE of⬃25 ms at 3T.3,4,18
While SWI as derived from 3D GRE images yields excellent contrast among tissues of differing susceptibilities, we questioned whether SWI derived from 2D GRE images could also provide useful image contrast. 2D GRE images are acquired at consider-ably lower resolution (0.6⫻1.4⫻5 mm) and TE (15 ms) than SWI-processed 3D GRE (3D SWI). However 2D GRE images are also acquired in⬍2 minutes as part of our routine clinical prac-tice. To the best of our knowledge, whether the phase information can be leveraged to boost image contrast and (if so) whether this additional postprocessing step is clinically useful are not known. Here, we hypothesized that 2D SWI/phase unwrapped (PU) im-ages derived from SWI-processed 2D GRE could improve T2* lesion detection compared with standard 2D GRE.
MATERIALS AND METHODS
Subjects and Equipment
Fifty consecutive patients, mean age 8 years (median, 9 years; range, 2 months to 19 years; 28 males and 22 females), who un-derwent 2D GRE as part of routine brain MR imaging at 3T (Dis-covery 750; GE Healthcare, Milwaukee, Wisconsin), were retro-spectively evaluated at our children’s hospital after institutional
review board approval. Axial 2D GRE im-aging parameters were: TE⫽15 ms, TR⫽ 650 ms, flip angle⫽20°, section thick-ness⫽5 mm, 1-mm gap, FOV⫽18 –24 cm, rectangular FOV⫽ 0.75, matrix⫽ 384 ⫻168, bandwidth ⫽15 kHz, with flow compensation enabled, scan time⫽ 1 minute, 50 seconds. An 8-channel head coil was used. Additional MR imaging se-quences included T1 FLAIR, T2 FSE, DWI, T2 FLAIR, with or without con-trast-enhanced T1 spin-echo images.
SWI Production from 2D GRE Data
SWI was created in line with the approach outlined by Haacke et al and Reichenbach et al.3,4A Hanning filter was used to phase unwrap and low-pass filter the complex data to create the 2D PU images. A nega-tive phase mask was then generated from the PU images and was multiplied by the magnitude imagen⫽5 times to generate the 2D SWI. Note that
n⫽5 was considered empirically to be an acceptable trade-off between SNR and susceptibility contrast. The PU images were then inverted for blood products to appear hypointense. The raw data from the 2D GRE acquisition were saved on the scanner and sent to a computer for processing off-line. Postprocessing was performed by using a fully automated in-house-built Matlab code (7.8.0; MathWorks, Natick, Massachusetts), taking 2 minutes to complete per patient, with subsequent 2D SWI/PU images auto-matically returned to the PACS.
Data Review
Standard 2D GRE images were reviewed for any abnormalities by a blinded board-certified neuroradiologist (P.D.B.) with a Certif-icate of Added Qualification (⬎30 years’ experience). A second board-certified neuroradiologist (K.W.Y.) with a Certificate of Added Qualification (7 years’ experience) independently com-pared and scored the 2D GRE and 2D SWI in a blinded fashion. The 2D SWI and 2D PU images were subsequently compared side by side to identify any opposite signal intensities that might sug-gest the presence of calcifications as previously described for 3D SWI16,17and were also compared with available CT scans. A first-year neuroradiology fellow (S.S.) was present throughout the study to administer the review process in a randomized and blinded fashion.
Baseline 2D GRE
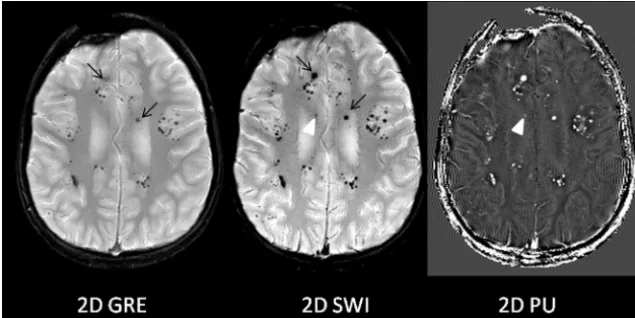
T2* lesions were defined as hemorrhages, mineralization, abnor-mal vascularity (AVM, telangiectasias, or tumor vascularity), or other hemosiderin-stained hypointense lesions. The 2D GRE im-aging findings of all patients were randomly reviewed and inter-preted as either normal in the absence of such lesions or abnormal if such lesions were present. As summarized by Wu et al,17 calci-fications of the pineal gland, choroid plexus, basal ganglia, deep cerebellar nuclei, and dura mater, also referred as “nonpathologic calcifications,” are usually not associated with pathology. Hence, examinations that showed nonpathologic calcifications were cat-FIG 1. Improved T2* lesion conspicuity on 2D SWI compared with 2D GRE. Multiple T2* lesions
[image:2.594.53.371.48.207.2]egorized as having normal findings. In addition, the presence of a developmental venous anomaly was considered normal for this study purpose. Of note, no patients had disorders of calcium/ phosphate metabolism. Also, the presence of motion or metal artifacts did not constitute an abnormality.
Comparison of 2D GRE and 2D SWI
For the 2D GRE studies with abnormal findings, conspicuity of the T2* lesions were scored for both 2D GRE and corresponding 2D SWI by using the following 5-point scale:⫺2, findings were visible on 2D GRE, but not visible on 2D SWI;⫺1, findings were better seen on 2D GRE compared with 2D SWI; 0, all findings were equally visible on 2D GRE and 2D SWI;⫹1, findings were better identified on 2D SWI than on 2D GRE; and⫹2, findings were visible on 2D SWI that were not visible on 2D GRE. If mul-tiple T2* lesions were present in any given patient, scoring was still performed for each T2* lesion but the lowest of the scores was used as the final score.
Among 2D GRE studies with normal findings, any new poten-tial T2* lesion on 2D SWI not previously detected by 2D GRE was also recorded. In such cases, additional MR imaging sequences (T1WI, T2WI, DWI, contrast-enhanced images) and CT were used to exclude potential artifacts and to further define the “new” T2* lesion, with the understanding that without a histologic cor-relate, lesion verity may not be confirmed.
Other Imaging Features
For all 50 baseline 2D GRE examinations with normal and abnor-mal findings, additional imaging features on 2D SWI relative to 2D GRE were queried, requiring yes (1) or no (0) responses:
● If present, was T2* of the deep gray nuclei more conspicuous or newly identified?
● If present, were motion/dental artifacts worse?
● Was depiction of normal venous structures and/or develop-mental venous anomalies more prominent, and were new venous structures seen on 2D SWI not detected by 2D GRE?
● If present, was surgical catheter detail improved?
Finally, for all cases, 2D SWI and 2D PU images were com-pared side by side to identify opposite intensities that would sug-gest the presence of calcification, and they were subsequently compared with CT.
Statistical Analysis
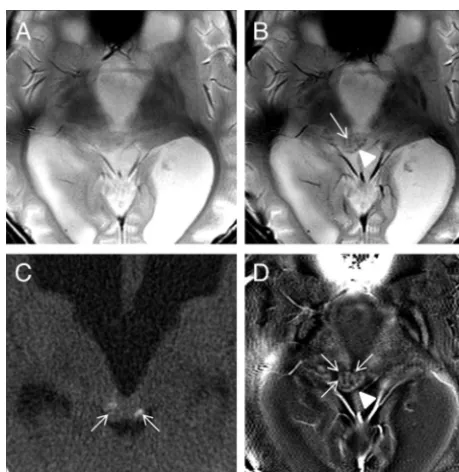
To statistically analyze the degree to which 2D SWI depicted T2* lesions seen on 2D GRE images with abnormal findings, the Wil-coxon signed rank test against a value of zero (no difference) was used. For the remaining binary measures, the percentage of posi-tive outcomes was calculated. All statistical analyses were per-FIG 2. Potential pitfalls of 2D SWI/PU. Focal venous thrombosis (black arrow) and an adjacent area suspicious for focal venous ischemia (black arrowhead) on DWI are identified in a 5-month-old boy with seizures. The T2* lesion corresponding to the thrombosis is well-visualized on both 2D GRE and 2D SWI (black arrows) and is, in fact, even more prominent on 2D SWI images. However, prominent adjacent calvarial bony artifacts (arrowhead) and heightened visualization of deoxygenated and slow-flow cortical veins on 2D SWI (white arrows) were thought to be distracting.
[image:3.594.77.506.48.209.2] [image:3.594.302.532.274.510.2]formed by a biostatistician (J.R.) by using STATA, Release 9.2 (StataCorp, College Station, Texas).
RESULTS
Baseline 2D GRE
Of the 50 patients, 29 had abnormal findings on 2D GRE examina-tions that contained at least one T2* lesion; the patient demographics and types of T2* lesions are listed in the On-line Table. The remain-ing 21 patients had normal findremain-ings on 2D GRE examinations.
Comparison of 2D GRE and 2D SWI
Of the 29 patients with abnormal findings on 2D GRE examina-tions, the 2D SWI was scored as superior to the corresponding 2D
GRE images with regard to conspicuity of T2* lesions by using the Wilcoxon signed rank test (P⬍.0001). In 21 of the 29 sub-jects (72%), T2* lesions were more con-spicuous on 2D SWI than on 2D GRE images.
In 3 of the 29 patients (10%), new T2* foci were seen on 2D SWI, in addition to better conspicuity of other T2* lesions. In these instances, the lesions were pre-sumed to represent additional foci of ra-diation-induced telangiectasias/cavern-ous malformations (Fig 1) and additional foci of hemorrhage for the other 2 cases.
In 3 patients (10%), no difference in T2* lesion conspicuity was noted between 2D GRE and 2D SWI.
In 2 patients, 2D GRE was considered better than 2D SWI with regard to T2* lesion conspicuity. These 2 cases con-sisted of cortical venous thrombosis and focal caudothalamic hemorrhage. Al-though T2* lesions themselves were more prominent on 2D SWI than on the respec-tive 2D GRE images, increased prominence of deoxygenated and slow-flow veins (for both cases) and worsened calvarial artifacts adjacent to the T2* lesion (one of the cases) were considered distracting and thereby negatively impacted lesion conspicuity (Fig 2).
Of the 21 patients with normal baseline 2D GRE images, 2D SWI showed a new T2* lesion in 1 case, confirmed as a tumor calci-fication by corresponding CT (and poten-tially some blood products), that was not initially detected by the baseline 2D GRE image (Fig 3).
Other Imaging Features
T2* of Deep Gray Nuclei. Twenty-nine of 50 cases (58%; 95% confidence interval, 43%–72%) depicted new, additional, or more prominent deep gray (basal ganglia or dentate nuclei) mineralization on 2D SWI relative to the corresponding 2D GRE images.
Motion or Dental Artifacts. Motion degradation or dental hard-ware artifacts were identified on the 2D GRE images in 4 of 50 cases (8%), all of which were otherwise classified having normal findings. In all 4 cases, the artifacts were more pronounced on 2D SWI (Fig 4A).
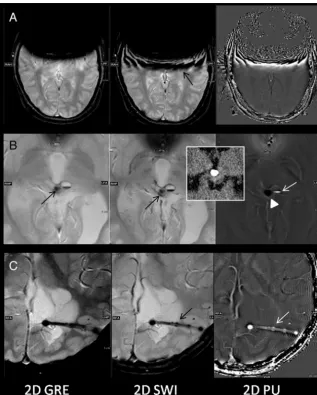
Calcification versus Hemorrhage. Nine of 50 cases (18%; 95% confidence interval, 9%–31%) demonstrated signal intensity op-posite what would be expected for iron or hemorrhage on the 2D PU images, suggesting the presence of calcifications, all of which were confirmed by CT (Fig 4B).
[image:4.594.54.372.46.442.2]Normal Venous Structures (Including Developmental Venous Anomaly). In all 50 cases, normal venous structures previously identified by the baseline 2D GRE were considered more promi-nent, or better visualized. In 12 of 50 cases (24%; 95% confidence interval, 13%–38%), 2D SWI detected new linear low-signal in-tensities in a pattern representative of additional venous struc-tures. Three cases of developmental venous anomaly detected by the baseline 2D GRE were considered more prominent on 2D SWI. No new developmental venous anomaly was identified by 2D SWI.
Surgical Hardware. In all 5 (5/50, 10%) cases in which a surgical catheter was present, the 2D SWI was preferred over the 2D GRE for catheter delineation, including better depiction of the side ports (Fig 4C).
DISCUSSION
Our results demonstrate that 2D SWI processed from standard 2D GRE imaging could improve the conspicuity of T2* lesions compared with the standard 2D GRE image and, in addition, identify new lesions. Furthermore, 2D SWI/PU images can help distinguish calcification from hemorrhage, similar to 3D SWI.13,18While prior work by Haacke et al and Sehgal et al.3,18
suggested that 2D GRE acquisitions result in rapid dephasing across voxels that could inhibit the additional T2* visualiza-tion achieved with 3D GRE acquisivisualiza-tions of SWI, our results suggest that phase in-formation derived from 2D GRE images has the capacity to produce 2D SWI/PU images that are superior to standard 2D GRE images.
A few pitfalls of 2D SWI were noted. Despite the increased prominence of the T2* lesions themselves, a case of focal cau-dothalamic hemorrhage was rendered less conspicuous due to distractions incurred by heightened visualization of adjacent veins, and a case of cortical venous thrombosis along brain convexity was deemed less conspicuous due to the combined effects of worsened calvarial bony artifacts and more numerous/bet-ter visualized adjacent deoxygenated veins. Additionally, motion degrada-tion and dental artifacts were more pro-nounced on 2D SWI/PU images, which likely occurred due to incomplete phase unwrapping in regions with steep phase topography. These limitations of 2D SWI suggest that in certain instances, they may be best used in conjunction with standard 2D GRE images.
Gaining more information without an increase in scan time is particularly important in pediatric imaging, where long scan times render studies suscepti-ble to motion degradation and could necessitate sedation. In addition to improved depiction of T2* lesions, other features, such as basal ganglia mineralization and venous structures (normal veins and developmental venous anomalies), were also better detected by 2D SWI. Routine use of 2D SWI may, in the future, reveal that basal ganglia miner-alization may occur even earlier than previously proposed.19 Also, improved delineation of catheter drainage holes, while not necessarily indicative of patency, may provide useful cath-eter information in relation to the ventricular system.
There were a few limitations to our study. In instances in which new T2* lesions were detected by 2D SWI, we presumed that they represented pathology on the basis of underlying pa-tient history (eg, multiple telangiectasias/cavernous malfor-mations, trauma, or hemorrhages elsewhere in the brain), but in the absence of a histologic correlate, the true nature of these T2* lesions cannot be confirmed. In addition, while CT was used to confirm 2D SWI/PU findings suspicious for calcifica-tion, we recognize that small foci may not be detectable by CT. While time constraints and the potential need for sedation did not permit simultaneous acquisition of 2D GRE and 3D GRE for SWI processing, direct comparison could have gauged 2D SWI performance against 3D SWI. An example that directly FIG 5. Sample case of 2D GRE, 2D SWI, and 3D SWI acquired in a 3-year-old boy with
[image:5.594.56.369.48.359.2]compares 2D SWI and 3D SWI, by using the parameters de-scribed by Haacke et al,3 is shown in Fig 5. With a higher resolution technique, 3D SWI better delineates small vessels. However, the longer scan time of 3D SWI (7 minutes, 40 sec-onds) compared with 2D SWI (1 minute, 50 secsec-onds) has re-sulted in motion degradation. Future studies are needed to understand the performance of 2D SWI against 3D SWI.
At this time, given that vendor-supplied 2D GRE is an ac-cepted part of standard MR imaging brain protocol in most institutions, our goal was to investigate what additional infor-mation could be garnered from SWI processing of a routine 2D GRE dataset. With automatic processing and return to PACS in
⬍2 minutes, 2D SWI/PU can easily be incorporated into rou-tine brain MR imaging. For example, the 2D GRE image could be used for surveillance of obvious T2* lesions and 2D SWI could be used in tandem to probe subtle hemorrhages or to further define abnormal vascularity in such cases as tumor or vascular malformations. Lesions manifest on T1WI or 2D GRE could also be compared with PU images, or PU images them-selves could be used to help detect calcifications and poten-tially avoid CT when detection of calcification is desired in such cases as congenital infections or craniopharyngioma. Fur-thermore, with no additional scan time, 2D SWI may be an alternative when 3D SWI is not available or difficult to imple-ment in motion-prone patients.
CONCLUSIONS
2D SWI/PU processed from standard 2D GRE can improve the conspicuity of T2* lesions, identify new lesions, and sometimes help distinguish calcification from hemorrhage and may there-fore be a useful adjunct to routine 2D GRE imaging.
Disclosures: Samantha J. Holdsworth—RELATED:Grant: National Institutes of Health (NIH) (R01 EB 8706, R01 EB 11654, R01 EB 2711– 08, R01 EB 6526).* Roland Bammer—
RELATED:Grant: NIH (R01 EB 8706, R01 EB 11654, R01 EB 2711– 08, R01 EB 6526),* UN-RELATED:Board Membership: iSchemaView,Comments: I am a cofounder of iSch-emaView, Inc and own stock, but I am not an employee of this company, nor do I receive a salary. This company was not involved in any form with this study. *Money paid to the institution.
REFERENCES
1. Castillo M.The Core Curriculum: Neuroradiology.Philadelphia: Lip-pincott Williams & Wilkins; 2002
2. Atlas S, Mark A, Grossman R, et al.Intracranial hemorrhage: gradi-ent-echo MR imaging at 1.5 T: comparison with spin-echo imaging and clinical applications.Radiology1988;168:803– 07
3. Haacke EM, Xu Y, Cheng YC, et al.Susceptibility weighted imaging (SWI).Magn Reson Med2004;52:612–18
4. Reichenbach JR, Venkatesan R, Schillinger DJ, et al.Small vessels in the human brain: MR venography with deoxyhemoglobin as an in-trinsic contrast agent.Radiology1997;204:272–77
5. Mittal S, Wu Z, Neelavalli J, et al.Susceptibility-weighted imaging: technical aspects and clinical applications, part 2.AJNR Am J Neu-roradiol2009;30:232–52
6. Tong KA, Ashwal S, Obenaus A, et al.Susceptibility-weighted MR imaging: a review of clinical applications in children.AJNR Am J Neuroradiol2008;29:9 –17
7. Zhu WZ, Qi JP, Zhan CJ, et al.Magnetic resonance susceptibility weighted imaging in detecting intracranial calcification and hem-orrhage.Chin Med J (Engl) 2008;121:2021–25
8. Haacke EM, Mittal S, Wu Z, et al.Susceptibility-weighted imaging: technical aspects and clinical applications, part 1.AJNR Am J Neu-roradiol2009;30:19 –30
9. Nair JR, Van Hecke W, De Belder F, et al.High-resolution susceptibility-weightedimagingat3Twitha32-channelheadcoil:techniqueandclinical applications.AJR Am J Roentgenol2010;195:1007–14
10. Niwa T, Aida N, Takahara T, et al.Imaging and clinical charac-teristics of children with multiple foci of microsusceptibility changes in the brain on susceptibility-weighted MRI.Pediatr Ra-diol2010;40:1657– 62
11. Ong BC, Stuckey SL.Susceptibility weighted imaging: a pictorial review.J Med Imaging Radiat Oncol2010;54:435– 49
12. Robinson R, Bhuta S.Susceptibility-weighted imaging: a major ad-dition to the neuroimaging toolbox.J Neuroimaging2011;21:309 13. Robinson RJ, Bhuta S.Susceptibility-weighted imaging of the
brain: current utility and potential applications.J Neuroimaging 2011;21:e189 –204
14. Wycliffe ND, Choe J, Holshouser B, et al.Reliability in detection of hemorrhage in acute stroke by a new three-dimensional gradient recalled echo susceptibility-weighted imaging technique compared to computed tomography: a retrospective study.J Magn Reson Im-aging2004;20:372–77
15. Tong KA, Ashwal S, Holshouser BA, et al.Hemorrhagic shearing lesions in children and adolescents with posttraumatic diffuse ax-onal injury: improved detection and initial results. Radiology 2003;227:332–39
16. Yamada N, Imakita S, Sakuma T, et al.Intracranial calcification on gradient-echo phase image: depiction of diamagnetic susceptibil-ity.Radiology1996;198:171–78
17. Wu Z, Mittal S, Kish K, et al.Identification of calcification with MRI using susceptibility-weighted imaging: a case study.J Magn Reson Imaging2009;29:177– 82
18. Sehgal V, Delproposto Z, Haacke EM, et al.Clinical applications of neuroimaging with susceptibility-weighted imaging.J Magn Reson Imaging2005;22:439 –50