ORIGINAL
RESEARCH
Reliability of Longitudinal Brain Volume
Loss Measurements between 2 Sites in
Patients with Multiple Sclerosis: Comparison of
7 Quantification Techniques
F. Durand-Dubief B. Belaroussi J.P. Armspach M. Dufour S. Roggerone S. Vukusic S. Hannoun D. Sappey-Marinier C. Confavreux F. Cotton
BACKGROUND AND PURPOSE: Brain volume loss is currently a MR imaging marker of neurodegenera-tion in MS. Available quantificaneurodegenera-tion algorithms perform either direct (segmentaneurodegenera-tion-based techniques) or indirect (registration-based techniques) measurements. Because there is no reference standard technique, the assessment of their accuracy and reliability remains a difficult goal. Therefore, the purpose of this work was to assess the robustness of 7 different postprocessing algorithms applied to images acquired from different MR imaging systems.
MATERIALS AND METHODS:Nine patients with MS were followed longitudinally over 1 year (3 time points) on two 1.5T MR imaging systems. Brain volume change measures were assessed using 7 segmentation algorithms: a segmentation-classification algorithm, FreeSurfer, BBSI, KN-BSI, SIENA, SIENAX, and JI algorithm.
RESULTS: Intersite variability showed that segmentation-based techniques and SIENAX provided large and heterogeneous values of brain volume changes. A Bland-Altman analysis showed a mean differ-ence of 1.8%, 0.07%, and 0.79% between the 2 sites, and a wide length agreement interval of 11.66%, 7.92%, and 11.94% for the segmentation-classification algorithm, FreeSurfer, and SIENAX, respectively. In contrast, registration-based algorithms showed better reproducibility, with a low mean difference of 0.45% for BBSI, KN-BSI and JI, and a mean length agreement interval of 1.55%. If SIENA obtained a lower mean difference of 0.12%, its agreement interval of 3.29% was wider.
CONCLUSIONS:If brain atrophy estimation remains an open issue, future investigations of the accu-racy and reliability of the brain volume quantification algorithms are needed to measure the slow and small brain volume changes occurring in MS.
ABBREVIATIONS:BBSI⫽brain boundary shift integral; GM⫽gray matter; JI⫽Jacobian integra-tion; KN-BSI⫽robust boundary shift integral; SEM⫽standard error of measurement; TBM⫽ tensor-based morphometry
C
onventional MR imaging has proved to be the best way of
monitoring inflammation in MS. However, it lacks a
reli-able evaluation of the neurodegenerative component of the
disease. In the last decade, conventional MR-imaging– based
methods have been developed to provide sensitive and
repro-ducible assessments of brain volume loss that have increased
the interest in brain atrophy as an index of accurate assessment
and monitoring of MS progression.
Different approaches have been developed to assess brain
volume loss. Several algorithms are available to perform its
quantification, based either on direct or indirect
measure-ments. Thus, they are classified as segmentation-based and
registration-based techniques, respectively.
Segmentation-based techniques
1,2are based on tissue classification (CSF,
GM, and WM) in a semiautomated or automated way and
provide brain volume measures at a given time. While
semi-automated techniques are time-consuming and less
repro-ducible, automated techniques are found to be less accurate.
3Segmentation-based techniques such as brain parenchymal
fraction
3,4and brain to intracranial capacity ratio
5can be used
for cross-sectional studies by including normalization for
head size. FreeSurfer (http://surfer.nmr.mgh.harvard.edu),
one of the most recent automatic segmentation-based
algo-rithms, allows the measurement of specific brain anatomic
regions.
6Registration-based methods have been developed to
im-prove longitudinal evaluations. They include brain edge
mo-tion analysis for BBSI, KN-BSI,
7,8SIENA (http://www.fmrib.
ox.ac.uk/fsl),
9,10based statistical analysis for
voxel-based morphometry, statistical parametric mapping,
11and
lo-Received November 18, 2011; accepted after revision January 30, 2012.From Service de Neurologie A et Fondation Euge`ne Devic EDMUS pour la Scle´rose en Plaques (F.D.-D., M.D., S.R., S.V., C.C.), Hoˆpital Neurologique Pierre Wertheimer, Hospices Civils de Lyon, Bron, France; CREATIS, UMR5220 CNRS & U1044 INSERM & Universite´ de Lyon (F.D.-D., S.H., D.S.-M., F.C.), Villeurbanne, France; Universite´ de Lyon (F.D.-D., M.D., S.R., S.V., S.H., D.S.-M., C.C., F.C.), Lyon, France; BIOCLINICA (B.B.), Lyon, France; Institut de Physique Biologique (J.P.A.), Strasbourg, France; Lyon Neuroscience Research Center (S.V., C.C.), INSERM U1028, CNRS UMR5292, Universite´ Lyon 1, Lyon, France; De´partement IRM-CERMEP-Imagerie du Vivant (S.H., D.S.-M.), Bron, France; and Service de Radiologie (F.C.), Centre Hospitalier de Lyon Sud, Pierre Be´nite, France.
This research was sponsored by the French government grant PHRC 2004, referenced 2003.338 and entitled “Evaluation de l’atrophie ce´re´brale en IRM comme marqueur individuel de neurode´ge´ne´rescence progressive du malade atteint de SEP,” and by the ARSEP Foundation (Fondation pour l’Aide a` la Recherche sur la Scle´rose en Plaques). This project was also supported by a public grant from the French Agence Nationale de la Recherche within the context of the Investments for the Future program, referenced ANR-10-COHO-002 and entitled “Observatoire Franc¸ais de la scle´rose en plaques” (OFSEP).
Please address correspondence to Dr. Franc¸oise Durand-Dubief, Service de Neurologie A, Hoˆpital Neurologique Pierre Wertheimer, 59 Boulevard Pinel, 69677 Bron Cedex, France; e-mail: [email protected]
Indicates open access to non-subscribers at www.ajnr.org
cal Jacobian determinant analysis after nonlinear matching
between coregistered images.
12-14However, brain volume loss estimations are affected by
physiopathologic factors such as dehydration, inflammation,
or steroid therapy
15-24and by technical factors such as MR
imaging contrast quality, signal-to-noise ratio, upgrades of
the MR imaging system, field inhomogeneity, and geometric
distortions related to gradients.
25-29Brain volume loss
estima-tion also depends on the reliability of the postprocessing
algo-rithms used. As no reference standard technique is available,
the robustness of each algorithm is thus difficult to estimate.
Recently, simulated brain volume loss measurements became
available and provide data of known atrophy.
12,14,30-32Despite
extensive use in epidemiologic series or clinical trials,
valida-tion of different techniques remains a major problem.
In this article, our objective was to compare the reliability
of brain volume change measurements across 2 MR imaging
sites of acquisition while using 7 different quantification
algorithms. The algorithms used for this comparison are a
segmentation-classification algorithm, FreeSurfer, BBSI,
KN-BSI, SIENA, SIENAX (http://www.fmrib.ox.ac.uk/fsl), and a
JI algorithm.
Materials and Methods
Patients
Nine patients were selected from a large cohort of 90 patients with MS participating in a longitudinal, biannual clinical and MR imaging follow-up. Patients were recruited from the MS clinic at the Neuro-logic Hospital, Lyon, France. Inclusion criteria were definite MS, ac-cording to the McDonald et al criteria,33and age 18 –50 years. All clinical subtypes were represented: clinically isolated syndromes, re-lapsing-remitting MS, secondary-progressive MS, and primary-pro-gressive MS. Exclusion criteria were pregnancy at inclusion and any contraindication to a MR imaging examination. Immunoactive treat-ments were allowed. All patients gave written informed consent to participate in the longitudinal follow-up study, which was approved by the local ethics committee. The 9 patients (2 women and 7 men; 3 relapse-remitting MS, 3 secondary-progressive MS and 3 primary-progressive MS) were selected because they underwent MR imaging examinations on 2 different MR imaging systems at 3 separate time points over 1 year of follow-up—at inclusion and at 6 and 12 months. Mean age at the inclusion was 41 years (range, 27– 46 years), mean disease duration was 8 years (range, 2–18 years), and mean Expanded Disability Status Scale score was 4.5 (range, 2– 6.5). Six patients re-ceived an immunoactive treatment during the period of observation.
MR Imaging Follow-Up
MR imaging examinations were performed at the 3 evaluations over a period of 1 year at each radiologic site. Images were acquired at least 1 month after a clinical relapse and/or a course of steroids. At each time point, 2 MR imaging scans were consecutively performed on 2 different systems: a 1.5T Intera (Philips Healthcare, Best, The Neth-erlands), located within the radiology department at the Neurologic Hospital of Lyon (hereafter, MRI1), and a 1.5T Sonata system (Sie-mens, Erlangen, Germany), located in the MR imaging department of CERMEP-Imagerie du vivant (hereafter, MRI2). The MR imaging protocol consisted of the acquisition of 3D millimetric T1 images without gadolinium injection using a 3D T1 fast-field echo sequence (TR, 7.56 ms; TE, 3.69 ms; matrix, 256⫻256; section thickness, 2
mm; reconstructed in 1 mm; 180 sections; scan time 7 minutes and 10 seconds) with MRI1, and a MPRAGE 3D T1 (inversion recovery– turbo-flash; TR, 1970 ms; TE, 3.93 ms; TI, 1100 ms; matrix, 256⫻ 256; section thickness, 1 mm; integrated parallel acquisition tech-niques, 2, 176 sections; scan time 4 minutes and 37 seconds) with MRI2. The overall image count obtained in this follow-up was 27 acquisitions on each MR imaging system.
Image Analysis
Seven postprocessing software programs were assessed, including 2 segmentation-based algorithms—a Bayesian tissue classification al-gorithm and FreeSurfer—and 5 registration-based alal-gorithms: BBSI, KN-BSI, SIENA, SIENAX, and JI. Image analysis was performed ran-domly on the 27 pairs of images, blinded to patient clinical character-istics and clinical status.
Preprocessing
With the exception of SIENA, SIENAX, and FreeSurfer, which have their own preprocessing pipeline as part of the processing package, preprocessing steps consisted of the following: automatic extraction of the intracranial cavity mask at baseline; correction of intensity in-homogeneities using the N3 technique34for all time points; rigid reg-istration of follow-up scans on the baseline scan, by optimizing mu-tual information to correct for rotations and translations inside the magnet; and differential bias field correction35to correct for differ-ences in intensity inhomogeneity artifacts.
Markov Random Field–Based Tissue Classification
The unsupervised and adaptive classification algorithm used for au-tomatic segmentation of brain tissue into CSF, GM, and WM is de-tailed elsewhere.36The algorithm allows unsupervised classification of the data in any number of tissue classes. It uses a statistical model that includes Bayesian distributions for brain tissue intensities and Gibbs Random Fields– based spatial contiguity constraints. Unsuper-vision is derived from the data and adaptivity is achieved through the variation of the size of the neighborhoods used for the estimation of the intensity characteristics. This allows slow variations of signal in-tensity in space to account for MR imaging inin-tensity nonuniformity. Each scan was independently processed and reviewed by an experi-enced neurologist. Manual editing was performed to correct for clas-sification errors.FreeSurfer
The volume-based subcortical segmentation and surface-based cortical reconstruction on 3D T1-weighted images was performed using FreeSurfer software. The volume-based stream is an automated process that resections 3D spoiled gradient-echo T1WI to approximately 1 mm3voxel size for whole-brain tissue segmentation and specific sub-cortical region tissue volumes. The stream consists of 5 different stages.6 Initially, the MR imaging volumes are registered to the Talairach space and the output images are intensity normalized. At the next stage, the skull is automatically stripped off the 3D anatomic dataset by a hybrid method that uses both watershed algorithms and deformable surface models. After skull stripping, the output brain mask is labeled using a probabilistic atlas, where each voxel in the normalized brain mask vol-ume is assigned 1 of the following labels: cerebral white matter, cerebral cortex, lateral ventricle, inferior lateral ventricle, cerebellum white mat-ter, cerebellum cortex, thalamus, caudate, putamen, pallidum, hip-pocampus, amygdala, accumbens area, third ventricle, fourth ventricle,
BRAIN
ORIGINAL
brain stem, and CSF. For this study, FreeSurfer was run automatically with the default parameters.
BBSI and KN-BSI
BBSI is a semiautomated measure of global cerebral atrophy rates from serial MR imaging images.7,37The BBSI estimates the changes in cerebral volume using differences in voxel intensities between 2 serial MR imaging volume scans at the boundary region of the brain. BBSI assumes that differences between registered scans near the boundaries of cerebral structures are associated solely with the shifting of adjacent tissue. To compute the BBSI, the baseline and follow-up whole-brain regions are first delineated, using the classification algorithm previ-ously described. A boundary and internal regions are obtained from the pair of whole brain regions. Then, intensities of the baseline and follow-up images are normalized by dividing these by the mean in-tensity inside the internal regions, respectively. Finally, the BBSI is computed within the boundary region using a prespecified manually chosen intensity window (I1/I2⫽0.65/0.45 for site 1 and 0.50/0.70 for site 2). KN-BSI was proposed to improve the robustness and re-producibility of boundary shift integral brain atrophy measurements in multisite image studies.38There are 2 main improvements of the boundary shift integral: a specific intensity normalization is achieved by using K-means clustering of brain tissues and linear regression between their mean intensities. The intensity window is automatically computed from K-means clustering results, independently for each image.
SIENA
SIENA gives a fully automated analysis of whole-brain atrophy.9,10 It includes 2 stages of segmentation: Brain Extraction Tool and the Automated Segmentation Tool from the FMRIB Software Library (http://www.fmrib.ox.ac.uk/fsl). Brain Extraction Tool makes a his-togram of intensities and then transforms the image into a binary mask (object/background), which defines the center of gravity.10The 2 brain images are registered to each other using the skull images.39,40 Then, FMRIB Automated Segmentation Tool classifies voxels within the brain mask of Brain Extraction Tool, in at least 3 or 4 classes, according to their intensities, to distinguish CSF from brain paren-chyma and background, with or without GM-WM separation.41The resulting mask corresponds to brain parenchyma. Edge displacement between the 2 time points is then estimated by aligning the peaks of the spatial derivatives of the intensity profiles of both images, to sub-voxel accuracy. Finally, the mean edge displacement is converted into a global estimate of percentage brain volume change between the 2 time points. Full automation limits the interactivity of the software. Errors during 1 of the processing steps require a restart of the whole procedure. For this study, SIENA was run with no manual correction and with the default parameters.
SIENAX
SIENAX gives a fully automated quantification of brain volume with a normalization for head size.10The algorithm extracts the skull and brain masks from 1 time-point image, which are then registered to the Montreal Neurological Institute 152 space. Images are thereby nor-malized for head size using the skull images to determine the registra-tion scaling. Tissue segmentaregistra-tion is then realized to calculate the brain and gray and white matter volumes. The outputs provide normalized and un-normalized volumes. For this study, SIENAX was run auto-matically with the default parameters.
3D JI Using Tensor-Based Morphometry
TBM identifies regional structural differences, after nonlinear warp-ing, between an image and a common anatomic template, for cross-sectional analysis, or between 2 images of the same subject, for lon-gitudinal analysis.42-44 A Jacobian matrix (referred to as “J”) is obtained for each voxel by taking gradient derivatives of the deforma-tion field resulting from the nonlinear warping.45The determinant of these Jacobian matrices (J) represent an expansion (J⬎1) or a contraction (J⬍1) of each voxel after nonlinear warping, and can be represented in 3D. These voxel changes, or Jacobian determinant changes, are then integrated over the brain region to obtain an atrophy estimation of that region. TBM requires little manual inter-action and is recognized as a favorable technique for large-scale brain studies.46The TBM techniques differ in the nonlinear registration algorithms used for the warping.47In this study, the nonlinear regis-tration technique detailed in Vemuri et al48is used for warping, and brain atrophy is estimated by comparing each follow-up scan to the baseline scan. The expansion of the total intracranial CSF is quantified as an indirect marker of the brain parenchyma volume loss in order to limit any influence of the inflammatory activity within the brain parenchyma.
Statistical Analysis
The statistical analysis compared the results of brain volume loss ob-tained from each site. Intersite variability was measured by comparing the results obtained by each technique in both sites, MRI1 and MRI2. Comparisons were performed using first the Wilcoxon signed rank for the comparison of the mean percentage of brain volume loss, and then a Spearman correlation coefficient was established and tested. A Bland-Altman analysis was also performed. Finally, the SEM was es-timated as:
SEM⫽
冑
1patients number⫺1䡠
冘
patient i
(MRI1⫺MRI2)2
Results
A description of the means, standard deviations, and median
percentages of brain volume changes between the 7 techniques
is presented for each time point and each site, MRI1 (Table 1)
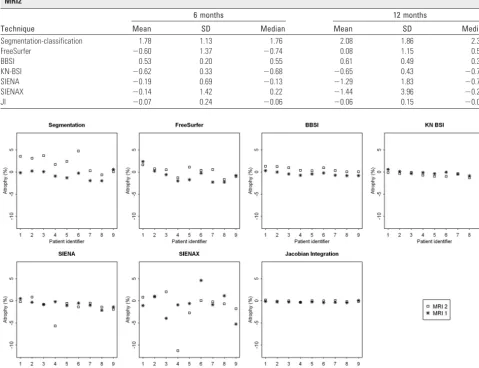
and MRI2 (Table 2). Fig 1 represents the changes in brain
volume obtained in both sites from the 7 techniques for
each patient. The results showed significant differences in
percentages between the 2 sites for segmentation-based
tech-niques, such as the segmentation-classification algorithm and
FreeSurfer. In contrast, the BBSI, KN-BSI, and JI methods
provided fairly stable results between the 2 sites. The results
were also similar for SIENA, except for 1 patient (number 4)
who presented a wide range of differences. SIENAX provided
variable and heterogeneous results between the 2 sites.
difference, close to 0.07%, but kept a large length agreement
interval of 7.92%. In contrast, registration-based techniques
such as BBSI, KN-BSI, and JI algorithms were less sensitive to
MR imaging system changes. The mean difference for these 3
techniques was equal to 0.45%, with a mean length agreement
interval of 1.55%. SIENA obtained a reduced mean
differ-ence of 0.12% but a wider agreement interval of 3.29%. As
estimated by the SEM and the delta values, the variability
was larger for segmentation-based techniques and lower for
registration-based techniques (Table 3).
Discussion
[image:4.594.59.531.69.174.2]As atrophy is a slow process leading to small changes, the
tech-niques used for its quantification have to be accurate and
re-liable.
49In this work, we performed a comparative study of
brain volume changes measured on 2 MR imaging systems,
across 3 time points over 1 year, to evaluate the intersite
vari-ability and robustness. The acquisitions were performed on
9 MS patients and postprocessed by 7 different methods.
The main findings showed that segmentation-based
tech-niques provided larger and more heterogeneous values of
Table 1: Description of the mean, standard deviation, and median percentages of atrophy between the 7 techniques at 6 and 12 months on MRI1Technique
6 months 12 months
Mean SD Median Mean SD Median
Segmentation-classification ⫺0.03 2.87 ⫺0.73 ⫺0.64 0.95 ⫺0.26
FreeSurfer ⫺0.53 0.74 ⫺0.61 ⫺0.83 1.51 ⫺0.81
BBSI ⫺0.32 0.29 ⫺0.33 ⫺0.45 0.39 ⫺0.46
KN-BSI ⫺0.29 0.37 ⫺0.38 ⫺0.26 0.45 ⫺0.34
SIENA ⫺0.30 0.51 ⫺0.34 ⫺0.78 0.76 ⫺0.85
SIENAX ⫺0.94 2.26 ⫺0.80 ⫺0.66 2.88 ⫺0.88
[image:4.594.53.533.200.568.2]JI ⫺0.26 0.12 ⫺0.24 ⫺0.26 0.16 ⫺0.27
Table 2: Description of the mean, standard deviation and median percentages of atrophy between the 7 techniques at 6 and 12 months on MRI2
Technique
6 months 12 months
Mean SD Median Mean SD Median
Segmentation-classification 1.78 1.13 1.76 2.08 1.86 2.39
FreeSurfer ⫺0.60 1.37 ⫺0.74 0.08 1.15 0.50
BBSI 0.53 0.20 0.55 0.61 0.49 0.35
KN-BSI ⫺0.62 0.33 ⫺0.68 ⫺0.65 0.43 ⫺0.75
SIENA ⫺0.19 0.69 ⫺0.13 ⫺1.29 1.83 ⫺0.76
SIENAX ⫺0.14 1.42 0.22 ⫺1.44 3.96 ⫺0.23
JI ⫺0.07 0.24 ⫺0.06 ⫺0.06 0.15 ⫺0.03
Fig 1.Representation of the percentages of brain volume change at 12 months obtained between sites MRI1 (*) and MRI2 (e) by each of the 7 techniques: the segmentation-classification
brain volume changes than registration-based techniques.
Segmentation-based algorithms used in a semiautomatic way
(with manual correction) are theoretically considered as
ref-erence standard techniques, as they provide data for each
brain volume measurement from segmented masks validated
by an observer. However, due to necessary manual
correc-tions, these algorithms are time consuming and less
repro-ducible. Thus, automatic segmentation-based algorithms
are preferred.
50The most recent automatic segmentation
al-gorithm is FreeSurfer, which seemed more reliable than
the classification algorithm used in this work. Nevertheless,
segmentation-based algorithms are influenced by the quality
of the acquisitions. BBSI, KN-BSI, JI, and, to a lesser extent,
SIENA algorithms were less sensitive to MR imaging changes.
The mean difference for BBSI, KN-BSI and JI was close to
0.45% and for SIENA was 0.12%. Mean length agreement
in-tervals were, respectively, 1.55% for BBSI, KN-BSI and JI and
3.29% for SIENA. This is probably related to fewer errors
in-duced by the postprocessing based on registration. Otherwise,
the results obtained by SIENAX were more heterogeneous and
discordant, confirming that SIENAX should be reserved for
cross-sectional studies.
No matter which algorithm of quantification is used,
sev-eral factors of variability may interfere with the evaluation of
brain volume loss at a given time. Significant physiologic
changes related to age and state of hydration
15,28,51can lead to
amplitude of variation up to 0.70% of the brain volume.
16,17In
MS, inflammatory activity corresponding to the occurrence of
acute lesions transiently increases brain volume.
18At the
opposite end, treatments with high doses of corticosteroids
or disease-modifying treatments may significantly and
tem-porarily reduce brain volume.
19-23,52These physiopathologic
factors have a greater impact than the variations cause by
scan–rescan.
17,53In this study, these factors may not have
in-fluenced the results, as each patient was explored with each
MR imaging system on the same day, under the assumption
that changes caused by physiopathologic processes are not
likely to occur during that time. Acquisition-related factors
may also affect automated quantitative analysis results and
lead to an incorrect quantification.
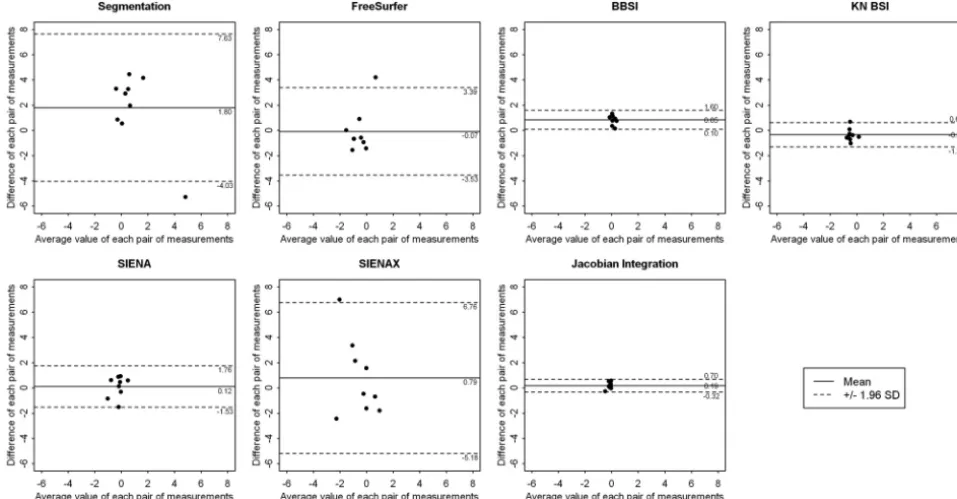
25Within the same scanner
Fig 2.Representation of the results of the Bland-Altman analysis for comparing the results obtained between site MRI1 and MRI2 at 6 months by each of the 7 techniques: the
[image:5.594.53.532.45.294.2]segmentation-classification algorithm, FreeSurfer, BBSI, KN-BSI, SIENA, SIENAX, and JI. These graphics represent the difference between the 2 sites, against the average value, of each pair of measurements. A continuous line and 2 dotted lines were added to each scatterplot and depict the mean difference between the 2 sites and the limits of agreement, respectively.
Table 3: Bland-Altman analysis and standard error of measurement and corresponding delta values for the results obtained by the seven techniques between the 2 sites MRI1 and MRI2
Technique
Bland-Altman Analysis Standard Error of
Measurement
Mean difference (%)
Limits of agreement
Inf Sup SEM ␦
Segmentation-classification 1.80 ⫺4.03 7.63 3.54 9.80
Free Surfer ⫺0.07 ⫺3.53 3.39 1.77 4.90
BBSI 0.85 0.10 1.60 0.98 2.71
KN-BSI ⫺0.33 ⫺1.30 0.63 0.61 1.68
SIENA 0.12 ⫺1.53 1.76 0.85 2.35
SIENAX 0.79 ⫺5.18 6.76 3.16 8.76
JI 0.19 ⫺0.32 0.70 0.33 0.91
[image:5.594.54.534.365.478.2]platform, upgrades do not significantly modify the results, but
differences of field strength may introduce a slight bias.
27,28However, in this study, the 2 systems were not upgraded and
the B
0fields were the same. In addition, inhomogeneity of the
B
1field can affect the reliability of tissue segmentation, as it
creates image intensity distortions. However, recent studies
using FreeSurfer software showed no significant changes when
using or not using a correction of B
1image intensity
inhomo-geneities.
27,32Patient positioning (Z-positioning) has an effect
on morphometric analyses in within-site or multisite
evalua-tions.
26,29It increases the mean absolute main error of SIENA
from 0.17% to 0.40%.
26The authors propose a correction for
the gradient distortion, which reduced this mean absolute
er-ror to 0.15%.
26The combination of datasets obtained from
different manufacturer MR imaging platforms introduces a
bias that should be considered in multisite studies.
27,28Conclusions
In this article, we evaluated the impact of changing MR
imaging systems on the results of brain volume quantification
and assessed the robustness of 7 postprocessing algorithms.
Intersite variability showed that segmentation-based
tech-niques provided larger and more heterogeneous results
than registration-based techniques. Segmentation-based
algo-rithms are influenced by the quality of the acquisitions, and
their use in longitudinal studies might not be recommended
because of their variability. In contrast, this study showed a
better reproducibility of the registration-based algorithms,
such as BBSI, KN-BSI, JI, and, to a lesser extent, SIENA, which
provided lower and more homogeneous results.
Quantifica-tion algorithms insensitive to the quality of MR imaging
ac-quisitions should be preferred, as MR imaging acac-quisitions are
usually performed on different MR imaging systems in clinical
practice. Nevertheless, MR imaging acquisitions should be
performed at the same MR imaging site in case of longitudinal
follow-ups. In the future, new postprocessing algorithms
us-ing field inhomogeneity and geometric distortion correction
are needed to improve the accuracy of brain volume change
quantification.
Acknowledgments
The authors would like to express their gratitude to the staff of
CERMEP-Imagerie du Vivant for their assistance in the
acqui-sition of the data. We are grateful to Dr. Salem Hannoun for
his help in preparing the manuscript and useful comments.
Disclosures: Franc¸oise Durand-Dubief—RELATED: Grant:PHRC (Programme Hospitalier de Recherche Clinique) Re´gional 2004.* Sandra Vukusic—UNRELATED: Board Membership: Merck-Serono, Biogen-Idec, Sanofi-Aventis, Teva Pharma, Bayer, Novartis;Consultancy: Merck-Serono, Biogen-Idec, Sanofi-Aventis, Teva Pharma, Bayer, Novartis;Grants/Grants Pending:Merck-Serono, Biogen-Idec, Sanofi-Aventis, Teva Pharma, Bayer, Novartis; Pay-ment for Lectures (including service on speakers bureaus):Merck-Serono, Biogen-Idec, Sanofi-Aventis, Teva Pharma, Bayer, Novartis;Payment for Development of Educational Presentations:Biogen-Idec, Novartis;Travel/Accommodations/Meeting Expenses Unrelated to Activities Listed:Merck-Serono, Biogen-Idec, Sanofi-Aventis, Teva Pharma, Bayer, Novartis. Christian Confavreux—UNRELATED: Board Membership:Biogen-Idec, Genzyme, Novartis, Sanofi-Aventis, Teva Pharma, UCB Pharma;Consultancy:Biogen Dompe´, Biogen-Idec, Gemacbio, Genzyme, Hertie Foundation, Novartis, Sanofi-Aventis, Teva Pharma, UCB Pharma;Grants/Grants Pending:Bayer Schering,* Biogen-Idec,* Merck-Serono,* Novartis,* Sanofi-Aventis,* Teva Pharma;Payment for Lectures (including service on speakers bu-reaus):Bayer Schering, Biog-Idec, Merck-Serono, Novartis, Sanofi-Aventis, Teva Pharma; Royalties:Elsevier, Comments:McAlpine’s Multiple Sclerosis, Edition 4. (*Money paid to institution)
References
1. Filippi M, Mastronardo G, Rocca MA, et al.Quantitative volumetric analysis of brain magnetic resonance imaging from patients with multiple sclerosis.
J Neurol Sci1998;158:148 –53
2. Simon JH, Jacobs LD, Campion MK, et al.A longitudinal study of brain atro-phy in relapsing multiple sclerosis: the Multiple Sclerosis Collaborative Research Group (MSCRG).Neurology1999;53:139 – 48
3. Horsfield MA, Rovaris M, Rocca MA, et al.Whole-brain atrophy in multiple sclerosis measured by two segmentation processes from various MRI se-quences.J Neurol Sci2003;216:169 –77
4. Sharma J, Sanfilipo MP, Benedict RH, et al.Whole-brain atrophy in multiple sclerosis measured by automated versus semiautomated MR imaging seg-mentation.AJNR Am J Neuroradiol2004;25:985–96
5. Collins DL, Montagnat J, Zijdenbos AP, et al. Automated estimation of brain volume in multiple sclerosis with BICCR. Lect Notes Comput Sci
2001;2082:141– 47
6. Fischl B, Salat DH, Busa E, et al.Whole brain segmentation: automated label-ing of neuroanatomical structures in human brain.Neuron2002;33:341–55 7. Freeborough PA, Fox NC.The boundary shift integral: an accurate and robust
measure of cerebral volume changes from registered repeat MRI.IEEE Trans Med Imaging1997;16:623–29
8. Freeborough PA, Fox NC, Kitney RI.Interactive algorithms for the segmenta-tion and quantitasegmenta-tion of 3-D MRI brain scans.Comput Methods Programs Biomed1997;53:15–25
9. Smith SM, De Stefano N, Jenkinson M, et al.Normalized accurate measure-ment of longitudinal brain change.J Comput Assist Tomogr2001;25:466 –75 10. Smith SM. Fast robust automated brain extraction. Hum Brain Mapp
2002;17:143–55
11. Ashburner J, Friston KJ.Voxel-based morphometry—the methods. Neuroim-age2000;11:805–21
12. Camara O, Schnabel JA, Ridgway GR, et al.Accuracy assessment of global and local atrophy measurement techniques with realistic simulated longitudinal Alzheimer’s disease images.Neuroimage2008;42:696 –709
13. Boyes RG, Rueckert D, Aljabar P, et al.Cerebral atrophy measurements using Jacobian integration: comparison with the boundary shift integral. Neuro-image2006;32:159 – 69
14. Camara O, Schweiger M, Scahill R, et al.Phenomenological model of diffuse global and regional atrophy using finite-element methods.IEEE Trans Med Imaging2006;25:1417–30
15. Cotton F, Weiner HL, Jolesz FA, et al.MRI contrast uptake in new lesions in relapsing–remitting multiple sclerosis followed at weekly intervals.Neurology
2003;30:640 – 46
16. Duning T, Kloska S, Streinstrater O, et al.Dehydration confounds the assess-ment of brain atrophy.Neurology2005;64:548 –50
17. Sampat MP, Healy BC, Meier DS, et al.Disease modelling in multiple sclerosis: assessment and quantification of sources of variability in brain parenchymal fraction measurements.Neuroimage2010;52:1367–73
18. Dalton CM, Chard DT, Davies GR, et al.Early development of multiple scle-rosis is associated with progressive grey matter atrophy in patients presenting with clinically isolated syndromes.Brain2004;127:1101– 07
19. Gordon N.Apparent cerebral atrophy in patients on treatment with steroids.
Dev Med Child Neurol1980;22:502– 06
20. Hoogervorst EL, Polman CH, Barkhof F.Cerebral volume changes in multiple sclerosis patients treated with high-dose intravenous methylprednisolone.
Mult Scler2002;8:415–19
21. Rao AB, Richert N, Howard T, et al.Methylprednisolone effect on brain vol-ume and enhancing lesions in MS before and during IFNbeta-1b.Neurology
2002;59:688 –94
22. Fox RJ, Fisher E, Tkach J, et al.Brain atrophy and magnetization transfer ratio following methylprednisolone in multiple sclerosis: short-term changes and long-term implications.Mult Scler2005;11:140 – 45
23. Meier D, Weiner H, Guttmann C.MR imaging intensity modelling of damage and repair in multiple sclerosis: relationship of short-term lesion recovery to progression and disability.AJNR Am J Neuroradiol2007;28:1956 – 63 24. Pelletier D, Garrison K, Henry R.Measurement of whole-brain atrophy in
multiple sclerosis.J Neuroimaging2004;14:11S–19S.
25. Bellon EM, Haacke EM, Coleman PE, et al.MR artifacts: a review.AJR Am J Roentgenol1986;147:1271– 81
26. Caramanos Z, Fonov VS, Francis SJ, et al.Gradient distortion in MRI: charac-terizing and correcting for their effects on SIENA-generated measures of brain volume change.Neuroimage2010;49:1601–11
27. Jovicich J, Czanner S, Han X, et al.MRI-derived measurements of human subcortical, ventricular and intracranial brain volumes: reliability effects of scan sessions, acquisition sequences, data analyses, scanner upgrade, scanner vendors and field strengths.Neuroimage2009;46:177–92
28. Han X, Jovicich J, Salat D, et al.Reliability of MRI-derived measurements of human cerebral cortical thickness: the effects of field strength, scanner up-grade and manufacturer.Neuroimage2006;32:180 –94
studies: effects of gradient non-linearity correction on phantom and human data.Neuroimage2006;30:436 – 43
30. Karac¸ali B, Davatzikos C.Simulation of tissue atrophy using a topology pre-serving transformation model.IEEE Trans Med Imaging2006;25:649 –52 31. Pieperhoff P, Sudmeyer M, Homke L, et al.Detection of structural changes of
the human brain in longitudinally acquired MR images by deformation field morphometry: methodological analysis, validation and application. Neuro-image2008;43:269 – 87
32. Sharma S, Noblet V, Rousseau F, et al.Evaluation of brain atrophy estimation algorithms using simulated ground-truth data.Med Image Anal2010;14: 373– 89
33. McDonald WI, Comtston DAS, G Edan G, et al.Diagnostic criteria for MS: guidelines from the international panel on the diagnosis of MS.Ann Neurol
2001;50:121–27
34. Sled JG, Zijdenbos AP, Evans ACA.Nonparametric method for automatic cor-rection of intensity nonuniformity in MRI data.IEEE Trans Med Imaging
1998;1:87–97
35. Boyes RG, Gunter JL, Frost C, et al.Intensity non-uniformity correction using N3 on 3-T scanners with multichannel phased array coils.Neuroimage
2008;39:1752– 62
36. Pachai C, Zhu YM, Guttmann C, et al.Unsupervised and adaptive segmenta-tion of multispectral 3D magnetic resonance images of human brain: a ge-neric approach.Int Conf Med Image Comput Comput Assist Interv2001;4: 1067–74
37. Fox NC, Freeborough PA.Brain atrophy progression measured from regis-tered serial MRI: validation and application to Alzheimer’s disease.J Magn Reson Imaging1997;7:1069 –75
38. Leung KK, Clarkson MJ, Bartlett JW, et al.Robust atrophy rate measurement in Alzheimer’s disease using multi-site serial MRI: tissue-specific intensity nor-malization and parameter selection.Neuroimage2010;50:516 –23
39. Jenkinson M, Smith S.A global optimisation method for robust affine regis-tration of brain images.Med Image Anal2001;36:143–56
40. Jenkinson M, Bannister P, Brady M, et al.Improved optimization for the ro-bust and accurate linear registration and motion correction of brain images.
Neuroimage2002;17:824 – 41
41. Zhang Y, Brady M, Smith S.Segmentation of brain MR images through a hidden Markov random field model and the expectation maximization algo-rithm.IEEE Trans Med Imaging2001;20:45–57
42. Christensen GE, Rabbitt RD, Miller MI.Deformable templates using large de-formation kinematics.IEEE Trans Med Imaging1996;5:1435– 47
43. Davatzikos C, Vaillant M, Resnick SM, et al.A computerized approach for morphological analysis of the corpus callosum.J Comput Assist Tomogr1996; 20:88 –97
44. Thompson PM, Giedd JN, Woods RP, et al.Growth patterns in the developing brain detected by using continuum mechanical tensor maps.Nature2000;404: 190 –93
45. Calmon G, Roberts N.Automatic measurement of changes in brain volume on consecutive 3D MR images by segmentation propagation.Magn Reson Imag-ing2000;18:439 –53
46. Hua X, Leow AD, Parikshak N, et al.Tensor-based morphometry as a neuro-imaging biomarker for Alzheimer’s disease: an MRI study of 676 AD, MCI, and normal subjects.Neuroimage2008;43:458 – 69
47. Klein A, Andersson J, Ardekani BA, et al.Evaluation of 14 nonlinear deforma-tion algorithms applied to human brain MRI registradeforma-tion.Neuroimage2009; 46:786 – 802
48. Vemuri BC, Ye J, Chen Y, et al.Image registration via level-set motion: appli-cations to atlas-based segmentation.Med Image Anal2003;7:1–20 49. Wei X, Guttman CR, Warfeild SK, et al.Has your patient’s multiple sclerosis
lesion burden and brain atrophy actually changed?Mult Scler2004;10:402– 06 50. Jasperse B, Valsasina P, Neacsu V, et al.Intercenter agreement of brain atrophy measurement in multiple sclerosis patients using manually-edited SIENA and SIENAX.J Magn Reson Imaging2007;26:881– 85
51. Dickerson BC, Fenstermacher E, Salat DH, et al.Detection of cortical thickness correlates of cognitive performance: reliability across MRI scan sessions, scanners, and field strengths.Neuroimage2008;39:10 –18
52. Miller DH. Biomarkers and surrogate outcomes in neurodegenerative disease: lessons from multiple sclerosis.Neuroradiology2004;1:284 –94 53. Bermel RA, Sharma J, Tjoa CW, et al.A semiautomated mesure of whole-brain