Nat. Hazards Earth Syst. Sci., 13, 1481–1499, 2013 www.nat-hazards-earth-syst-sci.net/13/1481/2013/ doi:10.5194/nhess-13-1481-2013
© Author(s) 2013. CC Attribution 3.0 License.
EGU Journal Logos (RGB)
Advances in
Geosciences
Open Access
Natural Hazards
and Earth System
Sciences
Open AccessAnnales
Geophysicae
Open AccessNonlinear Processes
in Geophysics
Open AccessAtmospheric
Chemistry
and Physics
Open AccessAtmospheric
Chemistry
and Physics
Open Access DiscussionsAtmospheric
Measurement
Techniques
Open AccessAtmospheric
Measurement
Techniques
Open Access DiscussionsBiogeosciences
Open Access Open Access
Biogeosciences
Discussions
Climate
of the Past
Open Access Open Access
Climate
of the Past
Discussions
Earth System
Dynamics
Open Access Open Access
Earth System
Dynamics
DiscussionsGeoscientific
Instrumentation
Methods and
Data Systems
Open Access
Geoscientific
Instrumentation
Methods and
Data Systems
Open Access DiscussionsGeoscientific
Model Development
Open Access Open Access
Geoscientific
Model Development
DiscussionsHydrology and
Earth System
Sciences
Open AccessHydrology and
Earth System
Sciences
Open Access DiscussionsOcean Science
Open Access Open Access
Ocean Science
DiscussionsSolid Earth
Open Access Open Access
Solid Earth
Discussions
The Cryosphere
Open Access Open Access
The Cryosphere
Natural Hazards
and Earth System
Sciences
Open Access
Discussions
Social vulnerability assessment using spatial multi-criteria analysis
(SEVI model) and the Social Vulnerability Index (SoVI model)
– a case study for Bucharest, Romania
I. Armas,1and A. Gavris,2
1Department of Geomorphology – Pedology – Geomatics, University of Bucharest, 1 Nicolae B˘alcescu Avenue,
Bucharest, Romania
2Department of Tourism and Geography, The Bucharest University of Economic Studies, 13–15 Calea Dorobant
,ilor,
Bucharest, Romania
Correspondence to: A. Gavris, (alexandru.gavris@rei.ase.ro)
Received: 12 September 2012 – Published in Nat. Hazards Earth Syst. Sci. Discuss.: – Revised: 27 January 2013 – Accepted: 11 April 2013 – Published: 18 June 2013
Abstract. In recent decades, the development of
vulnerabil-ity frameworks has enlarged the research in the natural haz-ards field. Despite progress in developing the vulnerability studies, there is more to investigate regarding the quantita-tive approach and clarification of the conceptual explanation of the social component. At the same time, some disaster-prone areas register limited attention. Among these, Roma-nia’s capital city, Bucharest, is the most earthquake-prone capital in Europe and the tenth in the world. The location is used to assess two multi-criteria methods for aggregat-ing complex indicators: the social vulnerability index (SoVI model) and the spatial multi-criteria social vulnerability in-dex (SEVI model). Using the data of the 2002 census we reduce the indicators through a factor analytical approach to create the indices and examine if they bear any resemblance to the known vulnerability of Bucharest city through an ex-ploratory spatial data analysis (ESDA). This is a critical issue that may provide better understanding of the social vulnera-bility in the city and appropriate information for authorities and stakeholders to consider in their decision making. The study emphasizes that social vulnerability is an urban pro-cess that increased in a post-communist Bucharest, raising the concern that the population at risk lacks the capacity to cope with disasters. The assessment of the indices indicates a significant and similar clustering pattern of the census ad-ministrative units, with an overlap between the clustering ar-eas affected by high social vulnerability. Our proposed SEVI model suggests adjustment sensitivity, useful in the expert-opinion accuracy.
1 Introduction
Environmental disasters are the combined result of stress and exposure on one hand, and the fragility and vulnerability of the human society on the other hand (Weichselgartner, 2001; Turner et al., 2003; Adger et al., 2004; UN/ISDR, 2004; Downing and Patwardhan, 2004; Kasperson and Kasperson, 2005; Birkmann, 2006b). As the amount of losses from dis-asters increases at a striking pace, to understand and to define vulnerability becomes highly important, especially concern-ing practical applications and methods. The common under-standing of vulnerability and the ability to measure it become keys to addressing disasters through managing the conse-quences and setting targets (Kasperson and Kasperson, 2005; Birkmann, 2006a).
The paper examines two multi-criteria methods that aggre-gate complex indicators, aiming to reveal the social vulnera-bility of the city of Bucharest in an earthquake context and to explore the statistical results in a spatial approach. We also aim to introduce a less-known geographical region to many readers and in this way expand the empirical evidence of vul-nerability assessment.
The following topics introduce the emergence of the con-cept, emphasizing the coexistence of different ways to ap-proach social vulnerability from the view of biophysical and social sciences. In the paper we use a model of conceptu-alization of vulnerability that consists of two approaches; Füssel (2005): a human geography approach aiming to un-derstand the vulnerability of a system to adverse effects of hazards, in this case Bucharest city’s area to the earthquake
1482 I. Armas, and A. Gavris,: Social vulnerability assessment with SEVI and SoVI model
hazard, and a human ecology approach that aims to ascer-tain who is vulnerable and why. In sections three to seven we show the framework of analysis, we identify the region of concern, arguing the type of hazard involved in the vul-nerability assessment and finally, we make comments on the valuated attributes and relate them to the year 2002. Further-more we used four categories of vulnerability factors1, classi-fied by Füssel (2009) to show the framework of analysis and identify the region of concern, indicating the type of hazard involved in the vulnerability assessment.
2 Organizing framework
To discern the framework of vulnerability, in this section the paper expands on the historical roots of the concept. To date there is no unique understanding of vulnerability (Fuchs et al., 2007) that proves weak agreement in the field (Villagran de Leon, 2006). While there are significant efforts to develop and improve the concept in different contexts (Adger et al., 2005; Eakin and Luers, 2006; Füssel, 2007a), the vulnerability term remains hampered by an inconsistent conceptual register.
The concept of vulnerability implies an array of different meanings argued from the perspective of the scientific back-ground of the researchers, and the trends of conceptual de-velopments. Split between the assessment of the impact from the technical perspective and the socio-economic factors plus the resilience analysed by social science, vulnerability has the consideration of the receptors as the only common point (Fuchs et al., 2011).
Vulnerability is broadly defined as the “potential for loss” (Petak and Atkisson, 1982; Susman et al., 1983; Mitchell, 2000; Thywissen, 2006), or as a predictive variable that des-ignates the potential for being harmed relative to the elements at risk and event intensity (Kates, 1985; Dow, 1992; Ionescu et al., 2009). Other authors introduced the human element as the “property of life” (Cutter et al., 2000), as the main poten-tial risk factor when hazards occur. This approach triggered by the United Nations Disaster Relief Oraganization (UN-DRO) emphasizes that “vulnerability is the degree of loss to a given element or set of elements at risk, resulting from the occurrence of a natural phenomenon of a given magni-tude” (UNDRO, 1982, p. 5). With good support from a high number of studies, different methodologies analysing vulner-ability emerged and other definitions were formulated. The conceptual framework expanded with the inclusion of coping and resilience concepts (Blaikie, 1994; Hewitt, 1997; Blaikie et al., 2004; Cutter and Emrich, 2006; Yarnal, 2007). But in
1The four categories are: IS (internal socio-economic –
house-hold income, social life, access to information), IB (internal bio-physical – topography, environmental conditions, land cover), EB (external biophysical – severe hazards, earthquake etc.) and ES (ex-ternal socio-economic – national, regional, international policies, economic globalization).
the social sciences, vulnerability lacks a unified definition (Timmerman, 1981; Liverman, 1990; Cutter, 1996; Weich-selgartner, 2001; Kasperson and Kasperson, 2005; Thywis-sen, 2006; Fuchs et al., 2007) with different interpretations of the same concept (Miller et al., 2010).
The use of the concept of vulnerability in the social frame-work was introduced by O’Keefe et al. (1976) to explore the key role played by socioeconomic factors in creating a weakness in responding to, and recovering from, the ef-fects of extreme natural events. By the early 1980s, a num-ber of theoretical developments were made (White, 1973; O’Keefe et al., 1976; Westgate and O’Keefe, 1976; Haas et al., 1977; Burton et al., 1978) alongside numerous case studies. The growing literature provided support to evalu-ate and explore the vulnerability concept for the first time (Timmerman, 1981). Susman et al. (1983) also emphasized the specific social inequalities that define vulnerability. Thus began the understanding of social vulnerability as the capac-ity of society to cope with hazards and their effects (Blaikie, 1994; Bohle et al., 1994; Cutter, 1996; Cutter et al., 2003).
Some important conceptual models were developed to give disaster managers a framework for understanding vul-nerability to disasters and for reducing them: capacities and vulnerabilities analysis (CVA) (see Anderson and Woodrow, 1989), the Risk-Hazard model (Burton and White, 1993), the Pressure and Release (PAR)/access models (Blaikie, 1994; Blaikie et al., 2004), Internal-external model (Bohle, 2001), BBC (Birkmann and Wisner, 2006), Social vulnerability models (see Preston et al., 2011), Expanded-Vulnerability Framework (Turner et al., 2003). Their scrutiny lead to prin-ciples to follow (Füssel, 2007a), addressing key challenges of vulnerability (Preston et al., 2011), or adapting the advan-tages of other models and proposing the modelling of vulner-ability (Marchand, 2009).
Although recent work generated guidelines and clarifi-cation (Birkmann and Wisner, 2006; Füssel, 2007b; Miller et al., 2010; McEntire, 2011), in a large number of stud-ies, the conceptual development of vulnerability suffers from the lack of clear relation between the theory and the em-pirical work (Zou and Thomalla, 2008). Being more politi-cally driven – IHDP (International Human Dimensions Pro-gramme on Global Environmental Change) (Dyck, 2001), it puts pressure on the allocation of resources and the evalua-tion of the effects regarding the financial investment for man-aging vulnerability. In this context, to manage social vulnera-bility converges towards institutional involvement (Renn and Walker, 2008; Gaillard, 2010), while other directions empha-size the critical importance of disasters social dynamics and of barriers to the science-policy interface (Dowty and Allen, 2011; Kasperson and Berberian, 2011).
I. Armas, and A. Gavris,: Social vulnerability assessment with SEVI and SoVI model 1483
complex systems, alongside explanation of the methodologi-cal background.
Our paper builds on the main strands of vulnerability re-search and combines traditional with up-to-date approaches, performing a multi-criteria analysis in a spatial manner. The vulnerability approach comes from the social sciences per-spective, which contests the physical view that considers population as an “undifferentiated mass”. From the social sciences perspective on vulnerability, the hazards may be nat-ural while the disasters are not. The pattern of disasters inter-connects with the social class system and the position of ad-vantage or disadad-vantage that a particular group occupies. In this context, some people are more affected by the distribu-tion and growth of risks (Beck, 1992). A variadistribu-tion of ascribed characteristics of people such as: class, gender, age, ethnic-ity, disability and others determines a position of advantage or disadvantage regarding disasters.
Social vulnerability is context-dependent and, by its na-ture, the result of a concatenation of factors, as highlighted by Wisner and Luce (1993). Particularities of socio-ecological contexts can generate diverse patterns of vulnerability. In this study, a social vulnerability approach connects to the perspective emphasized by Steinführer et al. (2009), which expresses that everyone may be at risk, but some social groups may have a better response to disasters in specific circumstances. The concept of social vulnerability is used similarly to the one that Blaikie (1994) proposed. From this perspective, the social vulnerability creates a potential instability that results from scarcity of resources (material and non-material), identifiable in an area. Major events can easily destabilize the precarious equilibrium established in areas with high social vulnerability. Disasters result from the double interaction between hazard processes and social conditions, which actively construct the form and scale in which those natural processes expresses themselves (Mor-row, 1999; Blaikie, 1994; Tapsell et al., 2005).
3 Aim and motivation
Our research belongs to the broad area of quantitative assess-ment of vulnerability and index construction. The working definition overlaps with the hazards of place model (Cutter et al., 2003), whereby measurement of societal features en-ables aggregation of results for, and spatial identification of vulnerability.
The structural design of vulnerability indices (Guillaumont and Simonet, 2011) appears as the most outstanding methodology with numerous applications alongside its three variants (Tate, 2012). More advanced assessments rely on integrating GIS-based modelling (Rashed and Weeks, 2003; Ebert et al., 2009). The starting point was the shift in paradigm (Birkmann, 2006b) that emphasizes the focus on identification, assessment and ranking of vulnerabilities. The main objective is to compare
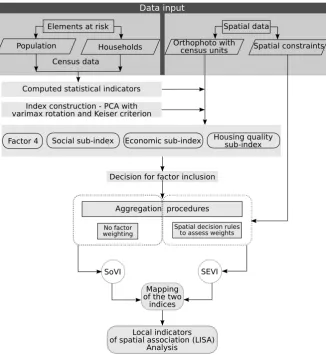
two different models to design social vulnerability: Cutter et al.’s (2003) SoVI (Cutter et al., 2003; Cutter and Finch, 2008) and the SEVI semi-quantitative technique based on a GIS-supported raster database and built as a spatial decision problem of vulnerability. Building and validating complex social vulnerability indices for Bucharest was a secondary aim. The two methodological constructions at the core of the inquiry rely on what is currently the most widely used model of vulnerability (Cutter et al., 2003; Adger et al., 2004; Vincent, 2004; Wisner, 2006; Mustafa et al., 2011; Tapsell et al., 2010). The two indices resulted from a composite approach of factor analysis, while a different aggregation was used: linear (SoVI model) vs. weighting (SEVI model) (Fig. 1).
The SoVI model (Cutter et al., 2003) evolved from the hazards of place model (Cutter, 1996) and of a previous vari-ant (Cutter et al., 2000). It aims to examine the components of social vulnerability and determine whether they can be used to predict disaster impacts. As the model gained sup-port from other researchers, it allowed for improvements, such as depicting temporal changes of vulnerability (Cutter and Finch, 2008; Schmidtlein et al., 2008). Moreover, many studies scrutinized the model in the US and nearby areas, at various scales (Boruff et al., 2005; Cutter and Emrich, 2006; Borden et al., 2007; Boruff and Cutter, 2007; Cut-ter and Finch, 2008; Schmidtlein, 2008; Schmidtlein et al., 2008; Yeletaysi et al., 2009; Morath, 2010), and more re-cently in Europe (de Oliveira Mendes, 2009; Holand et al., 2011; Holand and Lujala, 2013), to show different constructs in algorithm (Chakraborty et al., 2005; Rygel et al., 2006; Yeletaysi et al., 2009; Lopes et al., 2010) and changes in the way in which variables should be interpreted to the local conditions. In one respect, the model was de-constructed to a more complex index – Disaster Preparedness Index (Simpson and Katirai, 2006). The outcome and the critical review of the index (Rygel et al., 2006; Schmidtlein, 2008), as well as the algorithm enhancement (Schmidtlein et al., 2008) high-lighted the robustness of the index and the theoretical signif-icance of variables.
The theoretical background for the multi-criteria evalu-ation (SEVI) stands on the analytical hierarchical process (AHP), developed by Saaty (1980, 2008), as a combination of expert judgement and statistical methods used to deter-mine relative weights (Gall, 2007). The main difference be-tween the SEVI method and conventional multi-criteria deci-sion making techniques is its facility to capture the evaluation criteria variation across space. The inductive design structure of SEVI allows for the gathering of spatial evidence, which supports or rejects an alternative, using divergent perspec-tives on social vulnerability.
A characteristic of the study is the detailed scale of anal-ysis for a large city. The paper builds on previous research (Armas,, 2006; Armas, and Avram, 2008; Armas,, 2008b;
Armas, et al., 2008) and integrates the results. The scale of
1484 I. Armas, and A. Gavris,: Social vulnerability assessment with SEVI and SoVI model
16 :
Data input
Elements at risk
Population Households Census data
Orthophoto with
census units Spatial constraints
Computed statistical indicators Index construction - PCA with varimax rotation and Keiser criterion
Social sub-index Economic sub-index
Factor 4 Housing qualitysub-index
Aggregation procedures
Spatial decision rules to assess weights No factor
weighting
SoVI SEVI
Local indicators of spatial association (LISA)
Analysis
Decision for factor inclusion
Mapping of the two
indices
Spatial data
Fig. 1.General framework for building the social vulnerability indices
Fig. 1. General framework for building the social vulnerability indices.
(Fekete, 2009) and the social attribute in particular (Gall, 2007). The general issues concerning the scales of analy-sis for vulnerability (Cutter et al., 1996; Turner et al., 2003; Fekete et al., 2010) and related indicators were discussed in detail in studies regarding river floods in Germany (Fekete, 2009; Fekete et al., 2010; Fekete, 2010) and alpine hazards (Papathoma-Köhle et al., 2011). For urban space in which the census tracts is the aggregation area, other studies revealed the relevance of the unit selection (Schmidtlein et al., 2008). The set area for assessment is Bucharest due to its high vulnerability to earthquakes and the profound socio-economical changes that the city has undergone over the past two decades. Furthermore, our research tries to fill a gap, given the absence of recent studies on social elements at risk – specific for this location – as well as the need for improve-ment of social vulnerability analysis of Bucharest. Finally, we analyse the clustering results of the two social vulnera-bility indices. The results offer a good image of possible vul-nerability hot spots that are likely to remain the same over time.
4 Study area
Generally speaking, an element at risk is vulnerable, as it is exposed and more susceptible to impact, according to the “first law of geography” that states “near things are more re-lated . . . ” (Tobler, 1970, p. 236). The tendency to test diverse methods and concepts of social vulnerability is mainly di-rected towards urban environments, which contain the high-est number of people at risk and the greathigh-est potential for material losses. In this study, specific natural stressors were measured against social vulnerability since strong earthquake occurrence is high (4 large overMw=7 in the past century
and 6 medium, over Mw=5 in the last decade), as other
types of risks have a lesser impact in Bucharest.
Bucharest is located in the Vl˘asia Plain, in the lower part of the Arges, River basin with an alluvial soil that covers deep
I. Armas, and A. Gavris,: Social vulnerability assessment with SEVI and SoVI model 1485
: 17
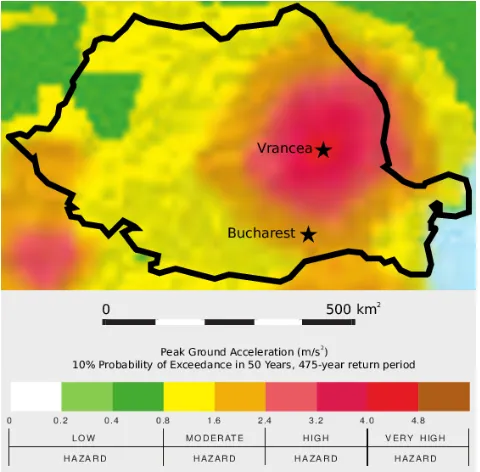
Fig. 2.Romania seismic hazard map, source: modified after Giardini et al. (1999)Fig. 2. Romania seismic hazard map, source: modified after
Giar-dini et al. (1999).
The key features of Vrancea earthquakes, in terms of urban risk studies, is the prevalence of a long period of radiation (1–2 s) for strong shocks and the depth of the epicenter (90– 150 km) that produces large earthquakes with damaging ef-fects on buildings 8–12 floors high (Mândrescu and Radu-lian, 1999; Radulian et al., 2006; Mândrescu et al., 2007; Zaharia et al., 2008). The high-magnitude seismic events of 1940 (Mw=7.7) and of 1977 (Mw=7.5) caused
tremen-dous damage to many buildings (M˘armureanu et al., 2011). In the case of the 1977 event, the rough estimation of dam-age equaled $1.45 billions (WB, 1978), 70 % of which in Bucharest. The fatalities exceeded 1400 people, over 7500 were injured and some 35 000 families remained homeless (BSSA, 1978).
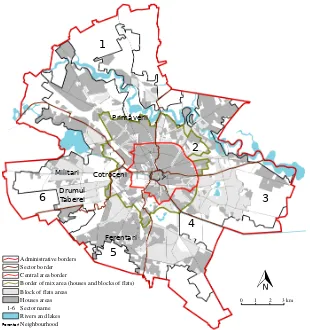
The city records almost 2 million inhabitants (2012 Ro-manian National Institute of Statistics data) and a heteroge-neous surface from a functional and architectural point of view (Fig. 3). The structure of the city follows a concentric pattern: old buildings dominate the central part surrounded by a mix of pavilion residential buildings and blocks of flats. Large urban estates with blocks of flats of 5 and 10 floors, built mainly in the communist period, represent the largest part of the city. In between the blocks of flats rural areas re-main visible, despite their inclusion into the city during the communist regime. The 1977 earthquake was an important moment after which the city planners started to remodel the city. After the earthquake, there began a process of demolish-ing old builddemolish-ings and planndemolish-ing new areas. The central area of the city was heavily transformed, followed by areas where seismic security measures represented a priority, especially
along the main thoroughfares. Despite the massive interven-tion, many buildings with structural problems remained due to their historical importance or their location, at the back of new blocks of flats2.
4.1 The communist Bucharest
After the Second World War, the communist projects fo-cussed on developing industry attracted large numbers of people, mainly from the rural parts of the country. They received a good status as working class, meaning a free dwelling and a work place in the industry sector. The new way of living was more than expected, so people largely supported the regime, without much care for other life as-pects. The required residences for the newly arrived inhabi-tants forced a fast development of buildings, mainly blocks of flats, with little concern about the earthquake risk. This situa-tion amplified in the 1960s, when the city adopted the soviet model of urban planning and concentrated on efficiency and profitability. The Romanian model of architectural planning, imposed next, favoured geometry and aestheticism over so-cial aspects. In the 1970s, the city planning policies involved new measures aimed to increase the urban density as a way of better space management. Blocks of flats over 5 levels were the main focus of planners and the apartments built became smaller. The inhabited surface of dwellings, in general low (under 30 m2), faced some complication with the increase of family members as a consequence of the powerful pro-natalist policies. Initially these characteristics changed after the 1977 disaster, but because of the large investment re-quired for foreign technologies and materials, the quality of the new buildings improved slightly. The authorities consid-ered Romanian technologies good and thought they should be used instead. The finalization of the large projects and the start of the new ones (redevelopment of the city centre) removed any further major investment from the social utili-ties or building rehabilitation. At the end of 1980s, Bucharest recorded a housing crisis, with people having to wait to re-ceive an apartment and with people forbidden to move into the city if they did not possess a city ID card. This proves im-portant for the next period, when many people who worked in Bucharest, but lived outside the city “invaded” some of the unfinished buildings, starting to develop real ghetto areas.
4.2 The post-communist Bucharest
The communist planners wanted to uniform the entire city. After the 1989 revolution the city’s development froze, and only slight alterations were made to the city plan. In the new period, the population vulnerability is considered to origi-nate from the indifference of the population to earthquake risks, local tensions, poor living conditions in terms of the
2Planners and builders had tried to cover the rural image and the
1486 I. Armas, and A. Gavris,: Social vulnerability assessment with SEVI and SoVI model
external appearance of buildings and building management, poor management of the communal or public areas by the city’s administration, development of segregation once the barriers of communist doctrine became loose, and an in-crease in number of people that required social assistance (Armas,, 2006, 2008b; Mionel, 2011). The vulnerability
re-sulted as a combination of rapid changes and a slow adapta-tion of the populaadapta-tion to the socio-economic transformaadapta-tions, population used to respond to a centralized system of coordi-nation and leadership.
The communists’ housing estates continued to be highly homogeneous from a demographic point of view. This was especially true for the neighbourhoods with big blocks of flats. But in the central part of the city and in the rural-like neighbourhoods, the influence was not powerful enough to change the demographic distribution of the population. In these old areas, demographic ageing developed because peo-ple were coming to the end of their working service or were already pensioned. The purchasing power of elderly peo-ple was low and the indifference to the new transformations (from communism to capitalism) determined an increase of social vulnerability.
Regarding the economic issues of the first 13 yr since the revolution, Bucharest recorded a transitional phase, marked by a form of liberalisation with populist accents, that led to closure and restructuring of numerous industrial areas and factories. At the time of the 2002 census, there were 35 in-dustrial estates, employing 360 000 inhabitants, which rep-resented over 40 % of the total active working population of the city. Once representative for the economy of the city and the country, Bucharest’s industry remained highly subsidized and sustained politically, increasing the social vulnerability. At that time, workers received 20–30 times the equivalent of their wages as redundancy compensations if they left the factory. The majority of people invested their money mainly for internal repairs to the dwellings that they bought from the state after the collapse of communism. According to Ro-manian housing legislation, all the tenants have a share of the freehold and therefore are all responsible for major re-pairs and together own the land on which the block was built. No major repairs continued after 1989, because the tenants could not afford major repairs. Besides, the surrounding ar-eas around the blocks of flats became neglected, a clear sign that they were not managed properly by the new owners of these blocks.
The high number of housing estates in the former indus-trial zones represents another facet of vulnerability at the economic level. A strong earthquake may affect such zones where population density is high and where it has already in-vested massively3. Only recently, a law (260/2008) to protect dwellings against the hazards was issued. The risk is even
3Romanians consider it essential to own a house or apartment as
opposed to renting it. That is why, after 1990, people directed most of their financial assets to the real estate sector.
higher in an unregulated capitalist city, where “liberal leg-islation” favoured the construction of housing estates, with disregard to the strict building regulations in a city prone to intense earthquakes.
After the end of the communist period, the city’s housing market experienced a fast-paced liberalization. The state al-lowed the residents and tenants to buy apartments and houses they previously rented from the state. It determined a high private ownership (over 90 % of housing stock). Moreover, some of the housing estates under construction or which were in an advanced state of degradation were illegally occupied, being later bought or leading to ownership litigation. These housing units were occupied by large families on low in-comes and of rural origin trying to take advantage of the opportunities of the city. The situation worsened as in these buildings or normal blocks of flats built before the earthquake the planned consolidation stopped. It is normal to see cracks in the buildings all over the city, but especially if one enters such buildings. After 2000, some parts of the population be-gan to restructure the interior of their own dwellings to make larger rooms, but without any official approval or construc-tion knowledge.
5 Methodology
Selecting the evaluation of the two indices of social vulnera-bility involves analysis of different methodologies and their connection to a common point. This may be a denomina-tor of vulnerability (Stânga and Grozavu, 2012) or a dif-ferent methodology that provides insight over the results. The methodological steps involve data presentation, indica-tor construction and index design. Finally, the analytical part reveals the direction followed to assess the two multi-criteria methods.
5.1 Data
The study relies on the 2002 census data at tract level. The census tracts are the smallest units in Bucharest for which the INS (National Institute for Statistics) offers (scarce) informa-tion on social and economic variables. Data included are in-ventories of population characteristics, base economic data, and data on housing conditions. The Urban and Metropolitan Planning Centre of Bucharest (CPUMB) offered information about the spatial limits of the residential areas. We investi-gated 154 census units covering the entire administrative area of Bucharest, representing 228 km2; the built up areas repre-sented slightly over 70 %.
I. Armas, and A. Gavris,: Social vulnerability assessment with SEVI and SoVI model 1487
18 :
Administrative borders Sector border Central area border
Border of mix area (houses and blocks of flats) Block of flats areas
Houses areas Sector name Rivers and lakes Neighbourhood 1-6
1
2
3
4 6
Ferentari
Cotroceni
Drumul Taberei
Primăverii
Ferentari Militari
0 1 2 3 km 5
Fig. 3.Urban structure of Bucharest, source: modified after Suditu (2007, 131) Fig. 3. Urban structure of Bucharest, source: modified after Suditu (2007, p. 131).
parts of Bucharest through studies executed during 1997– 2009 (Armas,, 2006, 2008a,b; Armas,and Avram, 2008). The
drawback of such micro-scale research is the large amount of redundant data. To maintain the correlation with previous data and with the main aspect of analysis – social vulnerabil-ity – we considered not using the buildings’ physical charac-teristics.
Since we intend to continue assessing social vulnerability in Bucharest, and compare it with regional results, we have endorsed a set of accessible data, made up of indicators and variables, as provided, that are easy to compute, while keep-ing track of the reference results in the literature.
5.2 Indicators
While many methodologies of assessing vulnerability exist at different scales and systems, the paper follows an indicator-based approach. The literature of vulnerability contains an array of indicators and characteristics, but how these are un-derstood is conditioned by the complexity of the problems involved in measuring vulnerability. In this context, an indi-cator can measure the variable of interest either directly, or it will measure another variable that serves as a substitute of the variable of interest (Babbie, 2007). To achieve the goal of this
research, the indicators developed here relate strictly to the social component (measured by a series of socio-economic features) (Cutter et al., 2000).
Social vulnerability indicators consider a core set of vul-nerability dimensions, as past research provides: age, gender, income, unemployment, dependence on social services, resi-dential property (renters, housing conditions), infrastructure (medical services, emergency management institutions), oc-cupation, social networks, education, urban-rural dichotomy, population growth, built environment, health status, etc. (Twigg, 2001; Downing and Patwardhan, 2004; Blaikie et al., 2005). The availability of indicators determined and/or re-stricted the dimensionality of indices. The selection of in-dicators for an index is still a product of subjective choice, relying on the aim of the study, the theoretical frameworks, availability and accuracy of social vulnerability data and sta-tistical results (Diener and Suh, 1997; Niemeijer, 2002).
1488 I. Armas, and A. Gavris,: Social vulnerability assessment with SEVI and SoVI model
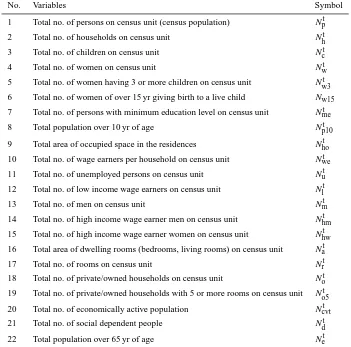
Table 1. Statistical variables.
No. Variables Symbol
1 Total no. of persons on census unit (census population) Npt
2 Total no. of households on census unit Nht
3 Total no. of children on census unit Nct
4 Total no. of women on census unit Nwt
5 Total no. of women having 3 or more children on census unit Nw3t
6 Total no. of women of over 15 yr giving birth to a live child Nw15
7 Total no. of persons with minimum education level on census unit Nmet
8 Total population over 10 yr of age Np10t
9 Total area of occupied space in the residences Nhot
10 Total no. of wage earners per household on census unit Nwet
11 Total no. of unemployed persons on census unit Nut
12 Total no. of low income wage earners on census unit Nlt
13 Total no. of men on census unit Nmt
14 Total no. of high income wage earner men on census unit Nhmt
15 Total no. of high income wage earner women on census unit Nhwt
16 Total area of dwelling rooms (bedrooms, living rooms) on census unit Nat
17 Total no. of rooms on census unit Nrt
18 Total no. of private/owned households on census unit Not
19 Total no. of private/owned households with 5 or more rooms on census unit No5t
20 Total no. of economically active population Ncvtt
21 Total no. of social dependent people Ndt
22 Total population over 65 yr of age Net
analysis of the local conditions concerning vulnerability against earthquake and the perception of population (Armas,,
2006, 2008a,b). Twenty-two statistical variables were se-lected (Table 1) to compute complex indicators and indices.
The importance of scale was assessed in relation to pre-vious studies on Bucharest. Considering its location in the Dâmbovi¸ta River’s meadow and the age of the buildings, the central part of the city was especially analysed, being the most exposed area to seismic risk and recording a high social vulnerability profile (Armas,, 2008b). Previously
men-tioned studies on Bucharest showed that vulnerability indica-tors were correspondent at the household and neighbourhood level. In this study we analysed the vulnerability dimensions at the former two levels, but also at census level to check the scale variation and to offer a representative outlook. The obtained results yielded good support to introduce the same indicators into the present research.
Other indicators that proved relevant in other studies were unavailable for Bucharest. Limitations in getting the data are not the main reason for the current index construction, but rather the evolution of the Romanian society as recorded in Bucharest. During the communist period, the process of
I. Armas, and A. Gavris,: Social vulnerability assessment with SEVI and SoVI model 1489
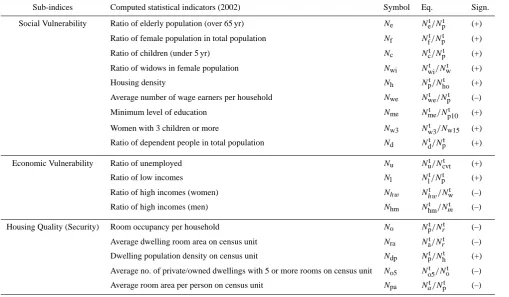
Table 2. Indicators used to assess social vulnerability in Bucharest.
Sub-indices Computed statistical indicators (2002) Symbol Eq. Sign.
Social Vulnerability Ratio of elderly population (over 65 yr) Ne Net/Npt (+)
Ratio of female population in total population Nf Nt
f/Npt (+)
Ratio of children (under 5 yr) Nc Nct/Npt (+)
Ratio of widows in female population Nwi Nwit /Nwt (+)
Housing density Nh Npt/Nhot (+)
Average number of wage earners per household Nwe Nwet /Npt (–)
Minimum level of education Nme Nmet /Np10t (+)
Women with 3 children or more Nw3 Nw3t /Nw15 (+)
Ratio of dependent people in total population Nd Ndt/Npt (+)
Economic Vulnerability Ratio of unemployed Nu Nut/Ncvtt (+)
Ratio of low incomes Nl Nlt/Npt (+)
Ratio of high incomes (women) Nhw Nhwt /Nwt (–)
Ratio of high incomes (men) Nhm Nhmt /Nmt (–)
Housing Quality (Security) Room occupancy per household No Npt/Nrt (–)
Average dwelling room area on census unit Nra Nat/Nrt (–)
Dwelling population density on census unit Ndp Npt/Nht (+)
Average no. of private/owned dwellings with 5 or more rooms on census unit No5 No5t /Not (–)
Average room area per person on census unit Npa Nat/Npt (–)
The sign indicates whether the variable may be an indicator of increased or decreased social vulnerability (+ =increases vulnerability,− =decreases vulnerability).
the vulnerability research (Twigg, 2001; Cutter et al., 2003; Blaikie et al., 2005), as well as on the perception of personal vulnerability in earthquakes, studies performed in Bucharest between 1997 and 2009, on samples of 500 to 1300 respon-dents (Armas,, 2006, 2008a,b).
5.3 Index design: SoVI versus SEVI Model
Certain benefits sustain the agreement on the use of indices: they are created for a better understanding of the society and its relations, by condensing this complex system into simple terms through numerical data (Diener and Suh, 1997). Ac-cording to some definitions, indices are “measure(s) of an abstract theoretical construct in which two or more indica-tors of the construct are combined to form a single summary score” (Carmines and Wood, 2004, p. 485). The absence of a well-established framework, where the concepts and method-ology may be used at different levels of analysis, argues that subjective judgement still plays a major role in index design (Diener and Suh, 1997).
First, in order to aggregate the indicators at indices level, they have to undergo a series of standardization techniques. Among widely accepted standardization techniques we note the use of min-max standardization, linear scale trans-formation, value/utility functions, probabilities, distance to
reference, fuzzy approach, andzscore transformations (Mal-czewski, 1999; Zeng and Zhou, 2001; Gall, 2007). Indices may also differ in point of the number of aggregation levels. A further requirement is to include weights, because dif-ferent indicators and sub-indices usually have difdif-ferent levels of importance. Indices also differ in the weighting of indica-tors (Voogd, 1983). In some cases, even using the same con-cept and methodology, differences may appear (Holand et al., 2011) and a need for adapting the indices has to be consid-ered (Holand and Lujala, 2013). For example, an analysis of 7 different indices linked to social vulnerability, (Gall, 2007) found no coherent construction at any level but rather gaps in empirical validity and methodological robustness. Never-theless, once shortcomings are known, the strategy should involve a common framework, where scientific results are combined with communities’ involvement to apply and rec-tify the analytical framework (Gall, 2007).
1490 I. Armas, and A. Gavris,: Social vulnerability assessment with SEVI and SoVI model
:
19
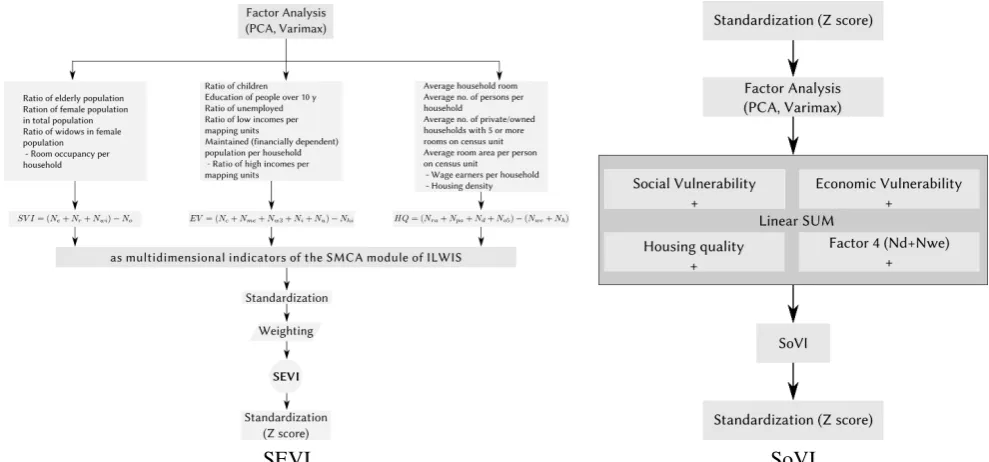
SEVI
SoVI
Fig. 4.
Fig. 4. Index design.Index design
and a general taxonomy widely used to select, classify and assess indicators and indices can be read in Booysen (2002), Birkmann (2006a), Jean-Baptiste et al. (2011).
In our research we examined two multi-criteria methods of aggregating complex indicators: the social vulnerability index (SoVI model) and the spatial multi-criteria social vul-nerability index (SEVI model). The working SoVI algorithm used in the study adheres to the initial version introduced by (Cutter et al., 2003), leaving aside subsequent amendments brought by PCA. That is why we attempted to keep the ten-dency confirmed by other studies that used the index, while the construction changes of the algorithm were sensitive and insufficiently put to the test (Schmidtlein et al., 2008).
The study used the following methodological steps of the SEVI multi-criteria technique (Fig. 4), based on a GIS-supported raster dataset: breaking down the complex prob-lem into sub-indices; selection of the significant indicators; standardization of indicators to a range of 0–1; compar-ing indicators and sub-indices pair-wise uscompar-ing a hierarchical structure termed “criteria tree” and expressing preference for each pair, calculating a composite index map (Vargas, 1990; Howard, 1991; Keeney, 1992; Yusuff et al., 2001; Keefer et al., 2004; Chen et al., 2008). The use of weights facilitated the combination of indicators and indices into composite in-dex maps, where the performance indices use the formula
pi= h Y
l=1
wli,
in which i is the indices or sub-indices (standardized value), andhrepresents the number of levels of the hierar-chical structure and refers to the weight of indicesifor level l.
In the spatial implementation of this technique (Nijmeijer et al., 2001), every indicator and index represents a raster layer, and every pixel/set of pixels of the final composite in-dex map constitutes a different spatial result or alternative of the analysis (for a detailed review of the method see van Westen and Woldai, 2012).
The advantages of using the SMCE module of ILWIS are the maps generated for various working stages, useful in later processing. This characteristic relates to an indirect require-ment of the analytic hierarchy process, i.e. use of a smaller number of indicators to avoid inconsistencies in the weight-ing scheme (Voogd, 1983; Cardona, 2005).
5.4 Analytical steps
The structure of the algorithms follows, in the pre-processing stage, the same steps, namely the inductive, statistical ap-proach (relying on statistical relationships to infer leading factors).
I. Armas, and A. Gavris,: Social vulnerability assessment with SEVI and SoVI model 1491
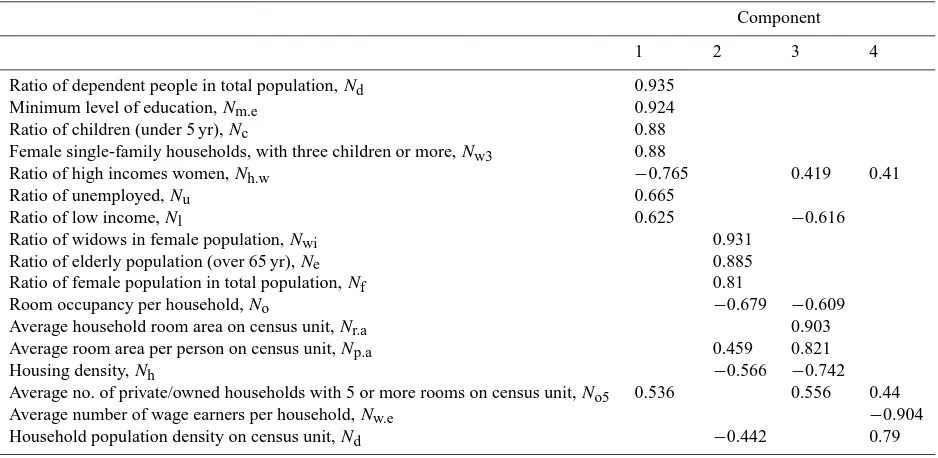
Table 3. Table after rotation.
Component
1 2 3 4
Ratio of dependent people in total population,Nd 0.935
Minimum level of education,Nm.e 0.924
Ratio of children (under 5 yr),Nc 0.88
Female single-family households, with three children or more,Nw3 0.88
Ratio of high incomes women,Nh.w −0.765 0.419 0.41
Ratio of unemployed,Nu 0.665
Ratio of low income,Nl 0.625 −0.616
Ratio of widows in female population,Nwi 0.931
Ratio of elderly population (over 65 yr),Ne 0.885
Ratio of female population in total population,Nf 0.81
Room occupancy per household,No −0.679 −0.609
Average household room area on census unit,Nr.a 0.903
Average room area per person on census unit,Np.a 0.459 0.821
Housing density,Nh −0.566 −0.742
Average no. of private/owned households with 5 or more rooms on census unit,No5 0.536 0.556 0.44
Average number of wage earners per household,Nw.e −0.904
Household population density on census unit,Nd −0.442 0.79
Rotated component matrix. Extraction Method: Principal Component Analysis. Rotation Method: Varimax with Kaiser Normalization.α. Rotation converged in 6 iterations,β. threshold for exclusion=low correlations (<0.3).
population, with many children, lived in the outskirts, in the working class districts.
These factors are significant by the degree of saturation in variables corresponding to the goal of the study, based on the Eigen>1 criteria. They account for over 88 % of the social vulnerability variation and will be further comprised in the design of complex SEVI and SoVI indices (Fig. 4).
The factorial reduction procedure indicated statistical sig-nificance and showed that data were suitable for factorial analysis: a Kaiser–Meyer–Olkin measure of sampling ade-quacy is medium high (>0.7), and the highly significant Bartlett’s test of sphericity (4510.312; Sig.=0.0001) sug-gests the strength of the correlation of the variables (Table 3). The next step was to gain a maximum variation of factors, functions of combined variables, by applying the Varimax rotation.
SoVI standardization usedZ score. The methodological difference was factor aggregation, made by linear summing for SoVI and by weighting for SEVI. We standardized the final results (Zscores), so that we could represent the indices in terms of standard deviation (Fig. 5).
In the spatial multi-criteria analysis of the SEVI index af-ter factorial reduction, the next step was to aggregate the scores of the indicators in which the selected factors were saturated, and introduced these as multidimensional indica-tors in the SMCE module of ILWIS software (Fig. 4). Ag-gregation was determined by the sign of correlation among the variables that saturated the three factors. The multidimen-sional indicators were standardized under the goal standard-ization procedure.
Built on the pair-wise comparison method, we weighted sub-indices in a complex social-economic vulnerability in-dex (SEVI) to obtain the final inin-dex score (Fig. 4 – SEVI). The pair-wise comparison approach is a non-compensatory strategic approach of attributing importance (ordinal) weights, as linear aggregation allows indicators to be compensated (Munda and Nardo, 2003; Nardo et al., 2005). This method showed to be most appropriate for use with MCE techniques (Carver, 1999).
Based on the qualitative expert-based method, which in-volves assigning weights according to expert’s opinion, we deemed that social and economic vulnerability had an equal contribution to raising the general level of vulnerability in the SEVI model, while we interpreted housing quality as an element of reduction of vulnerability. This option gained sup-port from the results of social surveys in Bucharest and other media information from Romania, which emphasized the im-portance of housing quality in attenuation/amplification of social vulnerability perception (Armas,, 2006, 2008b; Armas,
and Avram, 2008).
The construction of this index used the statistical data available for that time, and this imposed some constraints over the results. The factorial reduction procedure and the experience of interviews for various types of natural disas-ters emphasizes that the spatiality and the type of home own-ership are important elements of interior comfort and secu-rity, even in situations when the building lacks seismic safety (Beck, 1992; Sunstein, 2002).
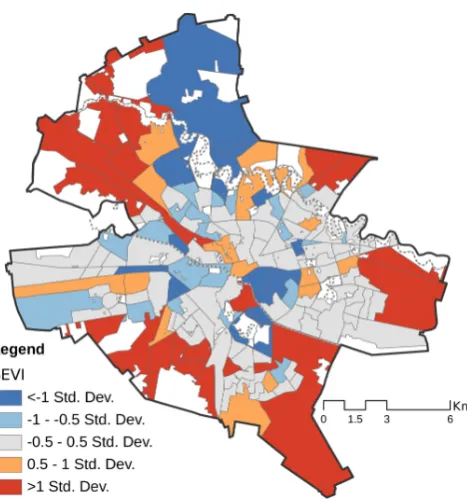
1492 I. Armas, and A. Gavris,: Social vulnerability assessment with SEVI and SoVI model
Fig. 5. Indices with added spatial constraints (white color are parks,
barren areas, agriculture land).
over 5 rooms and are specific to old houses in downtown Bucharest, and have high seismic risk. In 2002, these cate-gories did not yet include the large number of new houses or apartments built since then.
Spatial constraints were added in order to indicate the built-up areas for each census unit (Boolean maps – true/false), but they were not considered during the weight-ing process. For more information about standardization and weighting methods using SMCE module of ILWIS software see Nijmeijer et al. (2001); Abella and Van Westen (2007); van Westen and Woldai (2012). Final results were standard-ized usingZscores and represented in terms of standard de-viation (Fig. 5).
To test geographic variability of results, we used Global Moran’s I and Local Moran’s I/LISA (local indicators of spa-tial association) statistics, implemented in the OpenGeoda software (Anselin et al., 2006).
The mere visualization of cartographic representation may often hide relevant aspects, accessible only through visual statistical techniques. There are plenty of scientific argu-ments in the literature that support the development of spatial autocorrelation techniques (Moran’s I, LISA), that allow for data exploration under the spatial analysis of social vulnera-bility clusters.
The methodology of exploratory spatial data analysis (ESDA) for spatial clustering consists of three stages:
– Data observation using maps and histograms that may
reveal the so-called “islands” (unconnected observa-tion). The solution for constructing the weighted matrix,
based on the exploration of data, was the selection of topological contiguity (kneighbourhood); it showed to be robust.
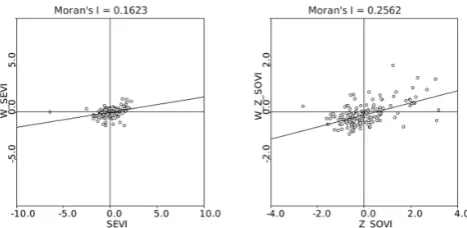
– Assessing the statistical significance through global
Moran’s I scatter plot, where the upper-right and lower-left sections/quadrants reveal that social vulnerability data are above, or respectively, below the mean. This stage displays the existence of spatial clusters as the census tracts with high vulnerability are adjacent to each other, and vice-versa. On the other two quadrants are the outliers that depict cases in which high vulnerability ar-eas may be close to the lower data, or the other way around.
– Testing the significance of LISA at different statistical
levels, to see their form of spatial association (same as in step two, only that now Moran’s I shows the location both in the scatter plot and the two resulting maps).
6 Results
6.1 Spatial distribution
In this study, empirical evidence (Gall, 2007) supported the validation of vulnerability indices (Fig. 5) and it confirmed the results of other surveys in Bucharest (Armas,, 2006,
2008a,b; Armas, et al., 2008).
The spatial analysis (Fig. 5) revealed the prevalence of tracts with low scores of vulnerability. The social vulnera-bility of the city exists in the centre, with some exceptions, and spreads towards the outskirts. An important aspect is the similarity of the results obtained from the two maps.
I. Armas, and A. Gavris,: Social vulnerability assessment with SEVI and SoVI model 1493
environment. This failure to adapt should be understood as the result of a culture shock between the rural and archaic lifestyle and the socialist working class culture. The newly declared urban population (over 50 % of the Bucharest pop-ulation was born outside the city, until 2002) preserved the living conditions of rural life, despite living in a city or in a block of flats. While it may sound odd, some of the inhabi-tants of these areas preferred to improvise dwellings for their animals (pigs, hens and others) and themselves from poor materials and with no authorization for construction. Even now, peripheral areas retain some of the rural characteristics. The population is socially dependent, the families living on low incomes are numerous, and education is a problem both from the point of view of the number of schools as well as their level/quality. This description expresses that the most powerful factors involved in influencing social vulnerability in Bucharest are the economic level, education, and the polit-ical measures before and after the change of the communist regime in 1990. Since political measures could not be quan-tified in the study, the other factors are the measure of the impact.
In the category labelled as the least vulnerable (values un-der −1 SD) attention aims towards the census unit, which includes the former area of concentration of the political and economic elite before 1990. The Prim˘averii area is located in the central-northern part of the city, sector 1. In the case of SEVI mapping, it is accompanied by a similar area from the central-western part, called Cotroceni. The image of re-duced social vulnerability varies to different degrees at the two indices. In the central part of the city, in sector 3, SEVI indicates low vulnerability, while SoVI renders to the mean. In many cases, the population in these areas comprises peo-ple employed in the private sector who earn above-average wages, are well trained and have high education levels. But they are outlined only in the zones Prim˘averii and Cotroceni and thus low social vulnerability assessment remains the most difficult problem for Bucharest.
To confirm the vulnerable areas, and to better understand where the areas affected by social vulnerability are, as well as to discover the eventual spatial associations of cluster type, we performed an exploratory spatial data analysis.
6.2 Spatial patterns
The use of local indicators of spatial associations was further conducted to improve the decisions pending the assessment of the social vulnerability in Bucharest. Our goal was to find in what parts of the city the outliers of the social vulnerability indices are highly associated and what their spatial configu-ration is.
We paid attention to the identification of spatial patterns and to their degree of similarity. For this purpose, we ex-plored the scatterplot of global Moran’s I (ISoVI=0.2562,
ISEVI=0.1623): it showed that there is a spatial pattern of
social vulnerability in Bucharest for both cases (Fig. 6). To
: 21
Fig. 6.Fig. 6. Moran’s I Scatterplot for Bucharest Social Vulnerability inMoran’s I Scatterplot for Bucharest Social Vulnerability in 2002
2002.
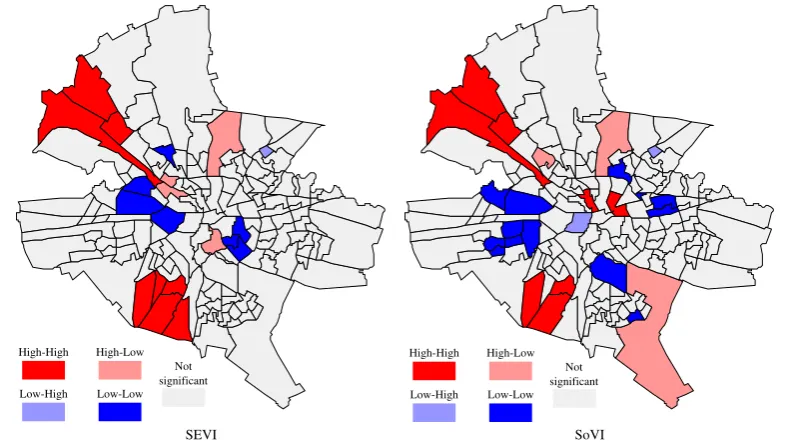
reveal the location of the indices clustering, we built local in-dicators of spatial association maps (LISA). Figure 7 records the social vulnerability in terms of LISA mapping, using a k neighbourhood matrix. Areas of strong or weak associa-tion are identified and classified by the four types of spatial association: areas in red show high vulnerability, the blue ar-eas represent low vulnerability, while the pink and light blue denote areas of vulnerability surrounded by the opposite type (high-low or low-high).
Our interest focused on the areas with high social vulner-ability and on whether there is a match among clusters re-sulting from the two methods applied. As expected, signif-icant spatial clustering areas, which overlap, were revealed (Fig. 7). They should be seen in a broader context of the map, because the spatial clusters colour representations of LISA indicates only the centre of the clusters. Mapping the two in-dices using LISA revealed a similarity among the clustering areas affected by high social vulnerability. The NW and SW areas in red are displayed in both variants. They were mainly influenced by the development of industry before the 1950s or during the early years of communism. These are areas with a high share of working class people, lacking many of the ba-sic social facilities, and are based on the empirical perception and knowledge of the city. In fact, the negative image that these areas radiate aggravates even further the population’s vulnerability.
Apart from these two obvious clusters, the local analysis of clustering indicates differences between the two indices. Thus, SoVI registers two additional areas in the central part of the map, where social vulnerability reached high values. They stem from the social evolution of the areas until 2000, when the central part of the city saw unequal initiatives of economic development that gradually gained local signifi-cance. Against this background, the presence of an elderly population, as well as elements such as lack of initiative, low wages or large number of persons in care, led to the forma-tion of these clusters.
1494 I. Armas, and A. Gavris,: Social vulnerability assessment with SEVI and SoVI model
22 :
High-High High-Low
Low-Low Low-High
Not significant
High-High High-Low
Low-Low Low-High
Not significant
SEVI SoVI
Fig. 7.LISA clusters maps
Fig. 7. LISA clusters maps.
low degree of exposure (low-low or cold spots). Although in the central-west part, pertaining to the south area of Militari district where the two indices display a similar range, differ-ences remain significant. The map of the LISA analysis for SEVI shows the range of low social vulnerability advancing toward the Cotroceni district, while for SoVI, it stretches to-ward the west. Another significant range appears in the case of SoVI clustering, where low social vulnerability may be admitted. We have identified this area as Drumul Taberei, a popular district during communist times housing intellectual elites and people with high industrial technical backgrounds. Built between 1960s–1980s, this district appealed to many young people, with no statistically relevant social sensitivity. Other areas with low social vulnerability appear differently: SEVI pointed to an area in the central part of the capital, in sector 3, and SoVI highlighted a higher number of such areas stretching between the mixed area and the area of large hous-ing units. We may add that, in both situations, these areas are located along main roads. Generally available in such loca-tions, the social-economic facilities became attractive for the active, mobile population of Bucharest, young and adult, ea-ger to use the facilities. The areas indicating outliers are dis-parate and are better highlighted by SEVI in terms of gath-ering. Since their distribution in ranges is so varied and re-duced, one needs to further undertake a more detailed inves-tigation. Our hypothesis on dissimilarity is that there may be other factors than the ones introduced in our analysis, which are likely to have a stronger influence on social vulnerability here. Also, considering the census of 2012, a new analysis may clarify the changes that only showed up in those areas.
7 Discussion
The identification of vulnerability and the understanding of related methodologies helps the development of policies and action plans for mitigation. Assessment of social vulnerabil-ity indices in relation to earthquake risk does this and adds to research from the natural hazards studies. In this paper, we applied a new proposed index – SEVI compared against a more common one, SoVI – and explored their spatial dis-tribution. The assessment procedure of social vulnerability showed to be reliable and may determine the use of the re-sults to enhance urban policy, introducing a scientifically ar-gued solution, as a possible key-element for Romanian urban public policy.
The study indicated advantages and disadvantages of the indices in a social vulnerability context. The two indices overlapped the limitation of the available data that had an effect on the selection of indicators and their degree of repre-sentation. The uncertainty triggered by the standardization methods used, weighting and aggregation responded posi-tively to the approach involved in the study (as all elements need to be classified, standardized/normalized and included into a category and a calculation algorithm, which can lead to misleading results). Factor analysis pointed towards the in-fluence that susceptible population categories have on social vulnerability. These categories of population were on an up-ward trend at that time. Most results were confirmed by the disparate studies performed on certain aspects of vulnerabil-ity (Armas,, 2006, 2008b; Mionel, 2011).
I. Armas, and A. Gavris,: Social vulnerability assessment with SEVI and SoVI model 1495
may lead authorities to prevent or diminish the catastrophic effects of earthquakes like those of 1940 and 1977. The appli-cation of ESDA over the two indices resulted in understand-ing the difference that may appear when a simple aggregation is conducted against a weighted one. While the maps reveal differences, both indices displayed on the maps exposed the vulnerability areas in a clear manner. Moreover, the consis-tency of analysis looks good, but a statistical testing through additional methods would improve it.
Although the proposed methods do not capture the con-catenation of factors as highlighted by Wisner and Luce (1993), the main advantage observed in the paper was that the indices are relatively easy to apply, which could be a so-lution for different stakeholders keen to reduce social vul-nerability in the city. Thus, social vulvul-nerability assessment fits into the general approach of informing decision making (Schröter et al., 2005; Metzger and Schröter, 2006) and sets up a bridge among academic research, policy and practice (Steinführer et al., 2009; Gaillard, 2010).
The method for SoVI suggests that is easy to apply, re-gardless of scale (Schmidtlein, 2008) and, in most cases, uses variables, which are comparable to and well-sustained in the literature of the past decade. Still, the method needs not a simplistic approach, but thorough scientific expertise throughout its implementation, especially regarding the sign of aggregation of the PCA factors. There is a disadvantage in that the additive model inherently eliminates the separate rel-evance of factors. Thus, one cannot safely assess the impact of each factor within the general outcome, since it is only a statistical image.
Another disadvantage of SoVI is that it does not allow test-ing against an independent variable (Schmidtlein, 2008). As for other indices, in temporal analyses, SoVI bears compar-ison only to itself. These temporal analyses are not suitable for Bucharest, since census units have changed from one cen-sus to another and data becomes available only after a long period of time.
The spatial multi-criteria evaluation (SMCE) is a semi-quantitative method, based on expert opinion. The uncer-tainty surrounding the validity of chosen weighting schemes is a major issue of the SMCE that makes the results diffi-cult to compare or generalize from. The positive part is the accessibility of the method and the smoothness of interpreta-tion of results by decision-makers. One addiinterpreta-tional advantage arises from structuring a complex problem into sub-levels or sub-goals.
The study emphasizes that social vulnerability is an ur-ban process that is continually expanding in Bucharest, with a tendency towards extending clusters. The image of social vulnerability looks to be too good for the year and the con-ditions of Bucharest during the time of the 2002 census. At that time, the transformation of economy and society from communism to capitalism was at its peak and the urban pop-ulation has become increasingly polarized. Some limitations arise from this as the two methods could not perceive and
measure the influence of political factors to the vulnerability dynamics in the complex political situation of Bucharest af-ter 1990. Nevertheless, further insight will develop once the 2012 census data is available and the assessment changes are analysed.
8 Conclusions
Although there is a statistically significant, but low, positive correlations between the two indices (r=0.33; Sig=0.001), the pair-sampleT test (t=3.2; Sig 2–tailed=0.001) indi-cates that the results after applying SoVI and SEVI are not similar. Therefore, the two methodologies cannot be used interchangeably. The option for one method or another de-pends on the scope of the study and the degree to which the researcher knows the issues of the study. SEVI method-ology suggests more freedom of intervention on procedural steps and because of this is more responsive regarding expert-opinion accuracy.
Furthermore, the procedure offers the possibility to high-light on purpose certain aspects that the researcher considers important or facilitates the segmentation of methodological flow at certain levels or sub-goals that can be analysed sepa-rately.
The diagnosis indicated by the image of social vulnerabil-ity clusters and the comparison of the two indices may offer a viable and integrative practical guide to authorities and pol-icy makers. This could enhance measures to diminish the so-cial vulnerability. It further suggests exploring the validation approach and the development in relation to different strate-gies involving assessment of social vulnerability. To interna-tional research it adds to the continuous interest of vulnera-bility metric development, enhancing the relevant literature. Scientifically, the paper covers a less explored area and as-sesses two convergent methods that prove practical value.
Acknowledgements. This work is partly funded by the EC projects
PNII31007/2007 and PCE285/2011, I. Armas,. The authors would like to thank the reviewers for commenting the text and for theirs valuable suggestions made on this paper. Special thanks to Adele Youmans and all the people who provided insight on the paper at the IGC 2012.
Edited by: A. Steinführer
Reviewed by: V. Martins and two anonymous referees
References
Abella, E. and Van Westen, C.: Generation of a landslide risk index map for Cuba using spatial multi-criteria evaluation, Landslides, 4, 311–325, 2007.
1496 I. Armas, and A. Gavris,: Social vulnerability assessment with SEVI and SoVI model
Adger, N., Arnell, N., and Tompkins, E.: Successful adaptation to climate change across scales, Global Environ. Chang., 15, 77–86, 2005.
Anderson, M. and Woodrow, P.: Rising from the ashes: development strategies in times of disaster, Westview Press, Boulder, 1989. Anselin, L., Syabri, I., and Kho, Y.: GeoDa: An introduction to
spa-tial data analysis, Geogr. Anal., 38, 5–22, 2006.
Armas,, I.: Earthquake risk perception in Bucharest, Romania, Risk Anal., 26, 1223–1234, 2006.
Armas,, I.: Percep¸tia riscurilor naturale: cutremure, inunda¸tii, alune˘ari, Editura Universit˘a¸tii din Bucures,ti, Bucures,ti, 2008a. Armas,, I.: Social vulnerability and seismic risk perception,
Case study: the historic center of the Bucharest Municipal-ity/Romania, Nat. Hazards, 47, 397–410, 2008b.
Armas,, I. and Avram, E.: Patterns and trends in the perception of seismic risk, Case study: Bucharest Municipality/Romania, Nat. Hazards, 44, 147–161, 2008.
Armas,, I., Dumitras,cu, S., and Bos,tenaru, M.: Lucr˘arile celei dea patra Conferin¸te na¸tionale de inginerie seismic˘a, chap. Analiza multicriterial˘a de vulnerabilitate urban˘a la risc seismic, cu ac-cent asupra fondului arhitectural: Municipiul Bucures,ti, Editura Conspress, Bucures,ti, 2008.
Babbie, E.: The practice of social research, Wadsworth Pub Co, Bel-mont, 2007.
Beck, U.: Risk society: Towards a new modernity, vol. 17, Sage Publications Limited, 1992.
Birkmann, J.: Indicators and criteria for measuring vulnerability: Theoretical bases and requirements, in: Measuring vulnerability to natural hazards: Towards disaster resilient societies, edited by: Birkmann, J., United Nations University, New York, Tokyo, 55– 77, 2006a.
Birkmann, J. (Ed.): Measuring vulnerability to promote disaster-resilient societies: Conceptual frameworks and definitions, United Nations University Press, Tokyo, 2006b.
Birkmann, J. and Wisner, B.: Measuring the un-measurable, The challenge of vulnerability, SOURCE, 5/2006, available at: http: //www.ehs.unu.edu/file/get/3962 (last access: 27 April 2013), 2006.
Blaikie, P.: At risk: natural hazards, people’s vulnerability, and dis-asters, Routledge, London, 1994.
Blaikie, P., Cannon, T., Davis, I. ., and Wisner, B.: At risk: natural hazards, people’s vulnerability and disasters, Routledge, London, 2nd Edn., 2004.
Blaikie, P., Mainka, S., and McNeely, J.: The Indian Ocean tsunami: reducing risk and vulnerability to future natural disas-ters and loss of ecosystems services, Information paper, Inter-national Union for Conservation of Nature Information, Gland, Switzerland, available at: http://data.iucn.org/dbtw-wpd/edocs/ Rep-2005-006.pdf, 2005.
Bohle, H.: Vulnerability and criticality: perspectives from social ge-ography, IHDP update, 2, 3–5, 2001.
Bohle, H., Downing, T., and Watts, M.: Climate change and social vulnerability: Toward a sociology and geography of food insecu-rity, Global Environ. Chang., 4, 37–48, 1994.
Booysen, F.: An overview and evaluation of composite indices of development, Soc. Indic. Res., 59, 115–151, 2002.
Borden, K., Schmidtlein, M., Emrich, C., Piegorsch, W., and Cutter, S.: Vulnerability of US cities to environmental hazards, J. Homel. Secur. Emerg., 4, 1–21, 2007.
Boruff, B. and Cutter, S.: The environmental vulnerability of Caribbean island nations, Geogr. Rev., 97, 24–45, 2007. Boruff, B., Emrich, C., and Cutter, S.: Erosion hazard vulnerability
of US coastal counties, J. Coastal. Res., 21, 932–942, 2005. BSSA: Seismological Notes–July-August, B. Seismol. Soc. Am.,
68, 1781–1783, 1978.
Burton, I. and White, G.: The environment as hazard, The Guilford Press, 1993.
Burton, I., Kates, R., and White, G.: The environment as hazard, Oxford University Press, Oxford, 1978.
Cardona, O.: Indicators of Disaster Risk and Risk Management – main technical report, Report, IDB/IDEA Program of Indicators for Disaster Risk Management, National University of Columbia, Manizales, 2005.
Carmines, E. G. and Wood, J.: Index, in: The Sage encyclope-dia of social science research methods, edited by: Lewis-Beck, M., Bryman, A., and Liao, T., Sage Publications, Inc, Thousand Oaks, vol. 1, 485–486, 2004.
Carver, S.: Developing web-based GIS/MCE: improving access to data and spatial decision support tools, in: Multicriteria decision-making and analysis: A geographic information sciences ap-proach, edited by Thill, J.-C., pp. 49–76, Ashgate, New York, 1999.
Chakraborty, J., Tobin, G., and Montz, B.: Population evacuation: assessing spatial variability in geophysical risk and social vul-nerability to natural hazards, Nat. Hazards Rev., 6, 23–33, 2005. Chen, M., Tzeng, G., and Ding, C.: Combining fuzzy AHP with MDS in identifying the preference similarity of alternatives, Appl. Soft. Comput., 8, 110–117, 2008.
Cutter, S.: Vulnerability to environmental hazards, Prog. Hum. Geog., 20, 529–539, 1996.
Cutter, S. and Emrich, C.: Moral hazard, social catastrophe: The changing face of vulnerability along the hurricane coasts, Ann. Am. Acad. Polit. SS, 604, 102–112, 2006.
Cutter, S. and Finch, C.: Temporal and spatial changes in social vulnerability to natural hazards, P. Natl. Acad. Sci. USA, 105, 2301–2306, 2008.
Cutter, S., Holm, D., and Clark, L.: The role of geographic scale in monitoring environmental justice, Risk. Anal., 16, 517–526, 1996.
Cutter, S., Mitchell, J., and Scott, M.: Revealing the vulnerability of people and places: A case study of Georgetown County, South Carolina, Ann. Assoc. Am. Geogr., 90, 713–737, 2000. Cutter, S., Boruff, B., and Shirley, W.: Social Vulnerability to
Envi-ronmental Hazards, Soc. Sci. Quart., 84, 242–261, 2003. Davidson, D. and Freudenburg, W.: Gender and environmental risk
concerns, Environ. Behav., 28, 302–339, 1996.
Dayton-Johnson, J.: Natural Disasters and Adaptive Capac-ity, OECD Development Centre Working Papers, 237, doi:10.1787/827805005406, 2004.
de Oliveira Mendes, J.: Social vulnerability indexes as planning tools: beyond the preparedness paradigm, J. Risk. Res., 12, 43– 58, 2009.
Diener, E. and Suh, E.: Measuring quality of life: Economic, social, and subjective indicators, Soc. Indi. Res., 40, 189–216, 1997. Dow, K.: Exploring differences in our common future(s): the