The Effect of Access to End of Chapter
Problem Solutions On
the Performance of Students in Principles of
Finance
David S. Rystrom, (Email: [email protected] ), Western Washington University
Abstract
The author taught two sections of Principles of Finance in two different years. The courses were identical, except that in the second section, in 2004, students had access to the solutions manual for the answers to the many assigned practice problems which constituted a large proportion of the exam material. The author found that student performance on quizzes and exams was poorer for the class that had access to the solutions manual.
Introduction
testing a
g
his short article stems from the author’s experience in teaching Principles of Finance in large lecture sections in the Spring of 2004 and the Spring of 2002. In each case, the course covered the same material, used the same textbook, used the same procedure for nd grading, and had similar lectures, except for facts about current events (e.g., levels of interest rates, recent performance of the stock market, etc.). Since the classes were separated by two years, the quizzes and examinations were quite similar also (since the author felt it was unlikely that students would have access to exams from two years in the past).Principles of Finance is a difficult class for many students. Students with weak quantitative skills and those who do not retain much knowledge from the prerequisites in accounting and economics often struggle. The students were graded on their performance on four, in-class, closed book quizzes, and two in-class exams, one at the midterm and one final exam. The quizzes and exams usually included several numerical problems, similar to those that appeared at the end of each chapter of the text1. The class had no graded homework, but many end-of-chapter problems and some discussion questions were assigned as “practice problems”. Students were strongly encouraged to do the practice problems in a timely fashion, ideally soon after the lecture on the material and before the practice problems were reviewed in class. The problems and questions were always reviewed in class one or two class periods after they were assigned. In most cases, the instructor solved the problem on the board while discussing it, usually in some detail. For problems that were very similar to others, sometimes just the answer was provided.
answers to the practice problems by class attendance. If a student missed class, the student was expected to get the solutions from a classmate, or, as a last resort, from the instructor during office hours. In 2004, the solutions were made available to students on Blackboard in the afternoon following the discussion of the problems and remained available for the rest of the quarter. Solutions were available to questions and problems that had been assigned for practice by the instructor, as well as for those problems in the back of each chapter that were not assigned (typically the instructor would assign and then review anywhere from about half to three fourths of the available questions and problems at the end of each chapter.)
It was thought that the more readily available solutions for the 2004 class would enhance the performance of students in the class. Students could better concentrate on comprehension of the explanations instead of concentrating on copying the detailed solutions into their notes. If students made errors in writing the solutions into their notes, the access to the solutions manual would presumably show them the correct solutions. Students could also attempt additional, unassigned problems if they needed more practice and would have a convenient way to check their solutions.
Did the ready availability of solutions improve performance of students on the quizzes and exams? The next section provides some evidence on this question.
Data and Analysis
The end-of-chapter solutions on Blackboard proved to be quite popular. During the quarter 72 students, out of 76 enrolled, accessed at least one end-of-chapter solution set at least once. The total number of “student-days” of access (one student accessing the site on one day) was 653; the mean number of visits to the site over the quarter per student was 8.5 (Table 1). In addition, many students apparently accessed the solutions more than once on some days3.
Table1. Descriptive Statistics for Visits to Solutions Manual
Mean 8.59
Median 6
Mode 5
Standard Deviation 8.46
Minimum 0
Maximum 39
76 students n=653 each data point represents one student visit to solutions manual on one day
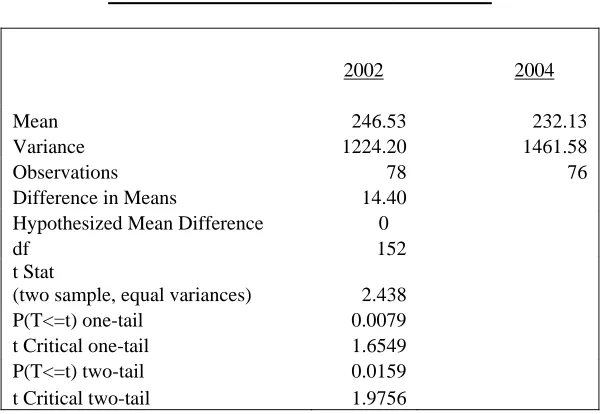
The 2002 class had a mean student score of 246.53. The 2004 class had a mean score of 232.13. These mean scores correspond to letter grades of C and C- respectively. The difference in means of a negative 14.40 points was found to be significant at the 95% confidence level using a t-test for the difference in means4. The null hypothesis is rejected by this test. It appears that the availability of the solutions resulted in significantly lower achievement by students in Principles of Finance.
Table 2a. Summary Statistics for Scores Achieved
2002 2004
Mean 246.53 232.13
Standard Deviation 34.99 38.23
Median 246 229
Minimum 154 128
Median 246 229
Maximum 330 311
n 78 76
Table 2b. t-test for Differences in Means
2002 2004
Mean 246.53 232.13
Variance 1224.20 1461.58
Observations 78 76
Difference in Means 14.40
Hypothesized Mean Difference 0
df 152 t Stat
(two sample, equal variances) 2.438
P(T<=t) one-tail 0.0079
t Critical one-tail 1.6549
P(T<=t) two-tail 0.0159
t Critical two-tail 1.9756
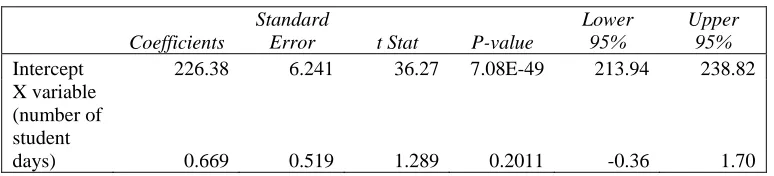
Table 3 shows the results of the linear regression. The dependent variable, Y, is the student’s score in total points. The independent variable, X, is the number of days that the student accessed the end-of-chapter solutions.
Table 3. Regression Analysis of Score Achieved Versus Visits to Solution Manual
Coefficients
Standard
Error t Stat P-value
Lower 95%
Upper 95%
Intercept 226.38 6.241 36.27 7.08E-49 213.94 238.82
X variable (number of student
days) 0.669 0.519 1.289 0.2011 -0.36 1.70
While the coefficient of the X variable is positive, indicating a positive relationship between use of the end-of-chapter solutions and score, the t statistic of 1.289 is not significant at the 95% confidence level. We cannot reject the null hypothesis of no relation between the use of the end-of-chapter solutions and students’ performances on quizzes and exams5
Table 4 compares the average score of students who never or seldom accessed the solutions to those who frequently accessed the solutions. Four students never accessed the solutions and three students accessed the solutions only once. The scores of those seven students were compared to the seven students who most frequently accessed the solutions. The average score of the seven non/seldom users was 219.86. The average score of the seven most frequent users was 259.71. The t statistic for the difference in these means was clearly significant, a t ratio of 2.77.
Table 4. Comparison of Scores of Low Use and High Use Students
Low Use Students High Use Students
Mean Score 219.86 259.71
Median Score 220 254
Standard
Deviation 21.95 31.06
Minimum 193 224
Maximum 256 311
t Stat for differences in
means 2.77
P(T<=t) one-tail 0.0091
n 7 7
This procedure was also used by sorting the data into quartiles: the 25% of students who least often used the solutions were compared to the 25% of students who most often used the solutions. The mean scores of these two groups were nearly identical (results not shown). The difference in mean scores that might be attributed to frequency of use of the solutions manual was apparent only in the most extreme cases.
Finally, the data were sorted and ranked by score achieved by the students. The seven students who achieved the highest total points in the class were compared to the seven students who achieved the lowest total points in the class. Although the mean number of visits to the solutions manual by the top students was slightly greater than that by the bottom students, the difference was small and not significant (results not shown). Furthermore, the mean was heavily influenced by one student: the top student in the class (319 points) was the second heaviest user of the solutions manual (38 visits). Excluding this student, top students had an average use of the solutions manual less than that of the bottom students.
This procedure was repeated by sorting the data into quartiles, the quartiles being determined by score achieved. The difference in mean use of the solutions manual by the top 25% students and the bottom 25% students was not significantly different from zero. These results do not indicate that frequent use of the solutions manual is associated with scores achieved by higher performing students.
Discussion
The most significant and surprising result of this data is the overall poorer performance by students in the 2004 class, who had access to the solutions manual, relative to the 2002 class, which did not have access to the solutions manual. In spite of the availability of what would seem to have been useful information to help students prepare for quizzes and exams, the 2004 class had a significantly lower mean score than the 2002 class. It is unlikely that this result occurred because of any difference in the structure of the class, the grading of the quizzes and exams, or the proficiency of the instructor, since the two classes were as similar in these aspects as likely to be possible. It is possible that the result could be attributed to the latter class being composed of less able students. However, given the reasonably large number of students in each class (74 and 76) and the general homogeneity of student abilities each year, this seems somewhat unlikely, although it is a possibility. At any rate, no data was available on the capabilities of students in each class.
A difference in performance of students who were low users of the solutions manual from those who were frequent users was apparent only in the most extreme cases. Since the most extreme cases were small samples (7 students each), this result is not too convincing. The apparent difference in the scores of the low users and frequent users is dependent upon one or two extreme cases. The poor performance of the extreme low user group may also be due to the fact that that group contained students who had become disengaged from the course, essentially giving up any attempt to pass the class.
Conclusion
Contrary to the author’s prior expectation, the ready availability of end-of-chapter solutions to assigned practice problems did not enhance student performance on quizzes and exams. The evidence suggests that the ready availability of the solutions may even have contributed to a decrease in performance. Although students almost certainly like the availability of the solutions, the evidence suggests that what they like is not necessarily good for them, similar to many other aspects of life. Students probably feel that having the solutions available to them will make learning, or at least scoring well enough to pass the class, easier for them and make their study time more efficient. If the students’ goals are to achieve higher scores and grades in the class, making the solutions readily available to them is doing many of them a disservice.
Endnotes
1
Quizzes were closed book, closed notes. Students were allowed to drop one quiz, counting the three highest scores out of four quizzes for determining their course grades. On exams, students were allowed to have a 4” by 6” index card of notes of their choice.
2
Blackboard Learning Systemtm (Release 6), copyright 1997-2004. This system allows students enrolled in the class to access, from any computer, any materials made available by the instructor, as well as for a variety of interactive uses. See www.blackboard.com for more information.
3
The measure of total visits to the solutions manual for each student was available but was not used as the measure of student use because of the ambiguity of the measure. It wasn’t clear if multiple visits during the day were different sessions (e.g. a visit in the morning and another in the evening) or simply leaving one chapter solution for a moment then returning to it in the same session. Student-days as a measure of activity seemed less ambiguous.
4
A f test for equal variances found that the null hypothesis of equal variances for the two classes could not be rejected at the 95% confidence level.
5
Although the distribution of students’ scores very closely approximated a normal distribution, the distribution of student-days visits was somewhat skewed by a few very frequent users and bounded on the left tail at zero, so its distribution was only very approximately normal. The standard linear regression procedure assumes normality, an assumption that is only approximately true for these data. A rank order correlation, Spearman’s rho, was also calculated; the result was similar to the results shown in the paper: there was no evidence of significant correlation between the students ranked by use of the solutions manual and the ranks of students by total points achieved.
6
References
Chan, K., C. Shum, and D. Wright. “Class Attendance and Student Performance in Principles of Finance,” Financial Practice and Education, (1997), 58-65.
Ross, S.A., R.W. Westerfield, and B.D. Jordan, B.D., Essentials of Corporate Finance. (New York, 2001/2004), 4th & 3rd ed., McGraw-Hill/Irwin.