www.nat-hazards-earth-syst-sci.net/12/615/2012/ doi:10.5194/nhess-12-615-2012
© Author(s) 2012. CC Attribution 3.0 License.
Natural Hazards
and Earth
System Sciences
Rockfall hazard and risk assessments along roads at a regional
scale: example in Swiss Alps
C. Michoud1, M.-H. Derron1, P. Horton1, M. Jaboyedoff1, F.-J. Baillifard2, A. Loye1, P. Nicolet1, A. Pedrazzini1, and A. Queyrel3
1Institute of Geomatics and Risk Analysis, University of Lausanne, Lausanne, Switzerland 2Security service, Bagnes municipality, Switzerland
3Ecole des Mines d’Al`es, Al`es, France
Correspondence to: C. Michoud (clement.michoud@unil.ch)
Received: 17 February 2011 – Revised: 27 January 2012 – Accepted: 2 February 2012 – Published: 14 March 2012
Abstract. Unlike fragmental rockfall runout assessments, there are only few robust methods to quantify rock-mass-failure susceptibilities at regional scale. A detailed slope an-gle analysis of recent Digital Elevation Models (DEM) can be used to detect potential rockfall source areas, thanks to the Slope Angle Distribution procedure. However, this method does not provide any information on block-release frequen-cies inside identified areas. The present paper adds to the Slope Angle Distribution of cliffs unit its normalized cumu-lative distribution function. This improvement is assimi-lated to a quantitative weighting of slope angles, introducing rock-mass-failure susceptibilities inside rockfall source areas previously detected. Then rockfall runout assessment is per-formed using the GIS- and process-based software Flow-R, providing relative frequencies for runout. Thus, taking into consideration both susceptibility results, this approach can be used to establish, after calibration, hazard and risk maps at regional scale. As an example, a risk analysis of vehicle traffic exposed to rockfalls is performed along the main roads of the Swiss alpine valley of Bagnes.
1 Introduction
Mountain roads are frequently exposed to fragmental rock-falls (Piteau and Peckover, 1978; Budetta, 2004), involving independent blocks of relatively small sizes characterized by high energy and mobility (Whalley, 1984; Willie and Mah, 2004). Recent advances of high resolution Digital Elevation Models (HRDEM) combined with Geographical Information System (GIS) technologies have made rockfall susceptibility mapping possible (Willie and Mah, 2004; Derron et al., 2005;
Cascini, 2008; Jaboyedoff et al., 2012). The field of propaga-tion modeling is under fast development, aiming to compute runout probabilities with empirical, process-based and GIS-based models (Dorren, 2003; Volkwein et al., 2011), such as CONEFALL (Jaboyedoff and Labiouse, 2011), Rockyfor3D (Dorren, 2011), HY-STONE (Crosta et al., 2004) or ILWIS (van Dijke and van Westen, 1990). However, there are not yet robust and objective methods to detect source areas at a regional scale and quantify rock-mass-failure mean suscep-tibilities. In the present work, the authors intend to provide information about susceptibility indicators on potential rock-fall source areas.
Rockfall is very likely to be found in steep slopes (Heim, 1932; Hoek and Bray, 1981; Crosta and Agliardi, 2003; Dor-ren, 2003). From a basic approach, unstable rock slopes can be delimited through the steepness of the topography. It can be done with a simple method of slope angle thresh-old, which can be defined from distinctive evidence (i.e. cliffs lying above scree deposits, fieldworks or historical events) when it is not arbitrary defined (Toppe, 1987; Dorren and Seijmonsbergen, 2003; Guzzetti et al., 2003; Jaboyedoff and Labiouse, 2003; Frattini et al., 2008).
Furthermore, several authors showed supplementary con-ditions influencing rock slope stability (Terzaghi, 1950, 1962; Bieniawski, 1976; Selby, 1982; Willie and Mah, 2004, Jaboyedoff and Derron, 2005), classified in internal parameters (IP, i.e. lithological, geo-mechanical and struc-tural settings) and external factors (EF, e.g. active tectonic, water infiltration, weathering, etc.). Therefore, more com-plex models have been developed integrating these condi-tions to enhance the source detection at regional scale. They introduced rating systems following empirical multi-criteria
observations (Pierson et al., 1990; Baillifard et al., 2003), structural settings and kinematics analysis (Wagner et al., 1988; Jaboyedoff et al., 1999; Gokceoglu et al., 2000; G¨unther, 2003), safety factor computations (Hoek and Bray, 1981), or joining IP and EF conditions (G¨unther et al., 2004; Oppikofer et al., 2007).
But, all these methods obviously depend on the possibility of collecting a lot of complex and reliable information on the area of interest. For example, the simplified Rockfall Hazard Rating System method (Pierson et al., 1990; Budetta, 2004) requires eleven parameters per outcrop as an input to esti-mate the rockfall susceptibility along a road. Moreover, these methods usually use very high resolution datasets that are not often available at regional scale. For instance, G¨unther (2003) applied his model SLOPEMAP to extract structural features of the hard rock terrain using a 5×5 m DEM pixel size for a study area of 2.5 km2, which is inappropriate when only 10×10 up to 30×30 m DEM pixel sizes are available at regional scale. These methods require too high resolution information and too many parameters to be practically and rapidly applied on fairly large areas.
However, strong correlations between topography and earth surface processes have been suggested for many years (Powel, 1876 and Gilbert, 1877, cited in Montgomery and Brandon, 2002; Strahler, 1954). The terrain morphology reflects the compounded influence of these internal settings (Locat et al., 2000). Hence, Rouiller et al. (1998) and then Loye et al. (2009) proposed the Slope Angle Distribution (SAD) procedure to use the topography as a proxy to de-tect potential source locations. The next step is to assess the susceptibility level of rockfall release of the potential source locations previously detected. Therefore, this paper proposes to improve the SAD procedure by linking the cumulative dis-tribution function of the slope angle to quantitative block re-lease susceptibility.
The Flow-R software (Horton et al., 2008; Blahut et al., 2010; Kappes et al., 2011) is used to compute rockfall runout areas. It assesses propagations thanks to an open choice of algorithms and parameters of probabilistic spreading and ba-sic energy balance, such as a multiple flow direction model (Holmgren, 1994) coupled with an inertial factor (Gamma, 2000) and a maximum runout distance based on a Coulomb friction model. Moreover, since Horton et al. (2008), the model has been modified to take into account the suscepti-bilities of block releases in the resulting spreading.
Finally, this improved methodology allows us to draw rockfall susceptibility maps. Then, after a calibration based on available rockfall inventories, hazard maps can be ob-tained, taking into consideration both relative frequencies of block release and propagation (Jaboyedoff et al., 2005; Corominas and Moya, 2008). Indeed, the hazard is always a challenging parameter to estimate in a Quantitative Risk Assessment (QRA) (Corominas et al., 2005).
As an example of the applicability of this procedure, the risk of fragmental rockfalls to vehicle traffic along the main
32
1
2
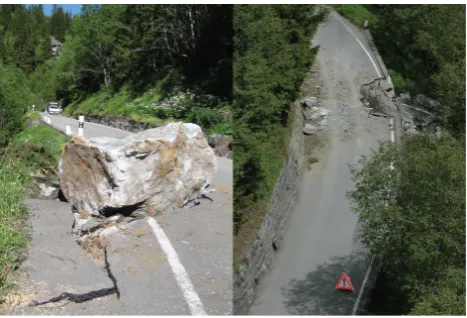
Figure 1. Photography of a rockfalls event in 2006 that reached twice the road section near
3
Les Plamproz
, in the Bagnes Valley.
4
5
Fig. 1. Photography of a rockfalls event in 2006 that reached twice
the road section near Le Plamproz, in the Bagnes Valley.
roads of the Swiss Alpine valley of Bagnes (Fig. 1) is as-sessed and expressed in terms of number of direct impacts per year of blocks on vehicles.
2 Methodology
2.1 Detection of sources areas
2.1.1 Slope Angle Distribution procedure
Strahler’s law of constancy of slopes (Strahler, 1950) tells that the morphology of a slope topography tends to group predominantly around several mean slope angle values that are normally distributed with low dispersion. These partic-ular slope angles of convergence can be often related to the most frequently encountered four major morphological units (Oppikofer et al., 2007; Loye et al., 2009):
– Plains formed by fluvio-glacial deposit; these corre-spond to the set of low slope angles;
– Bottom parts of the valley flanks comprising alluvial fans related to debris flow deposits and landslides mass. These correspond to the set of foot slopes angles;
– Talus slopes and valley sides (flank) covered by till, screes and debris mantles as well as rocky outcrops lightly covered with soil. These correspond to the set of steep slopes angles;
– Cliffs and rock faces corresponding to the very steep sets of slope angles.
Hence, the morphology of a terrain displays characteristic slope angles that can be directly related to the geomorphic
processes involved in slope stability. Rockfall source areas are commonly found in the steepest morphological units.
Based on these statements, Rouiller et al. (1998) and then Loye et al. (2009) have established a DEM-based geomor-phometric approach to detect these morphological units and therefore rockfall source areas, named the Slope Angle Dis-tribution (SAD) procedure. The classification is done by computing the Slope Angle Frequency Distribution (SAFD) of the study area, the frequency being normalized consider-ing their real surface of occurrence. The SAFD is then de-composed into several Normal distributionsf:
f (s)=w· 1 σ
√ 2π
·exp "
−1 2·
s−m c
σ
2#
(1)
where f is the normal probability distribution func-tion (PDF) of the slope angle value s included within the interval [0;90],σ its standard deviation,mc its mean value (Kreyzig, 2006) andwa weighting factor which is linked to the proportions between unit surfaces inside study areas. The sum of these theoretical normal curves has to rebuild the real SAFD (Fig. 2a).
The above-mentioned sets of morphological units do not always exist in the study area; the number of normal curves is therefore given according to the number of morphological units present in the area of interest (as detailed in Loye et al., 2009). Moreover, in some cases (Fig. 3a), the distribu-tion of the slope angles of cliffs units has to be decomposed into two normal functionsf1andf2.This can be caused by the topography itself (potential high dispersion of this unit that possibly exists from 45◦to 90◦) or by the extent of the support (limits of the study domain). In theory, it could be di-vided into more than two distributions; but in our experience, two distributions are sufficient. Then, the total distributionft of cliffs units is simply defined as the sum off1andf2:
ft(s)=f1(s)+f2(s) (2)
Technically, the input values for the initial normal distribu-tions are defined according to the local maximum and min-imum that can be visually identified along the SAFD. The fitting process is performed by minimizing the error between the most-likely sets of normal curves and the target function (namely the SAFD) using a simplex optimization solver. The morphological units are then delimited finally according to the sets of normal Slope Angle Distribution, where a nor-mal curve becomes dominant over the others. An example of classified slope steepness map in shown in Fig. 4. The cliffs morphological unitft is then considered as the poten-tial rockfall sources areas.
Finally, considering that the local morphology of an Alpine valley is partly controlled by structural settings and rock-mass properties (Terzaghi, 1962; Selby, 1982; Willie and Mah, 2004), different lithological and tectonic units have to be considered in order to refine the morphological analy-sis. Therefore, the study area is classified in homogeneous
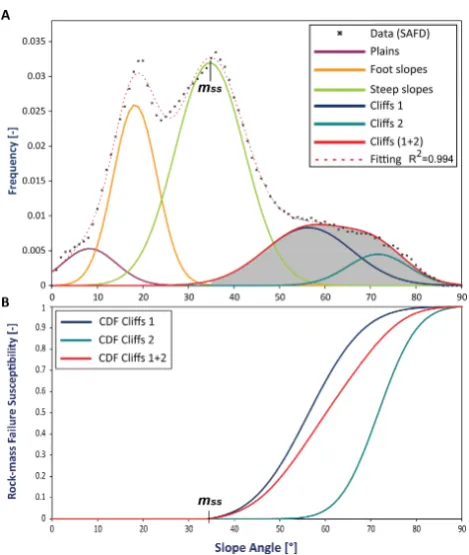
Fig. 2. (A) Normal distributions of the slope angles of the granitoids
HMA in the Bagnes Valley, extracted from a 10 m-DEM. Three pa-rameters are used to detect potential rockfall source areas:mcwhich is the mean angle of the cliffs distribution andσ its standard devi-ation;msswhich is the mean angle of the steep slopes distribution. In this case, cliffs units are decomposed in only one normal distri-bution. (B) Normalized cumulative distribution function (Fn) for the cliffs units, assimilated to a quantitative weighting of potential rockfall source areas, i.e. to a rock-mass-failure susceptibility. The mean angle of the steep slopes distributionmssis used as a first threshold to exclude lower values as potential rockfall source areas.
morphotectonic areas (HMA), following similar lithological characteristic rock mass structure and geomorphic activity, and one SAD procedure has to be done for each HMA.
To sum up, the SAD is a systematic approach to extract a slope angle lower threshold for each HMA, corresponding to the limit between the steep slopes and cliffs normal distri-butions. This procedure leads to Booleans results (i.e. in/out cliffs units) and cells included inside these cliffs areas are considered as potential sources of fragmental rockfalls. 2.1.2 Refinement of the Slope Angle Distribution
As stated in the introduction, taking into account all internal parameters and external factors can require too high resolu-tion dataset and too many parameters to be applied on a fairly regional scale in order to precisely detect and rate potential rockfall source areas. But as topographies are strongly cor-related with internal rock settings (Locat et al., 2000) and
Fig. 3. (A) Normal distributions of the slope angles of the marbles
HMA in the Bagnes Valley. Here, cliffs are decomposed in two normal distributions. (B) The normalized cumulative distribution function (Fn) of the sum of the two cliffs distributions (ft) is shown by the red line. In comparison, the normalized cumulative distribu-tion funcdistribu-tions for the two cliffs distribudistribu-tions are shown in blue (f1) and cyan (f2).
35
1
2
Figure 4. Example of main morphological units in a region of the Bagnes valley according to
3
slope angle thresholds got thanks to the
SAD
procedure. (Hillshade and 10 m isohypses:
4
©2008 swisstopo)
5
6
Fig. 4. Example of main morphological units in a region of the
Bagnes valley according to slope angle thresholds got thanks to the SAD procedure. (Hillshade and 10 m isohypses: ©2008 swisstopo).
Fig. 5. Theoretical computation of rockfall runouts from two source
areas on a DEM grid. These relative frequencies (numbers in the green and blue cells) of rockfall propagations take into account (1) the initial rock-mass-failure susceptibilities (numbers in the orange cells) and (2) the integration of all computed propagations with probabilistic spreading algorithms. The maximum runout distance is reached when the simple Coulomb friction model becomes zero.
Earth surface processes (Montgomery and Brandon, 2002), we assume that for large areas, the block release susceptibil-ity is a function of slope angles. Thus, improving the SAD approach, this paper aims to link the cumulative distribution functions of slope angles of cliffs units to rock-mass-failure susceptibility inside rockfall source areas previously identi-fied.
The explanations below will illustrate only the situa-tion where cliffs units are decomposed in two distribusitua-tions (Eq. 2). When it is not the case,ft is equal tof1. The associ-ated cumulative distribution functionF of cliffs distribution is defined by:
F (β)= β Z
0
ft(s)·ds (3)
wheresandβare two slope angle values included within the interval [0;90]. By definition, Eq. (3) gives the probability that a slope anglesis lower thanβ (Kreyzig, 2006). Thefore, it is by extension assimilated to a quantitative block re-lease susceptibility. Moreover, the mean value of the steep slopes distribution mss, extracted from the SAD procedure (Figs. 2a and 3a), relates to an apparent equilibrium slope angle of scree deposits (usually around 35◦, that mainly com-pose steep slopes units). Thus, for higher slope angle values thanmss, blocks can be mobilized; on the contrary, for lower slope angle values, blocks are not considered. As a conse-quence, mss is used as a lower threshold to exclude areas
not steep enough to be potential source of rockfalls. Thus, Eq. (3) has to be cutoff bymssand then normalized for slope angle values higher thanmss; the final cumulative functionFn is shown in Figs. 2b and 3b and defined by:
(
∀β∈[0;mss[⇒Fn(β)=0 ∀β∈[mss; 90]⇒Fn(β)=F (F (β)90)−−F (mF (mssss))
(4)
The normalized cumulative distribution functionFncan be assimilated to a quantitative weighting of potential rockfall source areas, i.e. a rock-mass-failure susceptibility indicator (Fig. 7), identified according to the slope angles and the SAD procedures.
2.2 Runout assessment
Many tools have been developed to calculate runout areas of rolling, bouncing or falling blocks (Ritchie, 1963) and have been reviewed by Dorren (2003). In this study, the runout simulation is computed by the Flow-R software (Horton et al., 2008). The propagation is assessed by means of a prob-abilistic spreading and a basic energy balance, controlling respectively the lateral extent and the runout distance, merg-ing several models and approaches. Everythmerg-ing is processed at the cell level and iterated on the DEM grid according to the propagation direction. This study is the first to use the Flow-R software for rockfall runout assessment. Thanks to the open choice of algorithms and parameters, it has been possible to parameterize the model according to our needs at regional scale. The model has also been modified to take into account the susceptibilities of the sources (calibrated on the base ofFn) in the resulting spreading, which is a step further in the frequency analysis. It allows us to approach the haz-ard frequency of a location more consistently than before by relating it to the source susceptibilities.
2.2.1 Probabilistic spreading
Probabilistic spreading is based on flow direction algorithms that process the probability of a cell to flow to its neighbors (Horton et al., 2008). The probability is integrated in a con-tinuous way, meaning every neighboring cell having a non-null probability will be propagated further. Flow direction algorithms, that are the basis of the spreading, portion the probabilities according to the slope of the surrounding cells. Fairfield and Leymarie (1991) have introduced the multi-ple flow direction algorithm as a stochastic method which gives a probability to every cell with a descending slope. Then Holmgren (1994) has suggested a variation of this method by introducing the exponentαon the slope gradient:
∀
tanβi>0
α∈[1;+∞[ ⇒Pf(x)=
(tanβi)α
8
P
j=1
(tanβj)α
(5)
wherei,j are the flow directions,Pfis the probability pro-portion in directioni, tanβiis the slope gradient between the
central cell and cell in directioni, andαis the exponent to calibrate.
The exponent α allows us to better control the spread-ing extent from the multiple flow direction algorithm. When
α=1, Eq. (5) is equivalent to the multiple flow direction al-gorithm (Fairfield and Leymarie, 1991), and whenα→ ∞ to theD8 algorithm (propagation following only the steepest slope: O’Callaghan and Mark, 1984; Jensen and Domingue, 1988).
In addition to the flow direction algorithm, a persis-tence factor was introduced as in Gamma (2000), which is a weighting of the probability according to a direction change. The chosen values are the same as Gamma (2000), i.e. 1 when there is no change in direction and 2/3 in any other case. The role of this persistence factor is to take into consideration the inertia according to the previous directions of the moving blocks which can therefore deviate from the steepest paths.
2.2.2 Runout distance
The runout distance is assessed thanks to a basic energy bal-ance including the potential and kinetic energy components and an energy loss function. As the source mass is unknown, the energy balance is processed on a unit mass. For the en-ergy loss function, a simple Coulomb friction model (with a single friction coefficient) was used:
1Eloss=g×1x×µ (6)
where1x is the increment of horizontal displacement,gthe gravity acceleration andµis the tangent of the friction angle. To this algorithm, we can add an upper threshold to limit the velocity of blocks or an equivalent kinetic energy (Horton et al., 2008). Then, the maximum runout distance is reached when the energy becomes zero, i.e. when the initial potential energy has been completely lost by friction.
2.2.3 Results in Flow-R
Flow-R can be used now to draw maps of relative frequen-cies of rockfall using: (1) the spreading probability based on a multiple flow algorithm including an inertial factor, and (2) the maximum runout distance based on a Coulomb friction model. Finally, Flow-R provides for each cell of the DEM the integration of relative frequencies, function of (1) the ini-tial rock-mass-failure susceptibilities Fn of onset cells and (2) of all computed rockfall propagations Pf which can be superimposed (Fig. 5).
2.3 Rockfall quantitative hazard mapping along roads
The hazard H is the mean frequency of occurrence at a punctual locationx of a defined phenomenon of magnitude equal or greater thanEper year, i.e. the multiplication of a rock-mass-failure mean frequency and a probability (Pf) of
Table 1. Parameters used to assess rockfall hazard and risks along roads. Bold typo: input parameters needed to solve equations; normal
typo: intermediary or final results solved during the assessment; italic typo: useless parameters because deleted during the equations’ simplifications.
Acronym Complete appellation
α Exponent in the Holmgren’s (1994) expression
d Diameter of blocks considered
l Mean length of the car
mc Mean values of cliffs distributions
mss Mean values of steep slopes distributions
µ Friction angle of the runout energy calculation
Nb Number of rockfall events inventoried along road section s andβ Slope angle values
σ Standard deviations of cliffs distributions
T Traffic per time period tc ti Time period of the inventory
v Mean velocity
w Weighting factor of normal distribution function
xrs Road section’s cells locations
f,f1,f2andft Normal distribution function
F Cumulative distribution function
Fn Normalized F: rock-mass-failure susceptibility
H Hazard
k Calibration factor of hazard
R Risk
E Magnitude of the rockfall event (function of d)
Exp Exposure
g Terrestrial acceleration
iandj Flow directions in the Holmgren’s (1994) expression
L Mean length of the road within a pixel
Nc Total number of vehicles during tc
Pcell Probability of a car to be hit inside a pixel
Pf Relative frequency of propagation (in the Flow-R’s results)
tc Considered period of time in the Risk equation
x Punctual location
xp Pixel location
1x Increment of horizontal displacements in the friction model
propagation (Leroi, 1996; Fell et al., 2005, 2008; Jaboyedoff et al., 2005; Volkwein et al., 2011).
However, the rock-mass-release susceptibilities Fn ex-tracted from the improved SAD approach are relative to the slope angles and are not absolute numbers. Moreover, the frequencies of propagationsPfare assessed by Flow-R based on a unit mass and no different magnitudes of events (i.e. blocks volumes) can be considered. As a consequence, Flow-R results (namelyFnmultiplied byPf)have to be cali-brated to adjust the hazard by a factorkwhich is a calibration term that links these results with observed events per year for a given magnitude:
H (E,xp)=k (E)×Fn×Pf xp
(7) In Eq. (7), the rockfall hazardH(number of event per year) for a magnitudeEis defined for a period of referenceti at
a cell xp and is equal to the product of rock-mass failure susceptibilitiesFntimes frequencies of propagationPfup to a cellxpand times a calibrating factork, that depends onE. This coefficientkdepends on a known number of rockfall events with a given magnitudeEin a cellxp. However, in a context of rockfall studies along corridors, exact positions of impacts are unknown. For practical issues, inventories are frequently made along road sections. On a DEM, a road sec-tion is composed of a group of cellsxrs. So the inventoried number of eventsNbalong the section is the sum of all the rockfalls that occurred within the cells of this section dur-ing the time periodti of the inventory. Thus, Nb has to be distributed in all the cells assessed following:
k (E)=Nb(E,tr,xrs)×
1 P
[Fn×Pf(xrs)] ×1
ti
(8)
37 1
2
Figure 6. Studied road sections and homogenous morphometric areas of the Bagnes Valley, 3
located in the Swiss Alps, classified according to the swiss national geological atlas and the 4
Vector25 (©swisstopo). They were identified differentiating daily traffic and mean velocities 5
along the roads. The road section used to calibrate the rockfall hazard assessment is located 6
between the second gallery after Lourtier and Les Plamproz (section underlined in yellow), 7
where the rockfall activity is high, as shown in Fig. 1. (Hillshade and 10 m isohypses: ©2008 8
swisstopo) 9
10
Fig. 6. Studied road sections and homogenous morphometric areas of the Bagnes Valley, located in the Swiss Alps, classified according
to the swiss national geological atlas and the Vector25 (©swisstopo). They were identified differentiating daily traffic and mean velocities along the roads. The road section used to calibrate the rockfall hazard assessment is located between the second gallery after Lourtier and Le Plamproz (section underlined in yellow), where the rockfall activity is high, as shown in Fig. 1. (Hillshade and 10 m isohypses: ©2008 swisstopo).
38 1
2
Figure 7. Rock-mass failure susceptibility in the Bagnes Valley, identified thanks to the 3
improved Slope Angle Distribution approach. (Hillshade and 10 m isohypses: ©2008
4
swisstopo) 5
6
Fig. 7. Rock-mass failure susceptibility in the Bagnes Valley, identified thanks to the improved Slope Angle Distribution approach. (Hillshade
and 10 m isohypses: © 2008 swisstopo).
wherekis calibration factor with a frequency unit, function of a number of rockfall eventsNbof magnitudeEduring a period of timetiinventoried along a road section of cellxrs divided by the sum of the Flow-R results within the whole road section.
2.4 Rockfall quantitative risk assessment along roads
Blocks frequently hit cars along Swiss mountain roads and occupants of vehicles are not necessarily killed or injured. Therefore, this paper is focused on the riskR of rockfalls to vehicle traffic; no considerations about vulnerabilities and elements at risk are provided, even if it would give propor-tional results. Adapting the risk equation of Fell et al. (2005) to this specific case, the annual risk can be defined by:
R E,xp
=H E,xp
×Exp xp
×Nc xp
(9) whereR is the risk expressed in terms of number of direct impacts of blocks on cars per year, according to the hazardH
and the exposure Exp, i.e. the probability that cars is hit in the hazardous area, andNc the number of threatened vehicles. Modified after Fell et al. (2005), the exposure is presented as:
Exp xp= L v xp
×1 tc
×Pcell xp (10)
Exp depending on the mean length of the road inside cellsL
and the mean velocityvfor a considered time periodtc(one year in this case) and the conditional probabilityPcell:
Pcell xp
=d+l
L (11)
wherePcell is the probability that a car of lengthl is hit by a block of diameterd on average inside a cell of lengthL, knowing that a block falls into a cell where a car is present. Indeed, in this study hazard and exposure are defined on a cell’s scale xp, not on a punctual location x. It is assumed that
dis the minimum size block that will significantly affect the car and the magnitude E is equivalent to the block size. The diameter of blocksd has to tally with the inventoried events
Nbconsidered to calibrate the hazard in Eq. (8). Then, the total number of vehicles attended on a road section is equal to Eq. (12):
Nc(xp)=T (xp)×tc (12)
whereT correspond to the daily traffic. Finally, the annual risk induced by rockfalls to vehicle traffic for an event with defined magnitude at a pixelxpcan be rewritten as follows:
R E,xp=H E,xp×
d+l
v xp
×T xp
(13)
Rbeing a number of direct impacts of blocks of diameterd
on cars of lengthl per year for a defined magnitudeEat a cellxp, function of the hazardH, the daily road traffic T,
the mean velocityv, the mean car lengthland the minimum block diameterd. Finally, the total risk along corridors is defined as the integration of all calculatedR(E,xp)within the considered road sections.
3 Case study: the Val de Bagnes
3.1 Settings
The Val de Bagnes is located in the Canton of Valais in Switzerland. With a surface area of 300 km2 and an el-evation ranging from 677 m to 4313 m a.s.l., this munici-pality is under rapid development, in particular because of the fast growth of the Verbier ski resort. Moreover, an im-portant power dam is located in the upper part of the val-ley. It means that the daily traffic is rather heavy, up to 5800 cars and 32 buses per day according to open-access databases (SRCE, 2009; CarPostal, 2010). Rockfall suscep-tibility maps at 1:25 000 were already performed (Michoud et al., 2010; Jaboyedoff et al., 2012). In this paper, a QRA of rockfalls to vehicle traffic is performed along the main roads (40 km) of the valley.
To achieve this goal, the authors used a 10 m cell size DEM derived from national maps at 1:25 000 (CN25, © swisstopo) to extract slope angles, the geological and tectonic vector at-las at 1:500 000 (© swisstopo) to cat-lassify the valley by HMA and the vectorized landscape model of Switzerland (Vec-tor25, © swisstopo) to extract the location of the 40 km of roads.
3.2 Rockfall hazard assessments
3.2.1 Detection of block release areas
The rock type present is very large, from Cambrian poly-cyclic basements to Mesozoic and Cenozoic sedimentary covers (Sartori et al., 2006) of the Helvetic, Penninic and Austro-Alpine domains (Tr¨umpy, 1980). Furthermore, large areas are covered by quaternary deposits that are fluvio-glacial deposits, colluvial fans or moraines. As the material diversity is wide, it justifies the importance of the HMA sepa-ration before further steps. Thus, each HMA was determined according to similar lithologies extracted from the 1:500 000 vectorised geological Atlas of Switzerland. Height classes were identified (Fig. 6): basic rocks, conglomerates, flyschs, granitoids, limestones, moraines, marble plus breccias and schists. In addition, some areas, such as lakes or alluvial de-posits, were directly mapped as areas without any rockfall sources, due to absence of relief and/or material.
Then SAD analysis was performed from the 10 m DEM (©2008 swisstopo) and the useful slope angles (mss,mcand
σ for each HMA) were extracted to identify and weight po-tential rockfall source areas within the height HMAs. Results are presented in Table 2. This procedure was done thanks to the freeware Histofit (Loye et al., 2009) which decomposes
Table 2. Slope angles extracted from SAD analysis of each HMA. According to Fig. 2a and 3a, mean values and standard deviations of cliffs
distributions correspond respectively to lettersmcandσ, and mean values of the steep slopes to lettersmss.
Homogenous Morphometrical Areas mss 1st normal distribution 2nd normal distribution (when necessary)
mc σ mc σ
Basic rocks 33◦ 53◦ 8.3◦ – – Conglomerates 31◦ 46◦ 8.7◦ – – Flyschs 35◦ 48◦ 7.5◦ 60◦ 7.7◦ Granitoids 34◦ 51◦ 7.7◦ – – Limestones 35◦ 45◦ 8◦ 60◦ 8.0◦ Marble and Breccias 33◦ 50◦ 6.4◦ 62◦ 7.4◦ Moraines 33◦ 44◦ 6.1◦ – – Schists 30◦ 47◦ 8.3◦ 61◦ 8.9◦
the SAFD extracted from the software ArcGIS of Esri© and fits it with a predefined number of normal distributions. With the normal curves defined in Histofit and a slope angles map of the region, a MATLAB script allows to calculate directly rock-mass-failure susceptibilitiesFn(Eq. 4) in each potential rockfall source cell of the map. Finally, the potential onset areas within each HMA were merged in one map (Fig. 7) before computing one propagation assessment.
3.2.2 Runout assessment
Taking into account local observations (Jaboyedoff et al., 2012) and detailed studies including computations of 2-D and 3-D rockfall modeling made for specific local cliffs into the valley, parameters of the runout assessment by Flow-R were calibrated as following: α = 1 (Eq. 5) and µ = tan 33◦(Eq. 6). Then, only one computation was done for the whole valley using the 10 m DEM (Fig. 8) to ensure con-tinuous and homogenous results. Finally, these results were compared with a test simulation performed by the freeware CONEFALL (Jaboyedoff and Labiouse, 2011) based on an energy line angle equal to tan 33◦too. Both lateral and longi-tudinal extensions of computed runout areas are quite similar inside the Bagnes valley, which guarantee the coherence of the Flow-R runout assessment.
3.2.3 Rockfall hazard assessments
In order to achieve the normalized quantitative hazard assess-ment along the road sections, it is necessary to calibrate the Flow-R results with the factork(Eq. 8 in Sect. 2.3). The road section used to calibrate the model is located on the NW side of the Dranse river, between the second gallery after Lourtier and Le Plamproz (Fig. 6), where the strong activity of cliffs has been well known for many years (Fig. 1). Along this section, covered by 237 cells with a sum of Flow-R results equal to 9453, it was assumed that 3 blocks with diametersd
equal or greater than 25 cm reach the road every year (ti = 1)
Table 3. Parameters for risk calculation along the different studied
road sections (according to CarPostal, 2010, SRCE, 2009 and local road regulations). These road sections are mapped in Fig. 6.
Road T v d l
Sections [daily traffic] [km h−1] [m] [m] Sembrancher 10 600 cars 80 0.25 4 Chable 5800 cars 80 0.25 4 Verbier 5000 cars – 32 bus 60 0.25 4 Lourtier 2200 cars – 22 bus 70 0.25 4 Fionnay 800 cars – 8 bus 50 0.25 4 Mauvoisin 600 cars – 6 bus 40 0.25 4
according to our knowledge of past events. Then according to Eq. (8):
k (d≥25 cm)=3× 1 9453
events per year (14)
An extract of the hazard map is presented in Fig. 9. 3.3 Rockfall risk assessment along the main roads
of the valley
3.3.1 Inputs
The main important roads of the Val de Bagnes were ex-tracted from the Vector25 (© swisstopo). The daily traf-fic along the valley roads consideredT were obtained from open-access databases (SRCE, 2010 and CarPostal, 2010). Mean vehicles velocitiesv were estimated according to the local regulation and the state of the roads (roadwidth and age-ing). Thus, six distinct road sections were distinguished and presented in Fig. 6 and Table 3, differentiating daily traffic and velocities along them. Moreover, the mean car length was set at 4 m, which corresponds to normal European com-pact car length. All parameters used in Eq. (13) are summa-rized in Table 3.
39 1
2
Figure 8. Rockfalls relative hazard assessment in a part of the Bagnes Valley, performed by 3
the software Flow-R. In the lower part of the valley (Sembrancher, Chable, Verbier), the daily 4
traffic is rather heavy but the exposition is low. On the contrary, in the upper part of the valley 5
(Fionnay and Mauvoisin), the daily traffic is lower but the hazard is pretty much higher. 6
(Hillshade and 10 m isohypses: ©2008 swisstopo) 7
8
Fig. 8. Rockfalls relative hazard assessment in a part of the Bagnes Valley, performed by the software Flow-R. In the lower part of the valley
(Sembrancher, Chable, Verbier), the daily traffic is rather heavy but the exposition is low. On the contrary, in the upper part of the valley (Fionnay and Mauvoisin), the daily traffic is lower but the hazard is pretty much higher. (Hillshade and 10 m isohypses: ©2008 swisstopo).
40 1
2
Figure 9. Inverse hazard once the calibration performed, focused along the road section of 3
Fionnay. Gaps along the section correspond to tunnels. (Hillshade and 10 m isohypses: 4
©2008 swisstopo) 5
6
Fig. 9. Inverse hazard once the calibration has been performed, focused along the road section of Fionnay. Gaps along the section correspond
to tunnels. (Hillshade and 10 m isohypses: ©2008 swisstopo) .
Table 4. Results of the quantitative risk assessment induced by rockfalls (mean diameter: 25 cm) to vehicle traffic along road sections of the
Val de Bagnes. Finally, the whole risk is defined as the sum of all calculated pixel.
Road Sections Total number of cells Number of reached cells Risk [xcars every year] Inverse risk [1 car every x years]
Sembrancher 559 197(35%) 2.955×10⁻³ ∼340 Chable 664 178 (27%) 4.626×10⁻³ ∼220 Verbier 1031 98 (10%) 1.668×10⁻⁴ ∼6000 Lourtier 851 63 (7%) 8.369×10⁻⁴ ∼1200 Fionnay 1288 976 (76%) 1.676×10⁻² ∼60 Mauvoisin 742 591 (80%) 8.787×10⁻³ ∼110 All roads 5135 2103 (41%) 3.414×10⁻² ∼30
3.3.2 Results
Finally, the annual risk induced by fragmental rockfalls greater or equal to a diameter of 25 cm to vehicle traffic was assessed along each road section of the Val de Bagnes. Results are summarized in Table 4. Along these sections, they vary a lot. In the lower part of the valley (Sembrancher, Chable and Verbier sections), where the daily traffic is im-portant, there are only a few rockfall propagations that reach the road. This is why the risk is evaluated at one hit car every two hundreds to six thousands years. On the opposite, in the upper part of the valley (Lourtier, Fionnay and Barrage sec-tions), the daily traffic is lower but there are a lot of blocks that reach the road; the risk is significantly higher, namely to one hit car every sixty years (Table 4). The integrated risk along all the road sections of the Val de Bagnes is evaluated to 0.03414 hit cars per year, i.e. approximately one incident every thirty years.
4 Discussions
4.1 Results within the study area
According to the authors’ experience and testimonies from local security services and geologists, the results (i.e. the lo-calization of potential rockfall onset areas, the runout com-putation and the risk assessment) are in agreement with ob-servations. Nevertheless, the hazard calibration (Eq. 14) could be significantly improved with more complete inven-tories along these roads (detailed discussion in Sect. 4.5). In addition, the calculated risk is approximated and simplified, because it does not take into account some factors. First, the time lapse for the driver to react and the braking distance in front of blocks already on the road are ignored, considering that the velocity is low enough to avoid a collision along the most exposed sections. Moreover, all surveys and remedia-tion measures already done (such as anchors, nets, removal of unstable blocks, monitoring systems, etc.) are ignored, except for tunnels and galleries which are mapped from or-thophotos. Finally, the potential inhomogeneous repartitions of rockfall events and traffic during the day are ignored; for
41
1
2
Figure 10. (A) A recent rockfall event (2 January 2012) cut a mountain road with a deposit of
3
approx. 1000 m
3. The height difference between the fresh scarp and the road is about 30 m.
4
(B) The rock-mass failure susceptibility map indicates that the onset is clearly defined as a
5
potential rockfall source area with an high rock-mass failure susceptibility of about 0.8. (C)
6
The trajectory of two blocks that reached a second road 80 m lower fit well with the predicted
7
runout and confirms Flow-R results. (Hillshade: ©2008 swisstopo)
8
9
Fig. 10. (A) A recent rockfall event (2 January 2012) cut a mountain
road with a deposit of approx. 1000 m3. The height difference be-tween the fresh scarp and the road is about 30 m. (B) The rock-mass failure susceptibility map indicates that the onset is clearly defined as a potential rockfall source area with an high rock-mass failure susceptibility of about 0.8. (C) The trajectory of two blocks that reached a second road 80 m lower fit well with the predicted runout and confirms Flow-R results. (Hillshade: ©2008 swisstopo).
example, during winter periods, workers drive early in the morning and late in the afternoon, when the cliffs are frozen. 4.2 Recent rockfall event
A recent rockfall occurred on 2 January 2012, during the re-view process of this paper. The deposit of approx. 1000 m3
cut a small road (Fig. 10a) and mostly stopped on it. The source area was localized in a zone clearly defined as a po-tential rockfall source area with a high rock-mass failure sus-ceptibility of about 0.8 (scale: no sussus-ceptibility = 0 – high-est susceptibility,= 1; see Fig. 10b). The trajectories of two blocks that reached a second road 80 m lower fit well with the predicted runout using Flow-R (Fig. 10c). Thus, this event is in agreement with the improved SAD approach and the Flow-R results, showing its potential ability to predict hazard and risk zones.
4.3 Advantages and limitations of the presented approach
The combination of the improved SAD approach and the Flow-R software allows us to establish rockfall susceptibil-ity, and when inventories are available, to obtain scaled haz-ard to assess risk along roads. This methodology has been optimized for studies at regional scale with only a little in-formation available. Indeed, this procedure requires at least topography DEM and, if possible, a geological map in order to improve the rock-mass failures susceptibilities and spread-ing probabilities.
The refinement of the SAD approach is based on the as-sumption that the release susceptibility is related to the geo-morphology, i.e. steepness of the topography, even if it is a simple rockfall activity factor. But, using geological infor-mation aims to indirectly take into account rock mass quality that influences the stability conditions, too. Nevertheless, it is also true that other very important local factors (such as weathering and/or deburstressing) cannot be taken into con-sideration for large areas, using documents available at re-gional scale. Then, regarding propagations, Flow-R assesses runout areas using only a DEM, since the parameters of the Holmgren’s and the Coulomb’s expressions (Eqs. 5 and 6) can be based on literature and/or past event records. This software is particularly optimized for regional studies and computation times are still acceptable with a normal work-station (five days for the study in Bagnes). Moreover, the approach can be even better calibrated according to other po-tential documents available for the study area (such as lan-duse maps, aerial images or information about mechanical rock parameters) in order to improve detection and runout settings. However, this procedure oversimplifies the laws governing rock-mass failures and block propagations, which are suitable at regional scale but become hazy for small stud-ies’ areas. Finally, this approach should be used as a prelim-inary quantitative assessment for large regions, highlighting hotspots requiring more detailed studies.
At local scales, robust empirical and physically-based methods have been developed for many years, allowing fine and realistic rock-mass failure detections & block propaga-tions. For instance, the RSS-GIS method (G¨unther et al., 2004) allows us to deal with internal parameters and external factors of rockfalls. But, it requires a lot of data on
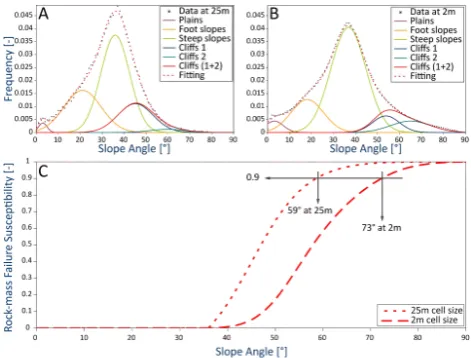
topog-Fig. 11. (A) Normal distributions of the slope angles of the
lime-stones HMA in the Bagnes Valley extracted from a 25 m resolu-tion DEM. (B) Normal distriburesolu-tions of the slope angles of the same limestones HMA in the Bagnes Valley extracted now from a 2 m resolution DEM. (C) Cumulative distribution functions are shown for the same limestone HMA, once with a 25 m resolution DEM and once with a 2 m resolution.
raphy, structural geology, geotechnical settings and climatic conditions. The RHRS method (Pierson et al., 1990) is based on eleven parameters that have to be checked on the field. These two approaches are therefore indicated for studies at local scales to reliably and accurately detect and rate poten-tial rockfall source areas; however, they would be too time-consuming for regional works if prioritized locations have not been defined before in-situ investigations. Then, regard-ing rockfall propagations, software like HY-STONE (Crosta et al., 2004; Frattini et al., 2008; Agliardi et al., 2009) is able to deal with both local and regional scales; moreover, it assesses probabilistic runout areas based on physical pro-cesses and computations of trajectographies. Furthermore, such software is able to consider countermeasures; fence de-sign and location efficiencies can be estimated before their setup (Agliardi et al., 2009) to optimize them. However, it requires many inputs (such as rolling frictional angles, nor-mal and tangential restitution coefficients) that have to be es-timated and spatially distributed for all surface types of the study area, depending on landuses as well as superficial and bedrock geologies. Therefore, for studies at regional scale, it involves more time to acquire differentiated input parameters and compute runout than the Flow-R model.
4.4 Influences of the cell size DEM
The DEM resolution influences rockfall source detections: a coarse DEM tends to smooth high slope angle values. As stated in Loye et al. (2009), it implies that the higher res-olution of the DEM, the smaller the potential source areas detected are. Furthermore, the coarser the DEM, the lower
the apparent slope angle of a vertical cliff is. For exam-ple, a 10 m vertical cliff has an apparent slope angle of 83◦ on a 2 m DEM instead of 55◦on a 10 m DEM (Loye et al., 2009). As threshold angles which are used to identify block release susceptibilities (namelymss,mcandσ) are extracted from slope maps, their values directly depend on the DEM cell size. Thus, for the same detected cliff, the coarser the DEM, the lower these threshold angles of cliff detection are (Fig. 11a, b). It means that the influence of the DEM cell size is implicitly taken into account during the SAD approach and no corrections have to be added. Fig. 11c illustrates a lime-stone cliff with an apparent slope angle of 59◦ on a 25 m DEM and 73◦on a 2 m DEM having the same susceptibility of 0.9, regardless of the DEM cell size used during the SAD approach.
4.5 Hazard calibration
When it comes to converting rockfall susceptibilities into hazard (i.e. number of blocks per year per cell), the lo-cation of the calibration section associated to an inventory has a strong importance. Ideally, the section should be lo-cated along a non-forested slope without remediation sys-tems. Therefore, if the calibration section is located along forested slopes, the final hazard would be underestimated along a non-forested adjacent slope because of a biased num-ber of events due to blocks deviated or stopped by trees or anthropogenic countermeasures.
However, due to practical issues, the calibration step has to be achieved with inventories that are available (when they are), even if they are not always performed along optimum road sections. Nevertheless, a preliminary method to cali-brate hazard is proposed and is still in progress; enhanced approaches will have to be developed in future work. Up to now, at least one section is needed to perform this calibration, but multiple road sections could also be used. Moreover, in-troducing two adjustment factors to take into account during the calibration step (i.e. Eq. 8) – (1) classical censoring ef-fects inside inventories (Hungr et al., 1999) and (2) rockfall-forest interactions along rockfall-forested slopes based on statistical studies (Dorren et al., 2005) – would be the first example of future evolution that could improve the reliability of the hazard calibration.
5 Conclusions
The improved approach of the Slope Angle Distribution and the Flow-R software were introduced and carried out along roads of the Val de Bagnes to assess the risk induced by frag-mental rockfall to vehicle traffic. Linking the normal distri-butions of cliffs units with normalized cumulative functions, rockfall onset areas can be identified with rock-mass-failure susceptibility. Indeed, these indexes can be achieved at re-gional scale according to slope angle values inside
homo-geneous morphometric areas thanks to the enhanced SAD procedure. Then Flow-R software provides the relative fre-quencies of block propagations, using several approaches and susceptibilities of source areas. Thanks to these results, i.e. rock-mass-failure susceptibilities and relative frequencies of propagations, hazard maps can be achieved and calibrated with an inventoried number of events along a road section.
Even if the obtained quantitative risk assessment is an ap-proximation, this improved approach allows us to deal at low cost with real hazard maps at a regional scale, requiring only few documents, namely a DEM and a geological map (if available). So this approach is indicated for regions which cannot afford systematical detailed assessments of the risk due to rockfalls; thus hotspots can be identified in order to prioritize sections on which detailed investigation and miti-gation measures will be the most efficient.
Histofit and Flow-R software packages are available on re-quest at www.flow-r.org.
Acknowledgements. The present work has been partially supported
by the project SafeLand “Living with landslide risk in Europe: As-sessment, effects of global change, and risk management strategies” (7th Framework Programme of the European Commission, Grant Agreement No. 226479). This support is gratefully acknowledged. The authors would like to thank the Bagnes municipality and its security service for allowing us to publish maps and results and for the useful discussions that allowed us to validate the models. Moreover, three reviewers helped us to significantly improve the present document thanks to pertinent remarks and suggestions. Finally, the authors appreciated the continuing questioning of Lucie Fournier and the support of Marc Choffet around chocolate breaks.
Edited by: P. Reichenbach
Reviewed by: A. Preh and two other anonymous referees
References
Agliardi, F., Crosta, G. B., and Frattini, P.: Integrating rock-fall risk assessment and countermeasure design by 3D mod-elling techniques, Nat. Hazards Earth Syst. Sci., 9, 1059–1073, doi:10.5194/nhess-9-1059-2009, 2009.
Baillifard, F., Jaboyedoff, M., and Sartori, M.: Rockfall hazard mapping along a mountainous road in Switzerland using a GIS-based parameter rating approach, Nat. Hazards Earth Syst. Sci., 3, 435–442, doi:10.5194/nhess-3-435-2003, 2003.
Bieniawski, Z. T.: Rock mass classification in rock engineering, in: Proceeding of the Symposium on Exploration for Rock En-gineering, 1, edited by: Bieniawski, Z. T., Johannesburg, South Africa, 1–5 November 1976, 97–106, 1976.
Blahut, J., Horton, P., Sterlacchini, S., and Jaboyedoff, M.: De-bris flow hazard modelling on medium scale: Valtellina di Tirano, Italy, Nat. Hazards Earth Syst. Sci., 10, 2379–2390, doi:10.5194/nhess-10-2379-2010, 2010.
Budetta, P.: Assessment of rockfall risk along roads, Nat. Hazards Earth Syst. Sci., 4, 71–81, doi:10.5194/nhess-4-71-2004, 2004. Cajos, J., Trocm´e-Maillard, M., Huber, M., Arnold, P., Vollmer, U.,
Sandri, A., Raetzo, H. Dorren, L., Egli, T., Eberli, J., Knuchel,
R., Kienholz, H., Donzel, M., Utelli, H. H., and Perren, B.: Risk concept for natural hazards on national roads, Federal Roads Of-fice, 108 pp., available at http://www.astra.admin.ch/, 2009. CarPostal: http://www.carpostal.ch/, last access: 3 December 2010,
2010.
Cascini, L.: Applicability of landslide susceptibility and hazard zoning at different scales, Eng. Geol., 102, 164–177, 2008. Corominas, J. and Moya, J.: A review of assessing landslide
fre-quency for hazard zoning purposes, Eng. Geol., 102, 193–213, 2008.
Corominas, J., Copons, R., Moya, J., Vilaplana, J., Altimir, J., and Amig´o, J.: Quantitative assessment of the residual risk in a rock-fall protected area, Landslides, 2, 343–357, 2005.
Crosta, G. B. and Agliardi, F.: A methodology for physically based rockfall hazard assessment, Nat. Hazards Earth Syst. Sci., 3, 407–422, doi:10.5194/nhess-3-407-2003, 2003.
Crosta, G. B., Agliardi, F., Frattini, P., and Imposimato, S.: A three-dimensional hybrid numerical model for rockfall simula-tion, Geophys. Res. Abstr., 6, 04502, 2004.
Derron, M.-H., Jaboyedoff, M., and Blikra, L. H.: Preliminary as-sessment of rockslide and rockfall hazards using a DEM (Opp-stadhornet, Norway), Nat. Hazards Earth Syst. Sci., 5, 285–292, doi:10.5194/nhess-5-285-2005, 2005.
Dorren, L. K. A.: A review of rockfall mechanics and modelling approaches, Prog. Phys. Geogr., 27, 69–87, 2003.
Dorren, L. K. A.: Rockyfor3D (v4.0) revealed – Transparent de-scription of the complete 3D rockfall model, ecorisQ paper, 28 pp., 2011.
Dorren, L. K. A. and Seijmonsbergen, A. C.: Comparison of the three GIS-based models for predicting rockfall runout zones at a regional scale, Geomorphology, 56, 49–64, 2003.
Dorren, L. K. A., Berger, F., le Hir, C., Mermin, E., and Tardif, P.: Mechanisms, effects and management implications of rockfall in forests, Forest Ecol. Manag., 215, 183–195, 2005.
Fairfield, J. and Leymarie, P.: Drainage Networks from Grid Digital Elevation Models, Water Resour. Res., 27, 709–717, 1991. Fell, R., Ho, K. K. S., Lacasse, S., and Leroi, E.: A framework for
landslide risk assessment and management, in: Landslide Risk Management, edited by: Hungr, O., Fell, R., Couture, R., and Eberhardt, E., Proceedings of the International Conference on Landslide Risk Management in Vancouver, Canada, 31 May – 3 June 2005, 3–25, 2005.
Fell, R., Corominas, J., Bonnard, C., Cascini, L., Leroi, E., and Sav-age, W. Z.: On behalf of the JTC-1 Joint Technical Committee on Landslides and Engineered Slopes: Guidelines for Landslide Susceptibility, Hazard and Risk Zoning for Land Use Planning, Eng. Geol., 102, 85–98, 2008.
Frattini, P., Crosta, G., Carrara, A., and Agliardi, F.: Assessment of rockfall susceptibility by integrating statistical and physically-based approaches, Geomorphology, 94, 419–437, 2008. Gamma, P.: Dfwalk - Ein Murgang-Simulationsprogramm zur
Gefahrenzonierung, Geographisches Institut der Universit¨at Bern, Switzerland, 158 pp., 2000.
Gilbert, G. K.: Geology of the Henry Mountains, US Geological and Geographical Survey of the Rocky Mountain Region, Gov-ernment Printing O/ce, Washington, DC, 1877.
Gokceoglu, C., Sonmez, H., and Ercanoglu, M.: Discontinuity con-trolled probabilistic slope failure risk maps of the Altindag (set-tlement) region in Turkey, Eng. Geol., 55, 277–296, 2000.
G¨unther, A.: SLOPEMAP: programs for automated mapping of geometrical and kinematical properties of hard rock hill slopes, Comput. Geosci., 29, 865-875, 2003.
G¨unther, A., Carstensen, A., and Pohl, W.: Automated sliding sus-ceptibility mapping of rock slopes, Nat. Hazards Earth Syst. Sci., 4, 95–102, doi:10.5194/nhess-4-95-2004, 2004.
Guzzetti, F., Reichenbach, P., and Wieczorek, G. F.: Rockfall haz-ard and risk assessment in the Yosemite Valley, California, USA, Nat. Hazards Earth Syst. Sci., 3, 491–503, doi:10.5194/nhess-3-491-2003, 2003.
Heim, A.: Bergsturz und Menschenleben, Fretz and Wasmuth Ver-lag, Zurich, 218 pp., 1932.
Hoek, E. and Bray, J. W.: Rock Slope Engineering, 3rd edition, Institution of Mining and Metallurgy, London, 1981.
Hoek, E., Marinos, P., and Benissi, M.: Applicability of the Ge-ological Strength Index (GSI) classification for very weak and sheared rock masses. The case of the Athens Schist Formation, Bull. Eng. Geol. Environ., 57, 151–160, 1998.
Holmgren, P.: Multiple flow direction algorithms for runoff mod-eling in grid based elevation models: an empirical evaluation, Hydrol. Process., 8, 327–334, 1994.
Horton, P., Jaboyedoff, M., and Bardou, E.: Debris flow susceptibil-ity at a regional scale, 4th Canadian Conference on Geohazards, Universit´e Laval, Quebec, Canada, 20–24 May 2008, 8 pp., 2008. Hungr., O., Evans, S. G., and Hazzard, J.: Magnitude and frequency of rock falls and rock slides along the main transportation cor-ridors of southwestern British Columbia, Can. Geotech. J., 36, 227–238, 1999.
Jaboyedoff, M. and Derron, M.-H.: Integrated risk assessment pro-cess for landslides, in: Landslide risk management, edited by Hungr, O., Fell, R., Couture, R. and Eberhardt, E., 776, Taylor and Francis, 2005.
Jaboyedoff, M. and Labiouse, V.: Preliminary assessment of rock-fall hazard based on GIS data, in: Proceedings of the 10th Inter-national Congress on Rock Mechanics ISRM 2003 – Technology roadmap for rock mechanics, South African Institute of Mining and Metallurgy, Johannesburg, South Africa, 8–12 September 2003, 575–778, 2003.
Jaboyedoff, M. and Labiouse, V.: Technical Note: Preliminary es-timation of rockfall runout zones, Nat. Hazards Earth Syst. Sci., 11, 819–828, doi:10.5194/nhess-11-819-2011, 2011.
Jaboyedoff, M., Baillifard, F. J., Marro, C., Philippossian, F., and Rouiller, J. D.: Detection of rock instabilities: Matte-rock Methodology, Joint Japan-Swiss Scientific on Impact Load by Rock Falls and Design of Protection Structures, Kanazawa, Japan, 4–7 October 1999, 37–43, 1999.
Jaboyedoff, M., Dudt, J. P., and Labiouse, V.: An attempt to refine rockfall hazard zoning based on the kinetic energy, frequency and fragmentation degree, Nat. Hazards Earth Syst. Sci., 5, 621–632, doi:10.5194/nhess-5-621-2005, 2005.
Jaboyedoff, M., Oppikofer, T., Abell´an, A., Derron, M.-H., Loye, A., Metzger, R. and Pedrazzini, A.: Use of LIDAR in landslide investigations: a review, Nat. Hazards, Springer Netherland, 61, 5–28, doi:10.1007/s11069-010-9634-22012a.
Jaboyedoff, M., Choffet, M., Derron, M.-H., Horton, P., Loye, A., Longchamp, C., Mazotti, B., Michoud, C., and Pedrazzini, A.: Preliminary slope mass movements susceptibility mapping us-ing DEM and LiDAR DEM, in: Terrigenous Mass Mouvements, edited by: Pradhan, B., and Buchroithner, Springer-Verlag Berlin
Heidelberg, 64 pp., in press, 2012b.
Jenson, S. K. and Domingue, J. O.: Extracting topographic struc-ture from digital elevation data for geographic information sys-tem analysis, Photogramm. Eng. Remote Sens., 54, 1593–1600, 1988.
Kappes, M. S., Malet, J.-P., Rematre, A., Horton, P., Jaboyedoff, M., and Bell, R.: Assessment of debris-flow susceptibility at medium-scale in the Barcelonnette Basin, France, Nat. Hazards Earth Syst. Sci., 11, 627–641, doi:10.5194/nhess-11-627-2011, 2011.
Kreyszig, E.: Advanced Engineering Mathematics, 9th edition, John Wiley and Sons, 1248 pp., 2006.
Leroi, E.: Landslides hazard – risk maps at different scales: ob-jectives, tools and developments, in: Proceedings of the 7th Int. Symp. on Landslides, Trondheim, Norway, 1, 35–51, 1996. Locat, J., Leroueil, S., and Picarelli, L.: Some considerations on
the role of geological history on slope stability and estimation of minimum apparent cohesion of a rock mass, in: Landslides in research, theory and practice, edited by: Bromhead, E., Dixon, N., and Ibsen, M. L., The 8th International Symposium on Land-slides in Cardiff, Wales, 26–30 June 2000, 935–942, 2000. Loye, A., Jaboyedoff, M., and Pedrazzini, A.: Identification of
po-tential rockfall source areas at a regional scale using a DEM-based geomorphometric analysis, Nat. Hazards Earth Syst. Sci., 9, 1643–1653, doi:10.5194/nhess-9-1643-2009, 2009.
Michoud, C., Mazotti, B., Choffet, M., Dubois, J., Breguet, A., M´etraux, V., and Jaboyedoff, M.: Advanced Susceptibility Map-ping for Natural Hazards at a Local Scale – The Case of the Swiss Alpine Valley of Bagnes, EGU General Assembly, Vienna, Aus-tria, 3–7 May 2010, EGU2010-4606, 2010.
Montgomery, D. R. and Brandon, M. T.: Topographic controls on erosion rates in tectonically active mountain ranges, Earth Planet. Sci. Lett., 201, 481–489, 2002.
O’Callaghan, J. F. and Mark, D. M.: The extraction of drainage networks from digital elevation data, Comput. Vision Graphics Image Process., 28, 328–344, 1984.
Oppikofer, T., Jaboyedoff, M., and Coe, J. A.: Rockfall hazard at Little Mill Campground, Uinta National Forest: Part 2. DEM analysis, in: First North American Landslide Conference – Land-slides and Society: Integrated Science, Engineering, Manage-ment, and Mitigation, Vail, USA, 3–8 June 2007, 1351–1361, 2007.
Pierson, L. A., David, S. A., and Van Vickle, R.: Rockfall Hazard Rating System Implementation Manual, Oregon, 1990. Piteau, D. R. and Peckover, F. L.: Engineering of Rock Slope,
in: Landslides, Analysis and Control, Transportation Research Board, in: Special Report 176, edited by: Schuster, R. L. and Krizek, R. J., Washington, DC, 192–228, 1978.
Powell, J. W.: Report on the Geology of the Eastern Portion of the Uinta Mountains and a Region of Country Adjacent Thereto, US Geological and Geographical Survey of the Territories, Govern-ment Printing O/ce, Washington, DC, 1876.
Ritchie, A. M.: Evaluation of rockfall and its control, in: High-way Research Record, 17, HighHigh-way Research Board, National Research Council, Washington, DC, 13–28, 1963.
Rouiller, J.-D., Jaboyedoff, M., Marro, C., Philippossian, F., and Mamin, M.: Pentes instables dans le Pennique Valaisan. MAT-TEROCK: une m´ethodologie d’auscultation des falaises et de detection des ´eboulements majeurs potentiels, Rapport final du PNR31, VDF Hochschulverlag AG, ETH Z¨urich, Switzerland, 1998.
Sartori, M., Gouffon, Y., and Marthaler, M.: Harmonisation et d´efinition des unit´es lithostratigraphiques brianc¸onnaises dans les nappes penniques du Valais, Eclogae Geol. Helv., 99, 363– 407, 2006.
Selby, M. J.: Controls on the stability and inclinations of hillslopes formed on hard rock, Earth Surf. Proc. Land., 7, 449–467, 1982. SRCE (Daily Traffic during 2007, by the Roads and Rivers Office of the Canton of Valais): http://mapserver-srce.kiperti.com/srce/ carte.html, last access: 3 December 2010, 2009.
Strahler, A. N.: Equilibrium theory of erosional slopes approached by frequency distribution analysis, Am. J. Sci., 248, 673–696, 800–814, 1950.
Strahler, A. N.: Quantitative geomorphology of erosional land-scapes, Compt. Rend, 19th Intern. Geol. Cong., Sec. 13, 341– 354, 1954.
Terzaghi, K.: Mechanism of Landslides, The Geological Society of America, Eng. Geol. (Berkley), 83–123, 1950.
Terzaghi, K.: Stability of Steep Slopes on Hard Unweathered Rock, G´eotechnique, 12, 251–270, 1962.
Toppe, R.: Terrain models – a tool for natural hazard mapping, IAHS, 162, 629–638, 1987.
Tr¨umpy, R.: Geology of Switzerland – A Guide Book, Part A: An Outline of the Geology of Switzerland, Wepf & Co, Basel, 104 pp., 1980.
Van Dijke, J. J. and Van Westen, C. J.: Rockfall hazard: a geomor-phological application of neighbourhood analysis with ILWIS, ITC Journal, 1, 40–44, 1990.
Volkwein, A., Schellenberg, K., Labiouse, V., Agliardi, F., Berger, F., Bourrier, F., Dorren, L. K. A., Gerber, W., and Jaboyed-off, M.: Rockfall characterisation and structural protection – a review, Nat. Hazards Earth Syst. Sci., 11, 2617–2651, doi:10.5194/nhess-11-2617-2011, 2011.
Wagner, A., Leite, E., and Olivier, R.: Rock and debris-slides risk mapping in Nepal – A user-friendly PC system for risk map-ping, in: Proceedings of the fifth international symposium on landslides, Lausanne, Switzerland, 10–15 July 1988, 1251–1258, 1988.
Whalley, W. B.: Rockfalls, in: Slope Instability, edited by: Bruns-den, D. and Prior, D. B., Wiley, Chichester, 217–256, 1984. Wyllie, D. C. and Mah, C. W.: Rock Slope Engineering, Civil and
Mining, 4th Edition, Taylor & Francis, London and New-York, 2004.