Implementing A Business Intelligence
(BI)/Corporate Performance Management
(CPM) Solution: Challenges Faced
By A Major National Retailer
Andrew D. Schiff, Towson University, USA Mark T. Warren, Stevenson University, USA
ABSTRACT1
Based on actual events, this case is concerned with the practical and managerial challenges associated with analyzing, designing and implementing a Business Intelligence (BI) / Corporate Performance Management (CPM)information technology solution in a large national retailer. Secondary issues examined include strategy, project management and conflict resolution. This case is appropriate for upper-level undergraduate and masters-level graduate courses in information technology, accounting information systems and project management. It is designed to be taught in about one class hour, and requires four to six hours of outside preparation by students.
Keywords: Business Intelligence; BI; Corporate Performance Management; CPM; Information Technology; IT; Systems Analysis; Oracle; Accounting Information Systems; AIS; Project Management
INTRODUCTION
large national retailer is seeking to increase shareholder value by driving top line revenue at higher margins. They have their vision set; however, they recognize that they do not have the proper tools to measure their effectiveness in achieving their vision for the future. Looking at their existing environment, they believe that they need a dynamic planning and reporting environment which allows them to analyze / trend historic data, establish meaningful targets at a cost center or store level, establish incentive based compensation for key personnel to drive the proper behaviors, and produce budget-versus-actual reporting to measure organizational results.
Though key stakeholders shared this same vision, there was disagreement between the Chief Financial Officer (CFO) and the Chief Information Officer (CIO) on how to proceed with establishing this dynamic reporting environment. The CFO wanted to look at new reporting tools that would provide his financial staff with “on demand” reporting. The CIO wanted to leverage existing tools and have his team provide query-based reports for the finance team.
During this time, a major investment organization acquired this retailer adding a dire sense of urgency to the initiative. Nonetheless, the key question remained unchanged: What tools would be used, and whose vision would prevail?
ORGANIZATIONAL BACKGROUND
Type of Business
The organization selected for this case is a national retailer offering a wide variety of goods at nearly 400 physical locations across the United States. This organization was founded in 1924 and has grown its product line through strategic acquisitions. This organization focuses on providing the consumer with value by offering high quality, name brand goods at prices that are roughly 60% of other department stores.
1 © 2016 by Andrew Schiff. All Rights reserved.
Products / Services Provided
This retailer is focused on selling the following goods: coats and outerwear for the entire family; ladies’ dresses and suits; ladies’ career and casual collections and separates; lingerie and accessories; men’s clothing and furnishings; men’s sportswear and activewear; children’s clothing, newborn to pre-teen; Shoes for the entire family; and everything you would want and need for baby; linens and home décor.
Management Structure
This retailer was founded as a small family business and grew through strategic acquisition going public in 1983. Within the last year, this retailer had been purchased and taken private by a large global investment firm in a transaction exceeding $2.1 billion or $45.50 per share in cash. This retailer employs roughly 28,000 full-time and part-time employees and is organized by the following regions and states:
Northeastern States - CT, ME, MA, NH, NY, RI Mid-Atlantic States - DE, MD, NJ, PA
Southeastern States - AL, FL, GA, KY, NC, SC, TN, VA Midwest States - IL, IN, IA, MI, MN, NE, ND, OH, WI South-Central States - AR, KS, LA, MO, MS, OK, TX Western States - AZ, CA, CO, NV, NM, UT
Northwestern States - AK, ID, OR, WA
Financial Status
Net sales from continuing operations for a recent twelve months were $3.403 billion compared with $3.439 billion for the previous twelve month period, a 1.0% decrease. These results reflected a 2.2% comparative store sales decrease for the twelve-month period. Net income is approximately 3% of sales, which is somewhat below average for apparel retailers in general. During this twelve month period, the company opened nineteen stores. Two stores were relocated during the twelve month period to locations within the same trading markets, and three stores were closed.
Strategic Planning
The organization’s strategic plan revolved around their penetration into new markets through the opening of new stores in new (or mature) geographies; the introduction of new product lines; and, the constant reduction of costs across the organization. Specifically, the organization’s five-year strategy was to maximize EBITDA (Earnings Before Interest, Taxes, Depreciation And Amortization) and to reduce its debt. Specific EBITDA drivers included:
1. Increasing gross sales 2. Increasing gross margin
3. Reducing payroll as a percent of sales 4. Reducing advertising as a percent of sales 5. Reducing shrinkage
6. Maximizing capital investments
From an operations perspective, the organization also felt it critical to focus on the following:
1. Increasing inventory turns 2. Decreasing inventory aging
3. Increasing payables as a percent of inventory (to maximize cash on hand) 4. Reducing liabilities as a percent of assets
5. Increasing number of stores / geographic areas served
organization never provided cash or credit refunds for returned goods – only exchanges were permitted}. The organization felt that offering cash and credit refunds for returned items would expand their customer base at both existing and new stores.
Organizational Culture
This organization prided itself on keeping its costs down and its value up through promoting an entrepreneurial spirit among its employees. The executive suite delegated a great deal of power to their merchandisers / buyers and provided incentive based compensation on the specific performance of their product lines based upon the “sell” side of the profitability equation. Empowering the merchandisers / buyers in this fashion enabled them to be opportunistic when good deals presented themselves. While there was tremendous visibility to the “sell” side of the equation, there was little visibility into the fully loaded profit or loss effect of each of the different product lines and individual items. While sales were strong, the consolidated bottom line was actually stagnant or eroding.
Economic Climate
Competition was extremely aggressive. Competitors were focused on strategic acquisitions to expand their product line while driving costs out of the core business. Many organizations were the targets of both friendly and hostile takeover attempts. Shareholders were looking to grow their investment through the appreciation of the stock price. Satisfying stakeholder demands were becoming increasingly difficult.
Current Challenges and Problems Facing the Organization
The primary issues facing this organization were the availability and timing of accurate data. Due to the lack of timely and accurate information, the organization was taking roughly 30 days to complete a soft close of its books each month (hard closes were not completed until year end). There were many offline calculations used to record closing entries. Variance analysis (and the specific variance drivers) were extremely difficult to complete / ascertain. In addition, due to the lack of detailed managerial and financial reporting, the organization’s annual and five year financial plan were completed at an extremely high level, resulting in a lack of ownership at a divisional or cost center basis.
Outlined below (Table 1) is this organizations SWOT Analysis (Strengths, Weaknesses, Opportunities, and Threats).
Table 1. Strengths, Weaknesses, Opportunities and Threats
Strengths Weaknesses
Strong Retail Network in the US Geographical Concentration Wide Product Portfolio
Opportunities Threats
Expanding Store Network Counterfeit Goods Positive Outlook for Internet Shopping Industry Consolidation Lifting of Import Quota by WTO Rising Energy Costs
To continue to be competitive and grow its market share, this organization needed the ability to capture, track and report those key performance indicators that would allow them to set the proper strategic goals. To accomplish this, the organization decided to establish a Business Intelligence / Corporate Performance Management (BI/CPM) solution which would integrate with its existing application environment.
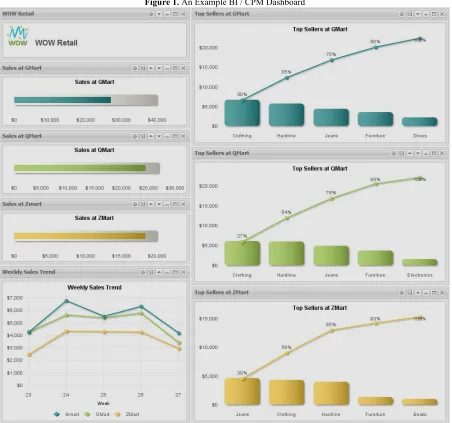
Corporate Performance Management (CPM) applications and software tools are designed to measure and help manage a business. CPM may examine financial, customer relationship management, supply chain management and other business processes. Typical performance measures generated by CPM analyze revenue, inventory turnover, return on investment (ROI), budgeted versus actual performance, etc. A common format for the output of BI and CPM applications is a “dashboard” showing key performance metrics. An example is shown in Figure 1. (Note: Due to confidentiality constraints this is a sample dashboard and does not show figures from the organization described herein.)
The organization understood the critical relationship between the BI / CPM environments and focused on establishing a control oriented infrastructure (CPM) to support the reporting (BI) environment. It was quickly determined that this was no small undertaking, and the organization engaged the services of an external consultant to help with establishing the technical and financial feasibility of such an environment, as well as supporting the selection of a BI/CPM tool that would meet its organizational reporting needs.
Figure 1. An Example BI / CPM Dashboard
To do this, the organization leveraged a structured methodology for completing this software selection to include:
1. Requirements gathering / defining the organizations detailed requirements 2. Conducting extensive industry research on commercially available tools 3. Conducting vendor functional and technical demonstrations
4. Completing cross-functional software vendor scoring by the project team 5. Reviewing / assessing vendor responses to identified weaknesses 6. Conducting software vendor pricing negotiations
7. Preparing both a detailed and executive level synopsis of the aforementioned analysis to include an application recommendation
Technology Concerns
The majority of the organization’s technology concerns revolved around their distributed applications and the ability to build meaningful data relationships across these applications. Specific concerns were as follows:
1. Is the data available to support the development of a data warehouse from which key financial and managerial reports can be created?
2. Are there gaps in historic data that would prevent year-to-year analytical reporting?
3. Are there functional processes / controls in place to ensure data consistency on an ongoing basis?
4. Are there primary / foreign key linkages available across databases with which to build meaningful relationships?
5. Will the new BI / CPM tool be able to inter-operate with the many applications supported by the client? 6. Will the client’s Information Technology team possess the requisite skills to support the new BI / CPM
tool?
7. Will the infrastructure cost to support the BI / CPM tool be cost-prohibitive?
Technology Components
The organization’s technology environment includes many core components which are updated in a batch environment. There are four main applications that drive 95% of the organization’s reporting: Oracle Financials and three separate inventory / stock ledgers, showing the quantities and amounts of merchandise on hand in different locations. In addition, there are numerous Excel-based spreadsheets that track statistical data used for allocations and reporting. These value-added components will need to be incorporated into the final BI / CPM solution.
Technology Resources and Constraints
The CIO organization was currently understaffed and had a list of more than 100 information technology related initiatives on its “to do” list. The individuals supporting the CIO organization were skilled in Oracle database, Oracle Financials, Oracle Application Server, Oracle Internet Directory, Oracle Discoverer and Desktop. In addition, they currently support the BEA WebLogic application server and the MySQL database.
The organization used SuSE Linux as their operating system of choice and currently supported various generations of MS Windows, Red Hat Linux and Solaris. The standard desktop for stores and distribution centers is Linux with Star Office and Firefox browser. The standard corporate desktop is MS Windows with MS Office and Internet Explorer.
One main constraint is that no one in the CIO’s organization had specific experience with BI / CPM, and Online Analytical Processing (OLAP) tools. Due to their lack of experience with establishing BI / CPM environments, these individuals only felt comfortable with their existing Oracle-based tools.
Conflicting Approaches
the position that since they were an “Oracle” shop, they should leverage Oracle’s Discoverer product and not pursue other application solutions. The CIO felt that his team was in a position to support the Oracle Discoverer Reporting tool and provide the needed reporting to the organization. The CFO felt that the CIO would be limiting his access to valuable data as the CIO was not staffed (did not possess the relevant skillset) to provide the CFO with “On Demand” reporting capabilities. It was evident that both sides felt that there was power in owning access to the data.
Sarbanes-Oxley (SOX) Compliance
Compliance with the Sarbanes-Oxley Act of 2002 (SOX) was an additional consideration for this organization. One of the major requirements of SOX is existence of adequate internal controls to ensure the accuracy of all transactions from initial data entry through subsequent processing and reporting. The legacy reporting tools were in compliance with SOX guidelinesand the new reporting solution would need to be in compliance as well.
A Change in Ownership
In the middle of these events, a venture capital firm purchased this organization. This created a profound sense of uncertainty about the future. All of the senior “C” level executives were concerned for their jobs and focused on more immediate reporting needs rather than establishing a long term scalable BI / CPM solution. As their concerns about job security escalated, there was a shift in priorities; rather than focusing on establishing Key Performance Indicator (KPI) reporting that would drive profitability, they were focused on reporting that provided greater visibility into the past (the venture capital firm was asking for a great deal of historical reporting at a detailed level). This shift in strategy resulted in the CFO / CIO accelerating the BI / CPM tool selection and implementation initiative in order to meet the venture capital firm’s requirement for detailed historic reporting.
The CFO, understanding the limited bandwidth of the CIO’s team, decided to engage the services of an outside consultant to complete the BI / CPM environment assessment.
AUTHOR BIOGRAPHIES
Andrew Schiff is a Professor in the Department of Accounting at Towson University, specializing in accounting information systems. He holds a Ph.D. From Rutgers University, an M.S. in Accounting from the State University of New York at Albany, and is a Certified Public Accountant.
Mark Warren is Director of Business Consulting at Gorfine, Schiller & Gardyn, P.A. in Maryland, and has over 25 years of business process optimization, systems analysis, design and implementation experience. He is also an Adjunct Professor in the School of Graduate and Professional Studies at Stevenson University, and holds an M.S. in Accounting and Business Advisory Services from Towson University.
REFERENCES
Biere, M. (2010). The new era of enterprise business intelligence: Using analytics to achieve a global competitive advantage. Boston, MA: Pearson Education, Inc.
deVera, D. (2012). Business intelligence blog: Big data in retail. Retrieved July 8th, 2016 from http://www.arcplan.com/en/blog/2012/01/
Frost, B. (2000). Measuring performance: Using the new metrics to deploy strategy and improve performance. Dallas, TX: Measurement International.
Howson, C. (2014). Successful business intelligence, 2nd edition: Unlock the value of BI & big data. New York, NY: McGraw-Hill Education.
Magal, S., &Word J. (2012). Integrated business processes with ERP systems. Hoboken, NJ: John Wiley & Sons. Martin, M. (2005). Integrated systems: The accountant in the 21st century. Boston, MA: Pearson Custom Publishing. Retail Example Dashboard (2012, October). Retrieved June 30th, 2014 from
http://www.visualmining.com/wp-content/uploads/2012/10/Retail-Example-Dashboard.jpg
Rouse, M. (2006). Business intelligence (BI). Retrieved June 30th, 2014 from
http://searchdatamanagement.techtarget.com/definition/business-intelligence Rouse, M. (2011). Corporate performance management (CPM). Retrieved July 2nd, 2014 from
INSTRUCTORS’ NOTES
ABSTRACT
Based on actual events, this case is concerned with the practical and managerial challenges associated with analyzing, designing and implementing a Business Intelligence (BI) / Corporate Performance Management (CPM)information technology solution in a large national retailer. Secondary issues examined include strategy, project management and conflict resolution. This case is appropriate for upper-level undergraduates and masters-level graduate students. It is designed to be taught in about one class hour, and requires four to six hours of outside preparation by students.
CASE SYNOPSIS
A large national retailer is seeking to increase shareholder value by driving top line revenue at higher margins. They have their vision set; however, they recognize that they do not have the proper tools to measure their effectiveness in achieving their vision for the future. Looking at their existing environment, they believe that they need a dynamic planning and reporting environment which allows them to analyze / trend historic data, establish meaningful targets at a cost center or store level, establish incentive based compensation for key personnel to drive the proper behaviors, and produce budget-versus-actual reporting to measure organizational results.
Though key stakeholders shared this same vision, there was disagreement between the Chief Financial Officer (CFO) and the Chief Information Officer (CIO) on how to proceed with establishing this dynamic reporting environment. The CFO wanted to look at new reporting tools that would provide his financial staff with “on demand” reporting. The CIO wanted to leverage existing tools and have his team provide query-based reports for the finance team.
During this time, a major investment organization acquired this retailer adding a dire sense of urgency to the initiative. Nonetheless, the key question remained unchanged: What tools would be used, and whose vision would prevail?
Recommendations for Teaching Approaches
This real-world case contains many realistic details to engage students in the core issue, which is the conflict between two senior executives with differing approaches implementing a Business Intelligence / Corporate Performance Management technology solution. The questions below will guide students through the main phases of case analysis: understanding the situation, identifying and analyzing the alternatives, and reaching a conclusion.
This case may be used as a written assignment, or as basis for in-class discussion. Alternatively, the case may be assigned to groups of students, who then present their answers to selected questions in class. Another option would be to have one group of students answer the questions, and have a second group of students critique their responses either in class or in writing. A thorough understanding of the case will be necessary to perform either function. For students seeking a further understanding of Business Intelligence and Corporate Performance Management applications, selected references are presented below.
Questions and Answers
1) What are the key success factors for this organization? Why? What are the key drivers of profitability?
The organization’s strategic plan revolved around their penetration into new markets through the opening of new stores in new (or mature) geographies; the introduction of new product lines; and, the constant reduction of costs across the organization. This was necessary because competition was extremely aggressive. Competitors are focused on strategic acquisitions to expand their product line while driving costs out of the core business.
From an operations perspective, the organization also felt it critical to focus on increasing inventory turns; decreasing inventory aging; managing payables to maximize cash on hand; reducing liabilities as a percent of assets; and increasing number of stores / geographic areas served.
2) What are some of the challenges faced by this organization in gathering information pertaining to its profitability?
Due to the lack of timely and accurate information, the organization was taking roughly 30 days to complete a soft close of its books each month (hard closes were not completed until year end). There were many offline calculations used to record closing entries. Variance analysis (and the specific variance drivers) were extremely difficult to complete / ascertain. In addition, due to the lack of detailed managerial and financial reporting, the organization’s annual and five year financial plan were completed at an extremely high level, resulting in a lack of ownership at a divisional or cost center basis.
3) What does the organization believe is essential to be competitive and to increase its market share?
To continue to be competitive and grow its market share, this organization needed the ability to capture, track and report those key performance indicators that would allow them to set the proper strategic goals. To accomplish this, the organization decided to establish a Business Intelligence / Corporate Performance Management (BI/CPM) solution which would integrate with its existing application environment.
4) What are the objectives of Business Intelligence and Corporate Performance Management applications? How do they work?
A Business Intelligence (BI) application provides a comprehensive view of the business that enables decision-makers to access the latest information about financial performance, customer and product activity in a clean, consistent and easy- to-use interface. The goal of BI is to provide predictive, forward-looking information about key performance drivers. Examples might be leading indicators of sales growth; changes in the mix of bottom, middle and top-tier customers; price elasticity by item, etc. BI uses tools such as statistical analysis, forecasting and data mining to achieve this goal. BI applications usually consolidate information that had previously been produced using separate spreadsheets and other programs.
Corporate Performance Management (CPM) applications and software tools are designed to measure and help manage a business. CPM may examine financial, customer relationship management, supply chain management and other business processes. Typical performance measures generated by CPM analyze revenue, inventory turnover, return on investment (ROI), budgeted versus actual performance, etc. A common format for the output of BI and CPM applications is a “dashboard” showing key performance metrics. An example is shown in Figure 1. (Note: Due to confidentiality constraints this is a sample dashboard and does not show figures from the organization described herein.)
5) What is the structured methodology for software selection? How was that methodology applied in this organization?
Structured methodology is often referred to the Structured Systems Analysis and Design Method (SSADM). Originally released in the 1980s, it is a formal, step-by-step approach to systems development. The organization adapted the structured methodology for completing this software selection to include the following activities:
1. Requirements gathering / defining the organization’s detailed requirements 2. Conducting extensive industry research on commercially available tools 3. Conducting vendor functional and technical demonstrations
4. Completing cross-functional software vendor scoring by the project team 5. Reviewing / assessing vendor responses to identified weaknesses 6. Conducting software vendor pricing negotiations
6) List and explain the technology concerns faced by this organization.
As stated in the case, the majority of the organization’s technology concerns revolved around their distributed applications and the ability to build meaningful data relationships across these applications. Specific concerns were as follows:
1. Is the data available to support the development of a data warehouse from which key financial and managerial reports can be created?
2. Are there gaps in historic data that would prevent year-to-year analytical reporting?
3. Are there functional processes / controls in place to ensure data consistency on an ongoing basis? 4. Are there primary / foreign key linkages available across databases with which to build meaningful
relationships?
5. Will the new BI / CPM tool be able to inter-operate with the many applications supported by the client? 6. Will the client’s Information Technology team possess the requisite skills to support the new BI / CPM
tool?
7. Will the infrastructure cost to support the BI / CPM tool be cost-prohibitive?
7) How does the role of the Chief Information Officer (CIO) differ from the role of the Chief Financial Officer (CFO)? Describe the differing positions taken by the CFO and the CIO. What motivated these individuals to take their respective positions?
The CIO is responsible for the information technology and information processing activities of an organization. This includes developing strategies for the use of information technology; analyzing and evaluating proposals for new and upgraded hardware and applications; preparing budgets for hardware, software and IT personnel; negotiating with vendors; and ensuring the effective operation of the IT department, its applications and network infrastructure.
The CFO is responsible for the financial activities of an organization. These responsibilities consist of establishing long-range financial strategies and ensuring optimal capital structure; the preparation of annual budgets; cash management; relationships with outside auditors, loan officers, regulatory agencies and other external constituencies; the issuance of periodic financial statements and related performance reports; and the oversight of the accounting function.
The CIO and CFO approached this initiative from two distinct perspectives. The CFO wanted to ensure that the BI / CPM tool selected provided a robust financial and managerial reporting solution enabling his team to provide value-added “what if” analysis to the executive team. The CIO took the position that since they were an “Oracle” shop, they should leverage Oracle’s Discoverer product and not pursue other application solutions. The CIO felt that his team was in a position to support the Oracle Discoverer Reporting tool and provide the needed reporting to the organization. The CFO felt that the CIO would be limiting his access to valuable data as the CIO was not staffed (did not possess the relevant skillset) to provide the CFO with “On Demand” reporting capabilities.
8) What external event affected this project? How did the organization respond?
In the middle of the events described in the case, a venture capital firm purchased the organization. This created a profound sense of uncertainty about the future. All of the senior “C” level executives were concerned for their jobs and focused on more immediate reporting needs rather than establishing a long term scalable BI / CPM solution. As their concerns about job security escalated, there was a shift in priorities; rather than focusing on establishing Key Performance Indicator (KPI) reporting that would drive profitability, they were focused on reporting that provided greater visibility into the past (the venture capital firm was asking for a great deal of historical reporting at a detailed level). This shift in strategy resulted in the CFO / CIO accelerating the BI / CPM tool selection and implementation initiative in order to meet the venture capital firm’s requirement for detailed historic reporting.
This case has been successfully used as a written assignment, followed by an in-class discussion. The final questions above require students to analyze the facts of the case and reach a conclusion, and there are a variety of plausible reasons to support either a “yes” or a “no” response. Below are some of the reasons offered in support of both responses to these questions:
“Yes”
1. The company’s existing technology infrastructure, despite its limitations, is sufficient
2. The lack of expertise and understaffing in the CIO’s can be overcome with a reasonable commitment of training and resources
3. The vendor currently used by the company (Oracle) provides an adequate BI / CPM solution
4. Pressure from the new owner, and a desire by the employees to satisfy the new owner, will ensure the project’s success
5. The BI / CPM solution will help improve the organization’s performance, and therefore will be supported by the employees
6. The organization has demonstrated an awareness of its limitations by engaging the services of a consultant
7. The consulting engagement represents an opportunity to effect positive change in the organization
“No”
1. The organization is unlikely to commit the necessary resources to improve the IT infrastructure and resolve the technology concerns described in the case
2. The lack of expertise and understaffing in the CIO’s team is too much to overcome
3. There is too much uncertainty in the organization at this time to enable the executives to focus on a major new technology project
4. The organization’s culture indicates an unwillingness to embrace change; in particular, the CIO’s team may strongly resist any solution that does not utilize its existing systems and software
5. Responsibility for maintaining the BI / CPM solution after it has been implemented has not been resolved 6. The new focus on immediate reporting needs and historical results is not compatible with the primary
objectives of a BI / CPM solution
7. The organization does not appear to have an overall, comprehensive strategy for information technology development