A Sinusoidal Noise Model Based Speech
Synthesis For Phoneme Transition
H.M.L.N.K Herath, J.V Wijayakulasooriya
Abstract: One well-known problem with speech synthesis is the occurrence of audible discontinuities at phoneme boundaries, which lead to the unnaturalness of synthetic speech. This paper presents a sinusoidal noise based mathematical method to reform the transition regions from one phoneme to another phoneme with low storage. The speech parameters of sinusoidal noise model were estimated and stored as polynomials to reconstruct the transition wave. According to the results, all transitions regions which are considered during this experiment have higher correlation values for lower order polynomial with less capacity ratio. In addition, to that the same experiment has been carried out by changing the number of FFT coefficient. As the FFT coefficient increases, capacity ratio was also increased, while correlation coefficient values were also increased. It was understood that a signal which is very close to the original signal can be generated with a lesser number of FFT coefficients
Index Terms: Speech synthesis; Phoneme; Sinusoidal noise model
————————————————————
1.
I
NTRODUCTIONSpeech is an acoustic waveform that conveys information from a speaker to a listener in a slow time varying signal which is created by vocal cords and the response of the vocal cavity. The goal of speech synthesis is to convert a string of text, or a sequence of words, into natural-sounding speech. However, numerous techniques has been proposed in past decades and still no speech synthesis system which is available today is able to produce speech that could be characterized as natural or completely pleasant. Solutions for embedded speech synthesis have been available on the market for some time but most of them use parametric synthesis [1] instead of wavetable synthesis (concatenation) due to low storage capacity requirements. However, the former doesn‘t provide high quality speech compared to concatenation synthesis in every context. The popular concatenation methods such as SOLA [2], FDPSOLA[3], TD-PSOLA [4], WSOLA [5], MBROLA [6],PIOLA [7], etc are based on overlap-add method. In the above methods, the frames from the utterances within the speech body are extracted, preprocessed and recombined using an overlap-add (OLA)algorithm[14] .Although it is computationally very efficient, it requires a significantly large speech data-bases in order to produce high-quality synthetic speech[14]. This makes the above methods less appealing to embedded applications. So the Concatenative synthesis is avoided in embedded speech synthesis applications since it requires large recorded speech data-bases[14].
Further, the biggest problems of concatenative systems is modifying the prosody of the recorded speech units(phones, diphones, syllables, etc.) and concatenating them in order to keep pitch, phase, amplitude, and frequency envelope continuity[14]. While data reduction algorithms like code excited linear prediction [8] can be employed in order to reduce the size of the data-base, the quality of the synthesized speech is low. Among the above methods, although TD-PSOLA provides good quality speech synthesis, it has limitations which are related to its non-parametric structure; spectral mismatch at segmental boundaries and tonal quality when prosodic modifications are applied on the concatenated acoustic units[9]. In order to address these issues, two parametric models; source filter model and sinusoidal model were used in speech synthesis. In source-filter model the vocal tract transfer function is represented as a filter. In sinusoidal model the source and the system features are included as parameters. Latest methods attempt to simplify the general sinusoidal model by making the harmonic nature of the signal explicit in the model , and managing noise components in various ways [10].
2.
S
INUSOIDALM
ODELThe sinusoidal model was originally proposed by McAulay&Quatieri for speech coding purposes and by Smith & Serra [McAulay&Quatieri 1986; Smith & Serra 1987] for the representation of musical signals. One of the possible representations of speech waveform can be presenting speech, as the result of passing a glottal excitation waveform through a time-varying linear filter that models the resonant characteristics of the vocal tract [13]. The sinusoidal model speech or music signal are represented as sum of sinusoids each with time-varying amplitude, frequency and phase. In this model, first the original signal is windowed into frames, and the short-time spectrum was examined to obtain the prominent spectral peaks. Then the frequencies of the local maxima in the consecutive frames are matched, i.e. the frequencies of the current frame are connected with the nearest neighbor frequencies of the previous frame. For a given frequency track, the amplitudes are interpolated linearly, and a cubic function is used to unwrap and interpolate the phase such that the phase track is highly smoothen. Sinusoidal modeling works quite well for perfectly periodic signals, but performance degrades in practice since speech is rarely __________________________
H.M.L.N.K Herath, Post Graduate Institute of
Science (PGIS), Faculty of Science, University of
Peradeniya, Peradeniya, Sri Lanka,
PH+94771306026,
(email: [email protected])
J.V Wijayakulasooriya, Department of Electronic
and Electrical Engineering, Faculty of Engineering, University of Peradeniya, Peradeniya, Sri Lanka,
periodic during phoneme transitions. In addition, very little periodic source information is generally found at high frequencies, where the signal is significantly noisier. To address this issue the sinusoidal model was improved as a residual noise model that models the non-sinusoidal part of the signal as a time-varying noise source. These systems are called sinusoids plus noise systems. Sounds that are produced by auditory systems, can be modeled as sum of the deterministic and the stochastic parts, or as a set of sinusoids plus the noise residual [12]. In the standard sinusoidal noise model, the deterministic part is represented as a sum of sinusoidal trajectories with time varying parameters. The trajectory is a sinusoidal component with time-varying frequencies, amplitudes and phases. It appears in a time-frequency spectrogram as a trajectory. The stochastic part is represented by the residual [11]. The whole signal s(t) can be written as
S(t) = ni=1aicos(2πif0t+Pi) + r(t) (1)
Where n= number of sinusoidal, ai= Amplitude of I th sinusoidal component, f0= Fundamental frequency, Pi=Phase of ith sinusoidal component, t= Time, r(t)=noise residual The amplitude and phase value of ith sinusoidal component was calculated by a polynomial equation
ai= bmXm + bm-1 Xm-1 +…….+ b1X+ b0 (2)
Pi = cmXm + cm-1 Xm-1 +…….+ c1X+ c0 (3)
Where b1…….bm and c1 ….cm are polynomial coefficients .
Since the sinusoidal noise model has the ability to remove irrelevant data and encode signals with lower bit rate, it has also been successfully used in audio and speech coding. The most of the available models based on the sinusoidal model are capable of synthesizing vowels and the phonemes in high quality. The correct mapping of transitions between phonemes is one of the problems that make the synthetic speech unnatural. The objective is to demonstrate how amplitude, phase values of a given phoneme transition are generated based on a new mathematical model and how this parameter set can be coded for high-quality speech at low bit rates.
3.
E
STIMATION OF SPEECH PARAMETERSThe main problem in modeling waveform transitions from one phoneme to another is finding extract parameters from a speech wave form that represents a quasi-stationary portion of that waveform. And then to use those to reconstruct an approximation that is closer to the original speech. In most of the cases the parameters must often be extracted from a speech signal that has been contaminated with acoustic noise. In general, it is difficult to store the frequency, phase and amplitude of the transition region from one phoneme to another. Therefore, to model the transition regions, a parametric mathematical model was developed. For demonstration purposes, short ‗a‘ sound words were considered and the transition regions were segmented manually. Frequency peak points were extracted manually from each segment of the sound wave. The speech parameters, amplitude and phase are estimated by applying Fast Fourier Transform (FFT) to the
quasi-stationary part of the speech waveform.
Xk = N−1n=0xne−i2πkn/N k=0,….,N-1 (4)
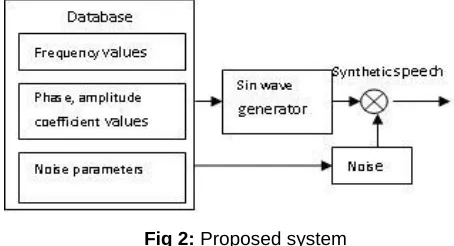
The basic analysis system for the sine model is shown in fig 1.The amplitude and phase values were calculated by considering the dominate poles of the FFT. The experiment was carried out changing the number of FFT coefficients from 5 to 20. Polynomials were chosen in order to regenerate amplitude and phase values. With the help of these parameters the sinusoid is generated. (Fig 2)
Fig 1: Basic analysis model
White Gaussian noise was applied to generate the noise residuals (r(t)) using the mean and the stranded deviation of the noise. The amplitude, phase parameters were calculated by selecting constant to vowel transitions of short /a/ sound words, ba, da, ca etc. It is infeasible to carry out the experiment for all those words, thus some words were selected by considering the phoneme classification. Then the, Pearson‘s correlation between original wave and the reconstructed wave were calculated using MATLAB.
Fig 2: Proposed system
The required capacity to store the source wave form and the proposed method speech parameters were compared by calculating the capacity ratio.
4.
R
ESULTS ANDD
ISCUSSIONFig 3: The standard deviation of the error between original amplitude values and the calculated amplitude values of first five poles (A0..A1) in ‗Ba‘ transitions.
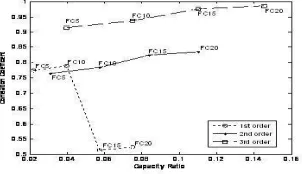
As illustrated by fig3, when the order of the polynomial was increased, the standard deviation of the error was decreased gradually. That implies the calculated amplitude values were more and more closer to the original values in higher order polynomials. Same procedure was conducted to calculate the phase values by changing the order of polynomials. The proposed system was applied to reform the transition regions of different words, which were selected according to the phoneme classifications. The polynomial order varies with the number of cycles included in the transition region. Transition regions for ‗Pa‘, ‗Ba‘ and ‗Ma‘ consist of three cycles and the maximum order of the polynomial was 3. But both Fricatives voice constant ‗Va‘ and unvoiced constant ‗Fa‘ have 4th order polynomials. It is because the duration of the Fricatives constants transition region was longer than the other constants. Fig 4 shows how the correlation coefficient changes with capacity ratio in different polynomials. All observed correlation values were closer to 0.7 or above. Comparing the correlation values of every transition region, maximum correlation was observed in the highest order polynomial. Even for lower order polynomials, reasonably higher correlation values were obtained such as 0.8198 for Pa, 0.7749 for Ba, 0.7375 for Fa, 0.9 for Ma and 0.9408 for Va (considering five FFT coefficients). Thus it can be suggested that a signal which is almost identical to the source signal can be generated using even lower order polynomials. The signal quality was improved when the capacity ratio was increased. In every transition region the capacity ratio of 1st order polynomial was less than other polynomial orders, because the number of points needed to store in 1st order of polynomial was less than the higher order polynomial. When the order of the polynomial was increased the capacity ratio was increased and the correlation coefficient values were gradually increased, as well.
Fig 4. Capacity ratio changes with correlation coefficient in different polynomials. subscription number indicates the order of the polynomial(M1 ) .
Even though more similar signals were observed in the higher order polynomials, the capacity ratio of the higher order polynomial, the original amplitude and phase values were equal. Thus, keeping a higher order polynomial is unsuitable as it is not in lined with the objective of the study. Moreover the results explain that even higher quality outputs can be obtained with lower order polynomial and have less capacity ratio. Further in this study a threshold value was defined for the correlation coefficient of 0.8 as the acceptable criteria. The generated outputs with above threshold were identified as acceptable quality. Fig 4 illustrates that there are few sounds (pa, ma, va), for which the lowest order polynomial (1st) can be accepted. There are some other sounds that are accepted at 2nd or 3rd order polynomials (fa, ba). The same experiment was repeated by changing the number of poles in the FFT. According to the Fig 5 (a, b, c, d), it can be clearly seen, when the number of FFT coefficients are increased, the correlation between the original and the generated waves was also increased. However, when the number of FFT coefficients were increased, the variation in the correlation coefficient is not much higher (FC5 ..FC20). Thus, increasing the number of FFT coefficients would not provide any significant improvements. It is because that first five FFT coefficients have extracted the most important features in the signal. Thus, it is evident that more information can be extracted even with low number of FFT coefficients. Also, for some order polynomials a significantly lower correlation was observed when the number of FFT coefficients is increased. This is due to the amount of data captured was huge and it disturbed the most important data as well.
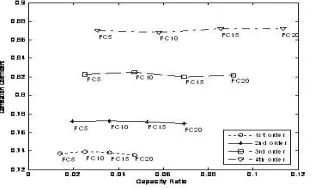
Fig 5(b): Capacity ratio changes with correlation coefficient in different polynomials in different number of FFT coefficients for ‗pa‘.
Fig 5( c ): Capacity ratio changes with correlation coefficient in different polynomials in different number of FFT coefficients for ‗fa‘.
Fig 5(d): Capacity ratio changes with correlation coefficient in different polynomials in different number of FFT coefficients for ‗ma‘
5.
C
ONCLUSIONIn this paper, a new parametric method has been proposed to synthesis transition region of consecutive phonemes in low capacity. Using this proposed mathematical method, amplitude values and phase values were calculated by a polynomial equation. The result has a standard deviation error which is less than 0.1 for polynomial of any order. That shows the calculated values were closer to the original amplitude values and phase values. In addition, it indicates that the order of the polynomial increases as the standard deviation error reduces. This new model reconstruct the phoneme transition regions which are closer to the original phoneme transition. The above results point out that the all transitions regions have the correlation values greater than 0.7 for any order polynomial. For higher order polynomials the correlation coefficient values were between 0.85 and 1 and the capacity ratio increases proportionally to the order.
High quality outputs were observed in higher order polynomials with higher capacity ratio. This is not in line with the objective. But a reasonable correlation coefficient value was observed in lower order polynomials with less capacity. In addition to that the correlation values as well as the capacity ratio were increased as number of FFT coefficient was increased. Increment factor of the correlation values were not very high, and hence we can accept the signals which are generated from lower order polynomials. The main issue in speech synthesis is, the transitions between phonemes cannot be modeled with lesser number of parameters. So unnaturalness of synthetic speech was observed in the result. Thus the proposed method consumes lesser space to store information of each phoneme transition while the output is almost identical to the source signal. It indicates that most of the features of the original signal have been reconstructed by the parametric method in low capacity.
6.
R
EFERENCES[1]. Epson, ―Voice guidance LSI‖ S1V3G340 datasheet, March 2009
[2]. S. Roucos and A. Wilgus. ―High-Quality Time Scale Modification ofSpeech‖, in Proc. of the IEEE International Conference on Acoustics,Speech and Signal Processing, ICASSP‘85, 1985, pp. 236-239
[3]. F. J. Charpentier and M.G. Stella. ―Diphone synthesis using an overlapadd technique for speech waveforms‖, in Proc. of the IEEE International Conference on Acoustics, Speech and Signal Processing, ICASSP‘86, 1986, pp. 2015-2018
[4]. C. Hamon, E. Moulines and F. Charpentier, ―A diphone synthesis system based on time-domain prosodic modifications of speech‖, in Proc. of the IEEE International Conference on Acoustics, Speech and Signal Processing, ICASSP‘89, 1989, pp. 238-241
[5]. W. Verhelst and M. Roelands. ―An Overlap-Add Technique based onWaveform Similarity (WSOLA) for High-Quality Time-ScaleModification of Speech‖. in Proc. of the IEEE International Conferenceon Acoustics, Speech and Signal Processing, ICASSP‘93, 1993, pp. 554-557
[6]. T. Dutoit and H. Leich. ―MBR-PSOLA: Text to speech synthesis based on a MBE resynthesis of the segments data-base‖. Speech Communications, no. 13, pp. 435-40
[7]. L.L.M. Vogten, C. Ma, W. Verhelst and J.H. Eggen. ―Pitch inflected overlap and add speech manipulation‖, European patent 91202044.3, 1991
[8]. R.C. Torres, J.M. de Seixas, S.L. Netto, D.R. da S. Freitas and E.F.Brasil, ―Portable implementation of a text-to-speech system forPortuguese‖, in Proc. of EUSIPCO 2008, 2008
Harmonic Plus Noisemodel In Diphone Based SpeechSynthesis
[10]. A.S.Visagie,J.A.duPreez, Sinusoidal Modelling in Speech Synthesis, A Survey
[11]. Turi Nagy M., RozinajG.,An Analysis/Synthesis System of Audio Signal withUtilization of an SN Model, Radioengineering, Vol. 13, No. 4, December 2004.Pattern Recognition Association of South Africa (PRASA) conference, 2001
[12]. SERRA, X. Musical Sound Modeling with Sinusoids plus Noise.Musical signal processing. 1997, Roads C.& Pope S. &Picialli G. &De Poli G., Swets&Zeitlinger Publishers.
[13]. O‘Saughnessy D. (2001). Speech Communications – Human and Machine, University
[14]. Ştefan-Adrian Toma1, Gabriel-Ionuţ Târşa2, Eugeniu Oancea1, Doru-Petru Munteanu1, Felix Totir1, Lucian Anton1 A TD-PSOLA Based Method for Speech Synthesisand Compression