www.nat-hazards-earth-syst-sci.net/9/1409/2009/ © Author(s) 2009. This work is distributed under the Creative Commons Attribution 3.0 License.
and Earth
System Sciences
Changes in the flood hazard in Germany through changing
frequency and persistence of circulation patterns
T. Petrow, J. Zimmer, and B. Merz
Deutsches GeoForschungsZentrum GFZ, Telegrafenberg, 14473 Potsdam, Germany
Received: 18 February 2009 – Revised: 5 June 2009 – Accepted: 8 July 2009 – Published: 12 August 2009
Abstract. The link between trends in circulation patterns
and trends in the flood magnitude is studied for 122 meso-scale catchments in Germany for a period of 52 years (1951– 2002). Flood trends, significant at the 10% level, are de-tected for a large number of catchments. The catchments are pooled into three regions, based on flood seasonality and flood trends. Field-significant increasing trends are found for winter in Regions West and East. For summer, increasing and decreasing flood trends are detected for Regions South and East, respectively. The temporal behaviour of three flood in-dicators of each region is compared to atmospheric inin-dicators derived from circulation patterns. Significantly increasing frequency and persistence of flood-prone circulation patterns intensify the flood hazard during the winter season through-out Germany. Moreover, a trend towards a reduced diver-sity of circulation patterns is found causing fewer patterns with longer persistence to dominate the weather over Europe. This indicates changes in the dynamics of atmospheric cir-culations which directly influence the flood hazard. Longer persistence of circulation patterns which in general do not favour large precipitation amounts may lead to large runoff coefficients due to soil-moistening and hence cause floods.
1 Introduction
Changes in the atmospheric dynamics and their links to hy-drological processes are an important aspect in the discussion about climate change. During the last decades, many devas-tating floods occurred in Europe giving rise to the discussion whether or not flood-triggering atmospheric patterns may have significantly changed. Many studies evaluated trends in climatic variables such as the North-Atlantic Oscillation
Correspondence to: T. Petrow ([email protected])
(NAO), changes in ENSO phenomenon (El Nino/Southern Oscillation) or in circulation patterns (CP) and linked these with precipitation or temperature. CPs are either derived by 500 hPa geopotential height fields from reanalyses data or from classification schemes, for instance by Hess and Bre-zowsky (1952). B´ardossy and Caspary (1990) used the CP catalogue of Hess and Brezowsky for the period 1881–1989 and found significant changes in the frequency of daily, sea-sonal and annual data of several CPs leading to milder and wetter winters in Europe. Steinbrich et al. (2005) showed for South-Western Germany (Baden Wuerttemberg) that the link between CPs and large precipitation events varies strongly depending on the seasonal and regional conditions. They found most of the analyzed heavy precipitation events to be triggered by only few CPs. Werner et al. (2008) detected CP and precipitation trends in the Elbe catchment in the pe-riod 1951–2003. During the winter season, the number of days with precipitation tripled. Also, increases in frequency and duration of west and north-west circulation patterns were observed (Werner et al., 2008). Pauling and Paeth (2007) identified an increase in extreme winter precipitation during the last 300 years over Europe. Casty et al. (2005) found a close correlation between the NAO index and temperature and precipitation indices in the European Alps during the last 500 years. A clear relation between precipitation and NAO was detected by Feidas et al. (2007) for Greece for the period 1955–2001. They observed downward trends in winter and annual precipitation which were correlated with rising trends in the hemispheric circulation modes of the NAO. Santos et al. (2007) emphasized the strong link between NAO and heavy precipitation events over Europe.
1410 T. Petrow et al.: Changes in the flood hazard in Germany
page 6
flood events. However, winter peak discharges significantly increase in magnitude at
166
many gauges in the region (Petrow and Merz, 2009).
167
In this study, three flood indicators were analyzed for each gauge. These comprise
168
annual maximum streamflow series (AMAXF) as well as seasonal maximum series
169
(AWMAXF and ASMAXF). Annual maximum daily mean streamflow, i.e. the largest
170
daily mean streamflow that occurs in each hydrological year, is the most common
171
indicator in flood trend studies. The analysis of seasonal maximum series enables a
172
more differentiated picture of flood trends. Annual winter maximum discharge series
173
(AWMAXF) were derived from data between 1 November and 31 March of the
174
following year and consist of the largest daily mean discharge of each winter season.
175
Summer maximum discharge series (ASMAXF) were derived for the period of 1 April
176
– 31 October.
177
178
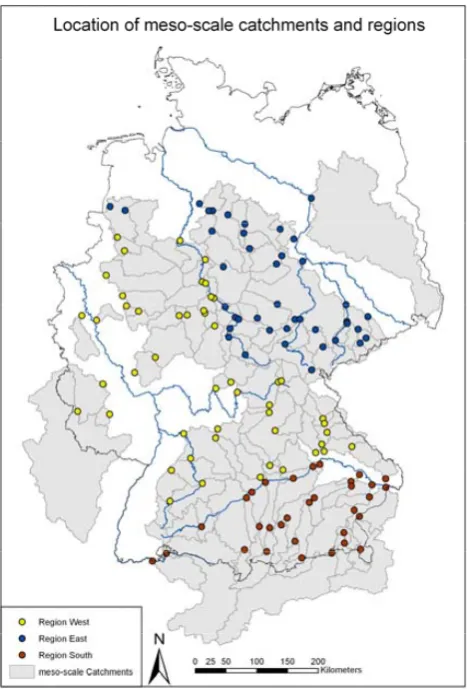
Figure 1: Discharge gauges of 122 meso-scale catchments and their assignment to one
179
of the three regions. Catchment borders illustrate the spatial coverage of the dataset.
180
181
2.2. Circulation
patterns
182
Fig. 1. Discharge gauges of 122 meso-scale catchment and their
assignment to one of the three regions. Catchment borders illustrate the spatial coverage of our dataset.
McKerchar and Henderson (2003) found changes in several hydrological variables in New Zealand which were consis-tent with changes in the Interdecadal Pacific Oscillation. Ja-cobeit et al. (2006) determined large-scale CP for histori-cal flood events with the help of Reanalysis data. They identified CPs that are relevant for the flood hazard in Eu-rope. The most important CPs for triggering prominent dis-charge peaks are (1) for summer the Vb-pattern, westerly flows with southerly components as well as troughs and (2) for winter westerly winds with changing north/south compo-nents. A study of meso-scale snow-free catchments in France and Spain by B´ardossy and Filiz (2005) identified flood-producing circulation patterns with the help of large-scale sea-level pressure fields. Bouwer et al. (2006) identified a closer relationship between mean winter discharge and WZ circulation patterns (after Hess and Brezowsky, 1952) than between discharge and NAO. Bouwer et al. (2008) calcu-lated correlations of four atmospheric variables (NAO, AO, westerly-cyclonic circulation pattern, sea-level pressure dif-ferences) and winter precipitation to annual mean and
maxi-mum winter discharges at 11 gauges in Central Europe. They found that annual maximum discharges are more sensitive to changes in atmospheric circulations than mean discharges. So far, the relationship between peak discharges and atmo-spheric variables has been investigated for Germany only for selected regions. Belz et al. (2007) analyzed flood dis-charges, CPs according to Hess and Brezowsky, and areal precipitation for the Rhine catchment. CPs were classified into wet and dry patterns. The pattern WZ was studied in more detail, since it is the most frequent pattern and com-prises the days with the largest precipitation amounts. Belz et al. (2007) found increasing trends in wet CPs (which also contain WZ), areal precipitation and discharge for the period 1951–2000. An even higher significance level of increasing trends was found for winter maximum discharges compared to increasing trends in annual maximum discharges. Caspary and B´ardossy (1995) found an increase in the pattern WZ for winter, leading to a dramatic increase in the flood hazard for South-Western Germany. Mudelsee et al. (2004) stud-ied flood trends in the Elbe and Odra catchments and found downward trends in winter and no significant changes during summer.
Since these studies are limited to selected regions in Ger-many, a countrywide picture of trends in floods and atmo-spheric patterns cannot be drawn. Our study closes this gap by presenting results of flood trends and trends in circulation patterns for 122 meso-scale catchments across Germany for the period 1951–2002.
The trend behaviour of eight flood indicators at 145 gauges (500–159 300 km2) in Germany was already analyzed for the same period by Petrow and Merz (2009). Their findings form the basis for the here presented study. Petrow and Merz (2009) detected trends in peak discharge, which were spa-tially and seasonally clustered. A missing relation between discharge changes and basin area suggests that the observed changes in flood behaviour are climate-driven.
In contrast to the study by Petrow and Merz (2009), we here present results of time-varying multiple trend tests both for flood and CP indicators. McCabe and Wolock (2002) also used this approach and found patterns of significant changes in different discharge variables in the United States for the period 1941–1999. For the evaluation of a possible link be-tween flood and atmospheric patterns, correlations bebe-tween peak discharges and CPs were computed similar to other studies (e.g. Feidas et al., 2007; Bouwer et al., 2008).
picture of the observed changes. For all regions conclusions are finally presented to what extent parallels between trends in flood magnitudes and trends in circulation patterns can be found.
2 Data
2.1 Discharge data
Discharge data of meso-scale catchments were used for this study. We included catchments of at least 500 km2 in or-der to minimize the influence of land management mea-sures on the flood behaviour (Bronstert et al., 2002). The largest analyzed catchment is the river Mosel at the gauge Cochem (27 088 km2). A common time period between 1 November 1951 and 30 October 2002 was used (hydrologi-cal year in Germany: 1 November to 31 October). Svensson et al. (2006) suggest a minimum length of 50 years for the analysis of flood trends. Shorter time series may not capture a possible trend, whereas very long series of up to 100 years may have other shortcomings as for instance changes of the measuring procedure over time. The chosen time period was seen as compromise between a minimum length and the re-quirements for reliability and availability of data.
Each of the 122 gauges was assigned to one of three re-gions (Fig. 1), which are characterized by homogeneous sea-sonal flood histograms and flood trends. The regions were extracted through a GIS-based multi-criteria analysis. His-tograms of the seasonal flooding frequencies as presented by Beurton and Thieken (2009) as well as trend results of eight flood indicators by Petrow and Merz (2009) were compared in a spatially-explicit manner in order to identify homoge-neous regions. A change in the assignment of gauges to one or the other region is visible along the main rivers of Danube and Weser. This is caused by differences in seasonal his-tograms of the flood indicators. For instance, the assignment of the gauges along the Danube to Region South can be ex-plained by the dominance of summer maximum discharges which is characteristic for the southern tributaries rather than for the northern ones. Figure 1 gives an overview of the lo-cation of the gauges and regions.
Region West (yellow dots) comprises 49 discharge gauges which are located in the Rhine, Weser, Ems and Danube catchments. This region has a winter dominated flood regime. Frequently, westerly winds cause flooding especially during winter. Trends in winter maximum discharges in-crease both in magnitude and frequency (Petrow and Merz, 2009). Summer floods play a minor role.
Region East (blue dots) consists of 41 gauges in the Weser, Ems and Elbe catchments. Maximum discharges occur pre-dominantly during winter in this region, however, summer peak discharges have a larger share than in Region West and can reach remarkable extents as experienced in 2002 and 2005 (DKKV, 2004; Beurton and Thieken, 2009). Winter
floods increase in Region East, whereas summer floods de-crease. This is the only region in Germany, in which summer floods significantly decrease (Petrow and Merz, 2009).
Region South is represented by 32 gauges which are lo-cated in the Rhine and Danube catchments. Two gauges are located in the Rhine catchment, all other gauges are lo-cated either along the main river of the Danube or along its southern tributaries. The two gauges in the Rhine catchment have larger shares of winter discharges compared to the other gauges in the Danube catchment. The Danube region is dom-inated by summer flood events. However, winter peak dis-charges significantly increase in magnitude at many gauges in the region (Petrow and Merz, 2009).
In this study, three flood indicators were analyzed for each gauge. These comprise annual maximum streamflow series (AMAXF) as well as seasonal maximum series (AWMAXF and ASMAXF). Annual maximum daily mean streamflow, i.e. the largest daily mean streamflow that occurs in each hydrological year, is the most common indicator in flood trend studies. The analysis of seasonal maximum series en-ables a more differentiated picture of flood trends. Annual winter maximum discharge series (AWMAXF) were derived from data between 1 November and 31 March of the fol-lowing year and consist of the largest daily mean discharge of each winter season. Summer maximum discharge series (ASMAXF) were derived for the period of 1 April to 31 Oc-tober.
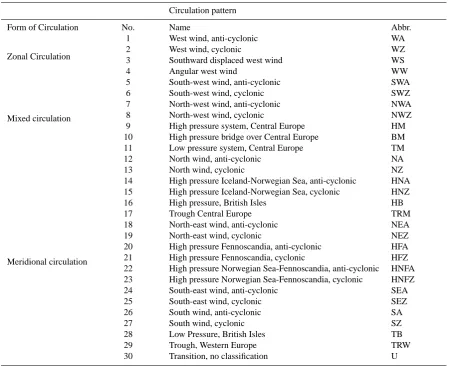
2.2 Circulation patterns
For the analysis of trends in circulation patterns different classification systems are available, which are either man-ual (based on subjective knowledge) or automated numerical schemes. The widely used manual classification scheme by Hess and Brezowsky (1952) is currently the only one avail-able, which captures the large-scale European pattern, while still focusing on local details (James, 2007). Buishand and Brandsma (1997) compared three classification schemes of CPs and found that the subjective Großwetterlagen classifi-cation by Hess and Brezowsky (1952) yields equally good results as the two other objective schemes. Therefore, the scheme by Hess and Brezowsky (1952) was used in this study. Moreover, the use of this classification facilitates the comparison of our results to other studied conducted for Ger-man catchments.
1412 T. Petrow et al.: Changes in the flood hazard in Germany form, the mixed circulation form as well as the meridional
circulation form (Table 1).
The most important CPs with respect to the flood hazard in Germany are WZ, WS, NWZ, and TRM. The first three patterns are frequent and comprise 25% of the overall dis-tribution for Germany. These are westerly winds of varying direction (from north to south). The pattern TRM is better known to be the “Vb-weather pattern” and is represented by a trough over Central Europe (van Bebber, 1891). Low pres-sure systems move from the Gulf of Genoa northwards to Poland. Large precipitation amounts can be accumulated and may be enhanced along the northern slopes of the Alps and the mountain ranges in Central and Eastern Europe. Several destructive floods were triggered by TRM, as experienced for instance in the Elbe and Danube catchments in 2002 and 2005 (Ulbrich et al., 2003).
The influence of a CP on the flood regime varies from re-gion to rere-gion. Peak discharges in Rere-gion West are often caused by westerly, south-westerly and north-westerly circu-lation types (Beurton and Thieken, 2009). High pressure sys-tems are rarely responsible for floods in Region West. Floods occur predominantly during mild and wet episodes in win-ter. Region East is also largely influenced by westerly winds, however, the north-westerly pattern plays a more important role than in Region West. A larger share of high pressure systems and the occurrence of Vb-weather regimes distin-guish the region from Region West. Region South is dom-inated by high pressure systems, especially during fall and winter. Westerly, north-westerly and south-westerly circula-tion types are less frequent compared with the other regions. Peak discharges occur predominantly during summer.
Daily data of the CPs were analyzed for trends in four vari-ables:
1. the number of days of each CP per year,
2. the number of events of each CP per year (indepen-dently of its length), and
3. the mean duration of each CP per year, and 4. the maximum duration of each CP per year.
These variables were analyzed on an annual basis and for winter and summer seasons. The number of days per year gives an indication of the frequency. The number of events was counted, independently of the CP length, in order to gain information about the variability of CP. The persistence of CP is particularly important for the flood hazard. There are numerous examples of long-lasting CPs that are accompa-nied by a sequence of weaker precipitation events, which fi-nally cause large floods.
To each value of the discharge AMAXF series of each gauge, the flood triggering CP was assigned, in order to eval-uate the link between changes in CP over time and flood trends. Depending on the catchment size, a time lag of one to three days was applied (Duckstein, 1993; Frei et al., 2000;
B´ardossy and Filiz, 2005). For small catchments with 500– 5000 km2, a time lag of one day was assumed, catchments with 5001 km2–20 000 km2 had a time lag of two days and larger catchments of three days. For example, a catchment of 600 km2had an AMAXF entry on 19 March 1951. Then, it was assumed that the flood triggering CP occurred on 18 March 1951. Although there is some uncertainty when as-signing a “mean” concentration time to all catchments of a certain size range, the time lag is regarded to be sufficiently precise, especially when considering that the median persis-tence of CPs is from three to five days. Except for the transi-tion class “U” (CP 30), all CPs persist for at least three days and often up to 10 days.
3 Trend detection
The robust non-parametric Mann-Kendall (MK) test and a resampling approach were used for detecting trends both in peak discharge and circulation patterns (Kendall, 1975). The MK test is particularly useful for the analysis of extremes and requires no specific distribution. It has been used by a vari-ety of studies on hydro-meteorological trends (e.g., Chen et al., 2007; Feidas et al., 2007). We applied the 2-sided option with 10% significance level. The MK test requires the data to be serially independent. von Storch and Navarra (1995) found that, if the data are positively serially correlated, the test tends to overestimate the significance of a trend. To correct the data for serial correlation, the procedure of trend free pre-whitening (TFPW) was applied, which is described in detail in Yue et al. (2002, 2003) and Petrow and Merz (2009). In short, a trend of a time series is estimated by the non-parametric trend slope estimator (Sen, 1968). A possi-ble trend is then removed from the original series. There-after, the lag1-autocorrelation is calculated. If no significant autocorrelation is found, the MK test is directly applied to the original time series. Otherwise, the lag1-autocorrelation is removed from the time series. The data series is now re-garded to be free of trend and serial correlation. Finally, the firstly removed trend is included back into the time series resulting in a series that includes the original trend without autocorrelation.
Table 1. Classification of the circulation form and its specific pattern after Hess and Brezowsky (1952).
Circulation pattern
Form of Circulation No. Name Abbr.
Zonal Circulation
1 West wind, anti-cyclonic WA
2 West wind, cyclonic WZ
3 Southward displaced west wind WS
4 Angular west wind WW
Mixed circulation
5 South-west wind, anti-cyclonic SWA
6 South-west wind, cyclonic SWZ
7 North-west wind, anti-cyclonic NWA
8 North-west wind, cyclonic NWZ
9 High pressure system, Central Europe HM 10 High pressure bridge over Central Europe BM 11 Low pressure system, Central Europe TM
Meridional circulation
12 North wind, anti-cyclonic NA
13 North wind, cyclonic NZ
14 High pressure Iceland-Norwegian Sea, anti-cyclonic HNA 15 High pressure Iceland-Norwegian Sea, cyclonic HNZ
16 High pressure, British Isles HB
17 Trough Central Europe TRM
18 North-east wind, anti-cyclonic NEA
19 North-east wind, cyclonic NEZ
20 High pressure Fennoscandia, anti-cyclonic HFA 21 High pressure Fennoscandia, cyclonic HFZ 22 High pressure Norwegian Sea-Fennoscandia, anti-cyclonic HNFA 23 High pressure Norwegian Sea-Fennoscandia, cyclonic HNFZ
24 South-east wind, anti-cyclonic SEA
25 South-east wind, cyclonic SEZ
26 South wind, anti-cyclonic SA
27 South wind, cyclonic SZ
28 Low Pressure, British Isles TB
29 Trough, Western Europe TRW
30 Transition, no classification U
Maximum discharge and CP time series were analyzed for trends not only for the entire period (1951–2002), but also with the help of moving windows of varying time lengths (multiple trend tests). Through this methodology it is possi-ble to detect changes in trends over time and to distinguish re-cent trends from trends that are stable over longer time peri-ods (McCabe and Wolock, 2002). All possible periperi-ods of 20 to 52 years within the investigated time series were analyzed for trends. The trend matrix shows for each variable and changing time periods the resulting significance level. These levels were derived by means of a resampling approach.
1. The time series is resampled randomly without replace-ment. A new time series is obtained with the same val-ues but different year order.
2. A linear trend line is fitted to the new time series and its slope is calculated.
3. By repeating steps 1 and 2 1000 times, a sample of slope values of size 1000 is obtained.
4. The significance level of the observed time series is de-termined by comparing its slope with the empirical cu-mulative distribution of the slope values of the resam-pled time series.
1414 T. Petrow et al.: Changes in the flood hazard in Germany
page 11
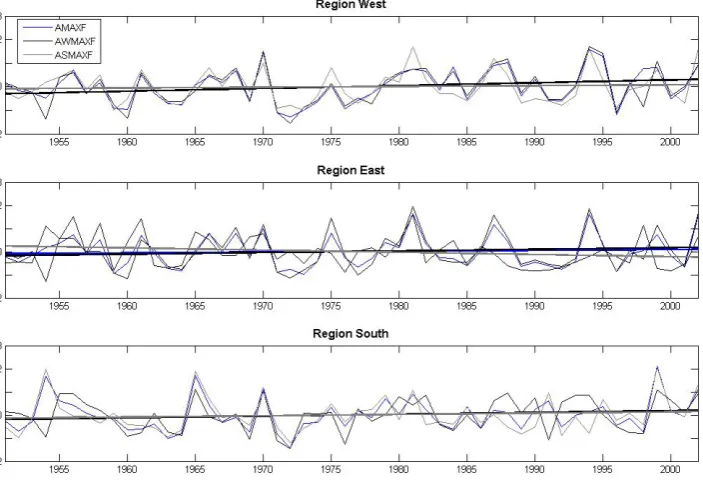
Composite discharge time series of the three maximum series are shown for all regions 310
in Fig. 2. Upward trends (MK Test, 10% SL) were found for all three composite series 311
for Regions West and South and for winter and annual maximum series for Region East. 312
A downward trend was detected for the composite summer maximum series 313
(ASMAXF) of Region East. Many trend lines in Fig. 2 have almost the same slope and 314
are therefore not easily distinguishable. 315
316
317
Figure 2: Composite maximum discharge time series with trends per region and flood
318
indicator (note: in Region West the trend lines of AMAXF and AWMAXF are almost the
319
same and therefore not easily distinguishable)
320
321
Discharge data of each gauge were tested with the MK Test for upward and downward 322
trend (SL 10%). Table 2 shows the results for the flood indicators and regions. Large 323
differences are evident in the number of trends per variable and region. 324
Many upward trends were found in the Regions West and South. The three gauges with 325
upward AMAXF trends in Region East are clustered in the southern part of the region 326
and are located in the vicinity of gauges with trends of Region West (Petrow and Merz, 327
2009). Upward trends in AWMAXF are spatially clustered in Central Germany 328
Fig. 2. Composite maximum discharge time series with trends per region and flood indicator (note: in Region West the trend lines of AMAXF
and AWMAXF are almost the same and therefore not easily distinguishable).
Table 2. Result of MK-Test (10% SL) of different flood indicators
for each region (bold numbers indicate field significance).
Number of Number of Flood gauges with gauges with Region indicator upward trend downward trend
West AMAXF 21 1
(49 gauges) AWMAXF 20 0
ASMAXF 3 0
East AMAXF 3 0
(41 gauges) AWMAXF 8 0
ASMAXF 0 12
South AMAXF 9 1
(32 gauges) AWMAXF 4 0
ASMAXF 8 1
only be suitable for the case that the majority of trends in a region are uniform, i.e. either upward or downward (Yue et al., 2003). Therefore, we applied a slightly refined approach, proposed by Yue et al. (2003), which assesses the field sig-nificance of upward and downward trends separately. A de-tailed description of the methodology can be found in Yue et al. (2003) or Petrow and Merz (2009).
4 Results
4.1 Trends in flood data
Composite discharge time series of the three maximum se-ries are shown for all regions in Fig. 2. Upward trends (MK Test, 10% SL) were found for all three composite series for Regions West and South and for winter and annual maximum series for Region East. A downward trend was detected for the composite summer maximum series (ASMAXF) of Re-gion East. Many trend lines in Fig. 2 have almost the same slope and are therefore not easily distinguishable.
Discharge data of each gauge were tested with the MK Test for upward and downward trend (SL 10%). Table 2 shows the results for the flood indicators and regions. Large differences are evident in the number of trends per variable and region.
are presented, which offer the possibility to study the tempo-ral variability of flood trends.
Figure 3 shows multiple trend tests (MK Test, 10% SL) for varying time periods of the composite series of AMAXF, AWMAXF and ASMAXF for the three regions. Upward trends are reflected in Figs. 3, 8 and 9 by numbers from 95 to 100, and downward trends by numbers from 5 to 0, re-spectively. The x-coordinate shows the starting year and the y-coordinate the ending year of the analyzed period, leading to time series lengths of 20 to 52 years. The result of the trend test for the time period 1951–1970 is given in the lower left corner of the trend matrix. In the upper left corner the result of the entire series (1951–2002) can be found. On the diagonal, trend results of 20-year time period are shown, be-ginning in the lower left corner with the period 1951–1970, progressing with a step of one year and ending in the upper right corner with the period 1983–2002. In the first row the results for Region West are shown, in the second row for Re-gion East and finally in the third row for ReRe-gion South. In the following, the results are discussed for each region sepa-rately.
4.1.1 Region West
Many upward trends are evident for Region West for AMAXF and AWMAXF. Both matrices have similar patterns (Fig. 3). Time series of different lengths ending latest in 1982 show a slightly downward tendency. Also, series of the last 20 to 25 years show small downward tendencies. All other time series which cover different time periods ending in 1982 or later show increases (mostly significant). Time series with at least 30 years show almost always upward trends. Interest-ingly, a relatively fast change of increases and decreases can be seen. The analysis of the diagonal with time periods of 20 years shows at first a period of decreasing annual and winter maximum discharges which ends in the beginning year 1962. This is followed by a period until 1977 where upward trends are detectable. From the beginning year 1978 onward, the time series show again no or only minor downward changes in the discharge data. This general pattern is more or less clearly seen for all regions for AMAXF and AWMAXF.
Multiple trend test were also performed for each gauge and flood variable. A relatively heterogeneous spatial pattern re-sulted (not shown). As it can be expected, the summation per variable of the individual matrices of all gauges revealed a good correlation with the regional composite for each vari-able.
Although the regional composite of the winter maximum discharge shows a very similar pattern compared to the an-nual maximum discharge, the downward tendencies of the last 20 to 25 years are more pronounced during winter. In contrast to AMAXF, a spatial pattern of the temporal trend behaviour is visible for AWMAXF. The gauges in the north-ern part of Region West show all similar pattnorth-erns and domi-nate the composite. All other gauges have changing patterns
349
Figure 3: Significance level of trends of different flood indicators for varying time
350
periods for Region West (first row), Region East (second row), and Region South (third
351
row). Results between 95 and 100 indicate upward trends, results between 0 and 5
352
downward trends.
353
354
4.1.1. Region West 355
Many upward trends are evident for Region West for AMAXF and AWMAXF. Both 356
matrices have similar patterns (Fig. 3). Time series of different lengths ending latest in 357
1982 show a slightly downward tendency. Also, series of the last 20 to 25 years show 358
small downward tendencies. All other time series which cover different time periods 359
ending in 1982 or later show increases (mostly significant). Time series with at least 30 360
years show almost always upward trends. Interestingly, a relatively fast change of 361
increases and decreases can be seen. The analysis of the diagonal with time periods of 362
20 years shows at first a period of decreasing annual and winter maximum discharges 363
which ends in the beginning year 1962. This is followed by a period until 1977 where 364
upward trends are detectable. From the beginning year 1978 onward, the time series 365
Fig. 3. Trends of different flood indicators for varying time periods
for Region West (first row), Region East (second row), and Region South (third row). Results between 95 and 100 indicate upward trends, results between 0 and 5 downward trends.
over time. These results are not shown here due to the limited readability when plotting a large number of matrices onto a regional map.
Summer maximum discharges play a minor role in Region West. The trend pattern of ASMAXF (Fig. 3) differs greatly for the last two decades. Decreases of different magnitudes are detectable for all time series since 1990. During the first years of the analyzed time span, the downward changes are similar to those in AMAXF and AWMAXF. Over the en-tire period, there are however nearly no significant trends de-tectable.
4.1.2 Region East
Although the seasonal distribution of flood events is similar to Region West with a majority of large discharges occur-ring duoccur-ring winter, the trend pattern for Region East shows many differences compared to Region West (Fig. 3, second row). A very heterogeneous pattern is visible for AMAXF with almost no trends. Periods of increasing and decreas-ing discharges alternate. Although the pattern of AWMAXF is dominated by increasing discharges, these are usually not significant at the 10% SL. The overall picture has some sim-ilarity to AWMAXF of Region West with clustered periods of upward and downward cycles.
1416 T. Petrow et al.: Changes in the flood hazard in Germany page 16
421
Figure 4: Mean frequencies of flood causing CPs in AMAXF series for the Region West,
422
East and South
423
Fig. 4. Mean histograms of CP in AMAX series for the Region
West, East and South.
4.1.3 Region South
Upward trends were detected for the three flood indicators in Region South (Fig. 3, third row). The AMAXF results show upward trends for a relatively short time frame begin-ning around 1960. Additionally, there are a few downward trends in short time series in the early 1950s, which can be found in all three flood indicators. Although the winter maximum discharge shows many upward trends, this pattern is not visible in AMAXF. The reason lies in the large per-centage of summer events in AMAXF. Thus, the absence of significant trends in ASMAXF causes the small number of trends in AMAXF. Downward and upward cycles are more pronounced in AWMAXF, whereas the changes in AMAXF and ASMAXF are less abrupt. Changes of the summer series reveal a more variable picture. Here, upward and downward periods dominate the pattern. Most of them are not signifi-cant.
4.2 Identification of flood triggering circulation patterns
In order to identify flood triggering CPs for the three re-gions, the frequency of CPs that are associated with annual maximum discharges (AMAXF) was derived. Different CPs are relevant for triggering peak discharges in each region. Histograms of the flood triggering CPs were calculated for each gauge. Thereafter, mean frequencies for every region were calculated (Fig. 4). The differentiation into winter and summer reflects the discharge behaviour of the respective re-gions.
Regions West and East both show a winter dominated flood regime that is mainly influenced by only few CPs. 62% of the maximum discharges in Region West are triggered by the circulation patterns: WZ, WS, SWZ and NWZ. In Re-gion West the dominance of WZ is more pronounced than in Region East, where the other remaining CPs play a more important role in triggering large discharges. The circulation patterns TM, TRM and TRW are important during the sum-mer in the Regions East and South, when they are associ-ated with large precipitation amounts that may cause floods. Note, that the importance of the CPs TM, TRM, TRW is not directly visible in Fig. 4, as they occur seldom.
Region South is characterized by a different seasonal flood behaviour. Summer maximum discharges dominate the AMAXF series. Winter peak discharges are triggered by the same CPs as in Region West, namely by WZ, WS and NWZ. Although summer floods have also large shares of WZ and NWZ, the circulation patterns BM, HB, TRM, NEZ and TRW play an important role for the summer flood hazard.
4.3 Trends in daily CP data
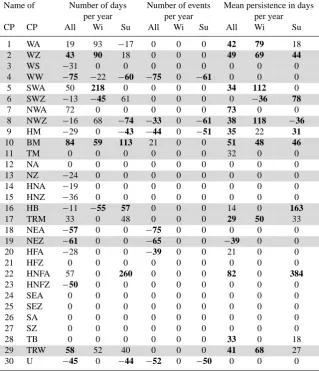
Daily data of CPs were analyzed for trend with the Mann-Kendall Test (10% significance level). Four variables that capture the behaviour of the CPs over time were selected. These are the number of days with a certain CP per year, the number of CP events (independent of its length) and the mean and maximum durations per year. These variables were derived for the complete hydrological year and for the win-ter season and summer season, respectively (Table 3). Since the trend results of the mean and maximum duration are very similar, Table 3 only shows the findings of the number of days, number of events and the mean duration per year. Six CPs show no trend at all for all variables and the different datasets. Four CPs revealed slight changes in only one vari-able, which were however not significant.
4.3.1 Number of days
Table 3. Relative change within 52 years in % (bold numbers indicate trends (MK-Test, 10% SL); grey rows show flood relevant CPs).
Name of Number of days Number of events Mean persistence in days
per year per year per year
CP CP All Wi Su All Wi Su All Wi Su
1 WA 19 93 −17 0 0 0 42 79 18
2 WZ 43 90 18 0 0 0 49 69 44
3 WS −31 0 0 0 0 0 0 0 0
4 WW −75 −22 −60 −75 0 −61 0 0 0
5 SWA 50 218 0 0 0 0 34 112 0
6 SWZ −13 −45 61 0 0 0 0 −36 78
7 NWA 72 0 0 0 0 0 73 0 0
8 NWZ −16 68 −74 −33 0 −61 38 118 −36
9 HM −29 0 −43 −44 0 −51 35 22 31
10 BM 84 59 113 21 0 0 51 48 46
11 TM 0 0 0 0 0 0 32 0 0
12 NA 0 0 0 0 0 0 0 0 0
13 NZ −24 0 0 0 0 0 0 0 0
14 HNA −19 0 0 0 0 0 0 0 0
15 HNZ −36 0 0 0 0 0 0 0 0
16 HB −11 −55 57 0 0 0 14 0 163
17 TRM 33 0 48 0 0 0 29 50 33
18 NEA −57 0 0 −75 0 0 0 0 0
19 NEZ −61 0 0 −65 0 0 −39 0 0
20 HFA −28 0 0 −39 0 0 21 0 0
21 HFZ 0 0 0 0 0 0 0 0 0
22 HNFA 57 0 260 0 0 0 82 0 384
23 HNFZ −50 0 0 0 0 0 0 0 0
24 SEA 0 0 0 0 0 0 0 0 0
25 SEZ 0 0 0 0 0 0 0 0 0
26 SA 0 0 0 0 0 0 0 0 0
27 SZ 0 0 0 0 0 0 0 0 0
28 TB 0 0 0 0 0 0 33 0 18
29 TRW 58 52 40 0 0 0 41 68 27
30 U −45 0 −44 −52 0 −50 0 0 0
CPs WZ, BM and TRW. It is important to note that all three CPs hold a considerable potential for floods. WZ is im-portant throughout Germany, whereas the patterns BM and TRW only play an important role for Region South. Down-ward trends were detected for the patterns WW, NEA, NEZ, HNFZ, and U. Among these, only NEZ is important for the flood hazard (again only in Region South). All other changes were not significant. Figure 5 shows two histograms of the number of days per CP for the annual dataset (top), winter (middle) and summer (bottom), respectively. On the left side the histograms for the decade 1951–1960 are found and on the right side for the decade 1991–2000. In all three datasets, a statistically significant shift is visible towards a smaller number of CPs, which dominates the weather (Chi2-Test; 10% SL). Thus, CPs, as for instance WZ, which had already a large share of days per year even increased in the frequency, whereas less frequent CPs in general decreased. There are some exceptions that are also important for the flood
haz-ard. For instance, the pattern TRM increased in frequency, although it rarely occurs. This is especially important for the summer flood hazard, although the changes are also de-tectable for the winter and the annual datasets.
1418page 19 T. Petrow et al.: Changes in the flood hazard in Germany
486
Figure 5: Comparison of CP frequencies for the decades 1951-1960 and 1991-2000
487 Fig. 5. Comparison of CP frequencies for the decades 1951–1960
and 1991–2000.
downward trend of−74%. Figure 4 shows that the NWZ pattern is especially important for triggering winter peak discharges throughout Germany and also summer peak dis-charges in Region South. The SWZ pattern has the opposite development: a downward trend during the winter and anon-significant increase during the summer months.
4.3.2 Number of CP events
The analysis of the number of events with a particular CP (independent of its length) reveals less change than for the number of days (Table 3). Only eight CPs show changes, seven of these are trends (significant at the 10% SL). During the winter there are no changes at all, and for the summer season there are only four trends, which are significant at the
page 20
488
489
Figure 6: Number of days per year in selected summer and winter daily CP series
490
491
4.3.2. Number of CP events 492
The analysis of the number of events with a particular CP (independent of its length) 493
reveals less change than for the number of days (Table 3). Only eight CPs show 494
changes, seven of these are trends (significant at the 10% SL). During the winter there 495
are no changes at all, and for the summer season there are only four trends, which are 496
significant at the 10% SL. With the exception of one increase (for BM), which is 497
however not significant, all other changes were downward. 498
499
4.3.3. Mean and maximum persistence 500
Conditions in the catchment prior to a flood play an important role for the flood hazard. 501
Consecutive precipitation events due to increasing persistence of specific CPs 502
contribute to soil saturation, leading to higher runoff, possibly even for weak 503
precipitation events. Our analysis reveals many upward trends in CP persistence. In the 504
entire dataset, 12 out of 30 CPs show significant changes in the mean persistence: 505
Upward trends were detected for 11 CPs, and only one downward trend was found for 506
Fig. 6. Number of days per year in summer and winter daily CP
series.
10% SL. With the exception of one increase (for BM), which is however not significant, all other changes were downward.
4.3.3 Mean and maximum persistence
Conditions in the catchment prior to a flood play an important role for the flood hazard. Consecutive precipitation events due to increasing persistence of specific CPs contribute to soil saturation, leading to higher runoff, possibly even for weak precipitation events. Our analysis reveals many up-ward trends in CP persistence. In the entire dataset, 12 out of 30 CPs show significant changes in the mean persistence: upward trends were detected for 11 CPs, and only one down-ward trend was found for NEZ (cf. Table 3). Eight of the 11 CPs also revealed upward trends in the maximum persis-tence. The only downward trend in the maximum duration was also found for NEZ. Figure 7 shows trends in the mean duration of selected CPs for summer and winter separately. The patterns WZ, NWZ and BM all have trends in the mean duration. WZ and BM show for all three datasets upward trends. The patterns NWZ and SWZ show again opposite trends for winter and summer. However, the trend directions are similar to those found for the frequency of days: for SWZ significant upward summer trends and for NWZ significant upward winter trends. The pattern TRM also shows increases which are however only significant for the annual dataset and the winter season.
4.4 Trend development of selected circulation patterns
4.4.1 Winter
T. Petrow et al.: Changes in the flood hazard in Germany 1419 NEZ (cf. Table 3). Eight of the 11 CPs also revealed upward trends in the maximum
507
persistence. The only downward trend in the maximum duration was also found for 508
NEZ. Figure 7 shows trends in the mean duration of selected CPs for summer and 509
winter separately. The patterns WZ, NWZ and BM all have trends in the mean duration. 510
WZ and BM show for all three datasets upward trends. The patterns NWZ and SWZ 511
show again opposite trends for winter and summer. However, the trend directions are 512
similar to those found for the frequency of days: for SWZ significant upward summer 513
trends and for NWZ significant upward winter trends. The pattern TRM also shows 514
increases which are however only significant for the annual dataset and the winter 515
season. 516
517
Figure 7: Mean duration of CPs per year in selected summer and winter daily CP series
518
519
4.4. Trend development of selected circulation patterns 520
4.4.1. Winter 521
All three flood regions are dominated during the winter season by the circulation 522
patterns WZ, WS and NWZ (cf. Fig.6). Figure 8 shows the significance level of trends 523
for the number of days per winter and the mean duration matrices. Upward trends are 524
reflected by the levels of 95 to 100, and downward trends by 5 to 0, respectively. 525
Fig. 7. Mean duration of CPs per year in summer and winter daily
CP series.
detected in the number of days per winter as well as in the mean duration for WZ. NWZ also shows upward trends in frequency, especially when including the most recent years. Large changes are also visible in the mean duration of NWZ during winter, where a significant upward trend is detectable, when including the last years in the time series, no matter how long the series progresses into the past. WS does not change very much over time. The number of events of WZ and NWZ does not show a change during winter, for WS a slight decline is visible (not shown in Fig. 8). These results show therefore an increased flood hazard during the winter for all regions of Germany. This is especially important for the Regions West and East, where WZ and NWZ trigger large shares of winter peak discharges.
4.4.2 Summer
The trend picture for the summer season is more differen-tiated for all regions (Fig. 9). Although the percentages of WZ-triggered summer peak discharges are much lower than for winter, WZ plays an important role for the flood hazard (cf. Fig. 4). In Region South an increased flood hazard is visi-ble, especially for the gauges in the Rhine catchment. Signif-icant increases (results between 95 and 100) in the duration of WZ are evident when including the last 10 years into the dataset. No changes in number of days and number of events were detected. In contrast to the winter season, NWZ is sig-nificantly decreasing (results between 5 and 0) during sum-mer in all three CP variables (Table 3). Downward changes are however only significant, when including at least 35 years into the trend test (Fig. 9). This decrease in the flood hazard caused by the NWZ pattern is again only relevant for Re-gion South, since in the other two reRe-gions there are rarely NWZ-triggered summer flood events. The Vb-pattern TRM is increasing in all three variables. When including the last decade in the trend test, the number of days and the mean duration show upward trends.
Upward trends were detected in the number of days per winter as well as in the mean 526
duration for WZ. NWZ also shows upward trends in frequency, especially when 527
including the most recent years. Large changes are also visible in the mean duration of 528
NWZ during winter, where a significant upward trend is detectable, when including the 529
last years in the time series, no matter how long the series progresses into the past. WS 530
does not change very much over time. The number of events of WZ and NWZ does not 531
show a change during winter, for WS a slight decline is visible (not shown in Fig. 8). 532
These results show therefore an increased flood hazard during the winter for all regions 533
of Germany. This is especially important for the Regions West and East, where WZ and 534
NWZ trigger large shares of winter peak discharges. 535
536
Figure 8: Significance level of trends in the number of days and mean duration during
537
winter of the circulation patterns WZ, WS and NWZ. Results between 95 and 100
538
indicate upward trends, results between 0 and 5 downward trends.
539
540
4.4.2. Summer 541
The trend picture for the summer season is more differentiated for all regions (Fig. 9). 542
Although the percentages of WZ-triggered summer peak discharges are much lower 543
than for winter, WZ plays an important role for the flood hazard (cf. Fig. 4). In Region 544
South an increased flood hazard is visible, especially for the gauges in the Rhine 545
Fig. 8. Significance level of trends in the number of days and
mean duration during winter of the circulation patterns WZ, WS and NWZ. Results between 95 and 100 indicate upward trends, re-sults between 0 and 5 downward trends.
page 23
catchment. Significant increases (results between 95 and 100) in the duration of WZ are 546
evident when including the last 10 years into the dataset. No changes in number of days 547
and number of events were detected. In contrast to the winter season, NWZ is 548
significantly decreasing (results between 5 and 0) during summer in all three CP 549
variables (Table 3). Downward changes are however only significant, when including at 550
least 35 years into the trend test (Fig. 9). This decrease in the flood hazard caused by the 551
NWZ pattern is again only relevant for Region South, since in the other two regions 552
there are rarely NWZ-triggered summer flood events. The Vb-pattern TRM is 553
increasing in all three variables. When including the last decade in the trend test, the 554
number of days and the mean duration show upward trends. 555
556
Figure 9: Significance level of trends in the frequency and mean duration during
557
summer of the circulation patterns WZ, NWZ and TRM. Results between 95 and 100
558
indicate upward trends, results between 0 and 5 downward trends.
559
560
4.4.3. Correlation between seasonal MAXF and combinations of CP 561
Although there is only poor visual agreement between multiple trend test matrices of the 562
different flood variables and individual CPs (cf. Fig. 3, Fig. 8, and Fig. 9), it is 563
interesting to investigate the correlation of the time series between seasonal MAXF and 564
combinations of CPs. The mean frequencies in Fig. 4 highlight the fact that a number of 565
Fig. 9. Significance level of trends in the frequency and mean
dura-tion during summer of the circuladura-tion patterns WZ, NWZ and TRM. Results between 95 and 100 indicate upward trends, results between 0 and 5 downward trends.
4.4.3 Correlation between seasonal MAXF and
combinations of CP
1420page 25 T. Petrow et al.: Changes in the flood hazard in Germany
598
Figure 10: Comparison of seasonal MAXF data and combinations of CPs (number of
599
days) for Region West (first row) and Region East (second row)
600
601
5. Discussion 602
A number of interesting trend results was found for each of the three flood regions 603
(West, South and East Region). A link between trends in winter maximum discharges 604
and the frequency and persistence of the CPs WZ and NWZ could be found for the 605
Regions West and East. For summer, the link is not that obvious, however, also 606
detectable for selected CPs and the Regions East and South. In the following, the 607
findings of the study are discussed separately for each region. 608
609
5.1. Region West 610
Region West is dominated by winter peak discharges which are significantly increasing 611
in magnitude. Several other studies found similar results for at least parts of the region 612
(Caspary, 1995; Caspary and Bárdossy, 1995; Belz et al., 2007; Petrow and Merz, 613
2009). The study of Hennegriff et al. (2006) is in good agreement with our findings 614
regarding the temporal dynamics of significant flood trends (cf. Fig. 3). They also 615
Fig. 10. Comparison of seasonal MAXF data and combinations of
CPs (number of days) for Region West (first row) and Region East (second row).
All three regions show significant correlations (at the 10% SL) for the combinations of composite winter maximum series and the sum of days with WZ-NWZ and WZ-WS-NWZ, respectively. Figure 10 exemplarily shows for Re-gions West (first row) and East (second row) results of four combinations of CP and seasonal discharge. These combina-tions were chosen based on (1) the dominance of winter peak discharges in Regions West and East, and (2) the large num-ber of significant correlations for summer in Region East (see below). An overall good agreement of the fluctuations of sea-sonal MAXF and the different combinations of CPs (number of days) can be seen. The results show better agreements for both regions for the winter season (first row both diagrams and lower left diagram) than for summer. Although the coef-ficients of correlation are quite low (0.43–0.51) they are sta-tistically significant. These low correlation coefficients are caused by (1) the small potential of a frequent CP to cause a flood event, and (2) the relatively poor agreement of the series during the first two decades.
For Region South, which is predominantly affected by summer floods, only non-significant correlations were found during summer, which are therefore not shown. The AS-MAXF series of that region comprises many CPs, which can only be poorly represented by a small number of CPs as in Fig. 10. The combination with summer maxima (lower right diagram) in Region East exemplifies the complex re-lation during summer. Region East shows many signifi-cant correlations of the composite summer maximum series and different combinations of number of CP-days. These are WZ-TRM, TM-TRM, TRM, and WZ-NWZ-TRM-TRW. Even the correlation between the composite AS-MAXF of Region East with the number of days of TRM is statistically significant. This is an important finding since TRM only comprises about 4% of the entire CP, but regu-larly triggers peak discharges during summer in Regions East
and South. Figure 10 (lower right subplot) presents therefore also a combination for summer in Region East, the one with the highest correlation. The overall agreement of fluctua-tions is, however, worse compared to the three subplots for winter combinations. The combination of CP days exhibits much more variability than the composite summer discharge series.
5 Discussion
A number of interesting trend results was found for each of the three flood regions (West, South and East Region). A link between trends in winter maximum discharges and the frequency and persistence of the CPs WZ and NWZ could be found for the Regions West and East. For summer, the link is not that obvious, however, also detectable for selected CPs and the Regions East and South. In the following, the findings of the study are discussed separately for each region.
5.1 Region West
Region West is dominated by winter peak discharges which are significantly increasing in magnitude. Several other stud-ies found similar results for at least parts of the region (Caspary, 1995; Caspary and B´ardossy, 1995; Belz et al., 2007; Petrow and Merz, 2009). The study of Hennegriff et al. (2006) is in good agreement with our findings regarding the temporal dynamics of significant flood trends (cf. Fig. 3). They also detected at many gauges significant upward trends in AMAXF and AWMAXF for time series beginning in the 1970s.
5.2 Region East
Region East is characterized by a similar winter discharge and CP regime as in Region West. The dominating patterns WZ and NWZ increase in frequency and persistence and will therefore intensify the flood hazard during the winter season. Mudelsee et al. (2006) also found an increase in the winter flood hazard during the last decades for parts of the region. Gerstengarbe and Werner (2005) found decreasing percent-ages of easterly circulation patterns during the winter, which cause cold and dry winters especially in Region East. At the same time, the number of days with precipitation tripled during winter in combination with increases in the frequency and duration of the patterns WZ and NWZ (Werner et al., 2008). These findings fit to our results of upward trends in the winter maximum discharges in Region East which are caused by more rain induced flood events due to milder win-ters and an intensified zonal circulation (Gerstengarbe and Werner, 2005).
Summer floods play a more important role than in Region West, especially floods triggered by TM and TRM (Petrow et al., 2007). We found decreasing trends in summer maxi-mum discharges in Region East (cf. Table 2). A decrease in the flood hazard would be expected to be also visible in a de-crease in flood-prone CPs during summer. The most frequent pattern WZ shows an upward trend in the duration. However, this pattern usually does not cause large floods in the region. In contrast the pattern TRM is better known to trigger large floods in the area. Although increases in the number of days and in the persistence of TRM were detected, these are not significant. Thus, a decreasing flood hazard based on the trends found in the discharge data of Region East is possi-ble, despite these non-significant increases in the duration of flood-prone CPs.
5.3 Region South
Region South is dominated by summer maximum discharges. Also for this region, an increasing flood hazard can be found due to increasing trends in the patterns WZ, SWZ, TRM and TRW which play an important role for AMAXF discharges in the region. Our results show an upward trend in the per-sistence of SWZ during summer. This pattern is prone to triggering heavy convective rainfall during summer, which regularly causes local flood events. Also, Gerstengarbe and Werner (2005) found for summer large upward trends in the frequency of SWZ (tripled frequency with a step change in the 1940s).
6 Conclusions
Analyses of trends in flood hazard and in flood-triggering CPs show a regionally and seasonally differentiated picture for Germany. We investigated flood time series of 122 meso-scale catchments in Germany and their triggering circula-tion patterns. Our analysis detected discharge trends (at the
10% SL) for a large number of catchments, as well as in the frequency and persistence of flood-favouring circulation pat-terns. Of particular interest is a significant increase in (1) the flood relevant CPs, as well as in (2) the very frequent CPs. Significant correlation (at the 10% SL) between the fre-quency of CPs and seasonal flood time series was detected.
We found a trend (significant at 10% SL) towards a re-duced diversity of CPs, causing fewer patterns with longer persistence to dominate the weather over Europe (cf. Fig. 7). This indicates changes in the dynamics of atmospheric cir-culations which are of direct relevance to the flood hazard. Longer persistence of CPs may lead to consecutive precipi-tation events. Although the single events may have rather low precipitation amounts, the succession of several events may lead to saturated catchment conditions. This is particularly important for winter peak discharge, which are in many cases triggered by WZ or NWZ patterns. Both are weather pat-terns that do not favour extreme precipitation. However, very wet preconditions may cause large runoff coefficients paving the way for flooding. Rapp and Sch¨onwiese (1996) found upward trends in winter precipitation in the period 1891– 1990 for large parts of South-Western and Western Germany. These results are in agreement with our findings and other studies for the Rhine catchment, which show significant in-creases in precipitation extremes and in the flood hazard dur-ing winter (e.g. Caspary and B´ardossy, 1995; Hundecha and B´ardossy, 2005; Belz et al., 2007; Petrow and Merz, 2009).
1422 T. Petrow et al.: Changes in the flood hazard in Germany The presented results have implications for the flood risk
management, especially for flood design measures. Petrow et al. (2008) compared a stationary and an instationary flood frequency analysis approach. They showed for the period of 1951–2002 that the stationary estimation (which assumes no trend in the data) may underestimate discharges of extreme events. Owing to the many detected flood trends in our study, a revised estimation of extreme events, which incorporates the instationarity inherent in the data, seems appropriate for the affected catchments.
Acknowledgements. We thank the Deutsches
GeoForschungsZen-trum GFZ and the Helmholtz Association of National Research Centres for their financial support. We dedicate our special thanks to the authorities that provided data.
Edited by: U. Ulbrich
Reviewed by: L. Bouwer and another anonymous referee
References
B´ardossy, A. and Caspary, H. J.: Detection of Climate Change in Europe by Analyzing European Atmospheric Circulation Pat-terns from 1881 to 1989, Theor. Appl. Climatol., 42, 155–167, 1990.
B´ardossy, A. and Filiz, F.: Identification of flood producing atmo-spheric circulation patterns, J. Hydrol., 313, 48–57, 2005. Belz, J. U., Braehmer, G., Buitefeld, H., Engel, H., Grabher, R.,
Hodel, H., Krahe, P., Lammersen, R., Larina, M., Mendel, H.-G., Meuser, A., M¨uller, G., Plonka, B., Pfister, L., and Van Vuuren, W.: Das Abflussregime des Rheins und seiner Nebenfl¨usse im 20. Jahrhundert – Analyse, Ver¨anderungen, Trends, Schriftenreihe der KHR, Koblenz and Lelystad, Bd. 1–22, 2007.
Beurton, S. and Thieken, A. H.: Seasonality of floods in Germany, Hydrolog. Sci. J., 54(1), 62–76, 2009.
Bronstert, A., Niehoff, D., and B¨urger, G.: Effects of climate and land-use change on storm runoff generation: present knowl-edge and modelling capabilities, J. Hydrol., 16, 509–529, doi:10.1002/hyp.326, 2002.
Buishand, T. A. and Brandsma, T.: Comparison of circulation clas-sification schemes for predicting temperature and precipitation in the Netherlands, Int. J. Climatol., 17, 875–889, 1997.
Burn, D. H. and Hag Elnur, M. A.: Detection of hydrologic trends and variability, J. Hydrol., 255, 107–122, 2002.
Bouwer, L. M., Vermaat, J. E., and Aerts, J. C. J. H.: Winter at-mospheric circulation and river discharge in northwest Europe, Geophys. Res. Lett., 33, L06403, doi:10.1029/2005GL025548, 2006.
Bouwer, L. M., Vermaat, J. E., and Aerts, J. C. J. H.: Re-gional sensitivities of mean and peak river discharge to cli-mate variability in Europe, J. Geophys. Res., 113, D19103, doi:10.1029/2008JD010301, 2008.
Caspary, H.: Recent winter floods in Germany caused by changes in the atmospheric circulation across Europe, Phys. Chem. Earth, 20, 459–462, 1995.
Caspary, H. and B´ardossy, A.: Markieren die Winterhochwasser 1990 und 1993 das Ende der Stationarit¨at in der
Hochwasser-hydrologie infolge von Klima¨anderungen?, Wasser und Boden, 47(3), 18–24, 1995.
Casty, C., Wanner, H., Luterbacher, J., Esper, J., and B¨ohm, R.: Temperature and Precipitation Variability in the European Alps since 1500, Int. J. Climatol., 25, 1855–1880, 2005.
Chen, H., Guo, S., Xu, C., and Singh, V. P.: Historical temporal trends of hydro-climatic variables and runoff response to climate variability and their relevance in water resources management in the Hanjiang basin, J. Hydrol., 344, 171–184, 2007.
DKKV (German Committee for Disaster Reduction): Flood Risk Reduction in Germany – Lessons Learned from the 2002 Dis-aster in the Elbe Region, DKKV Publication 29e, LESSONS LEARNED, Bonn, 2004.
Douglas, E. M., Vogel, R. M., and Kroll, C. N.: Trends in floods and low flows in the United States: impact of spatial correlation, J. Hydrol., 240, 90–105, 2000.
Duckstein, L., B´ardossy, A., and Bog´ardi, I.: Linkage between the occurrence of daily atmospheric circulation patterns and floods: an Arizona case study, J. Hydrol., 143, 413–428, 1993.
Feidas, H., Noulopoulou, C., Makrogiannis, T., and Bora-Senta, E.: Trend analysis of precipitation time series in Greece and their re-lationship with circulation using surface and satellite data: 1955– 2001., Theor. Appl. Climatol., 87, 155–177, 2007.
Frei, C., Davies, H. C., Gurtz, J., and Sch¨ar, C.: Climate dynamics and extreme precipitation and flood events in Central Europe, Integrated Assessment, 1, 281–299, 2000.
Gerstengarbe, F. W. and Werner, P. C.: Katalog der Großwetterlagen Europas (1881–2004) nach Paul Hess und Helmut Brezowsky (6th revised edition), PIK-Report No. 100, Potsdam, 2005. Glaser, R. and Stangl, H.: Climate and Floods in Central Europe
since AD 1000: Data, methods, results and consequences, Surv. Geophys., 25, 485–510, 2004.
Hennegriff, W., Kolokotronis, V., Weber, H., and Bartels, H.: Klimawandel und Hochwasser – Erkenntnisse und Anpas-sungsstrategien beim Hochwasserschutz, Korrespondenz Ab-wasser und Abfall, 53(8), 770–779, 2006.
Hess, P. and Brezowsky, H.: Katalog der Großwetterlagen Europas, Ber. Dt. Wetterd. in der US-Zone, 33, 1952.
Hirschboek, K. K.: Flood hydroclimatology, in: Flood Geomor-phology, edited by: Baker, V. R., Kochel, R. C., and Patton, P. C., Wiley, New York, 27–49, 1988.
Hundecha, Y. and B´ardossy, A.: Trends in daily precipitation and temperature extremes across Western Germany in the second half of the 20th century, Int. J. Climatol., 25, 1189–1202, 2005. Jacobeit, J., Philipp, A., and Nonnenmacher, M.: Atmospheric
circulation dynamics linked with prominent discharge events in Central Europe, Hydrolog. Sci. J., 51(5), 946–965, 2006. James, P. M.: An objective classification method for Hess and
Bre-zowsky Grosswetterlagen over Europe, Theor. Appl. Climatol., 88, 17–42, doi:10.1007/s00704-006-0239-3, 2007.
Kendall, M. G.: Rank Correlation Methods, Griffin, London, 1975. Kingston, D. G., Lawler, D. M., and McGregor, G. R.: Linkage between atmospheric circulation, climate and streamflow in the northern North Atlantic: research prospects, Prog. Phys. Geog., 30(2), 143–174, 2006.
Lindstr¨om, G. and Bergstr¨om, S.: Runoff trends in Sweden 1807– 2002, Hydrolog. Sci. J., 49(1), 69–83, 2004.
McCabe, G. J. and Wolock, D. M.: A step increase in streamflow in the conterminous United States, Geophys. Res. Lett., 29(24), 2185, doi:10.1029/2002GL015999, 2002.
McKerchar, A. I. and Henderson, R. D.: Shifts in flood and low-flow regimes in New Zealand due to interdecadal climate variations, Hydrolog. Sci. J., 48(4), 637–654, 2003.
Merz, R. and Bl¨oschl, G.: Process controls on the statistical flood moments – a data based analysis, Hydrol. Process., 23, 675–696, doi:10.1002/hyp.7168, 2009.
Mudelsee, M., B¨orngen, M., Tetzlaff, G., and Gr¨unewald, U.: Ex-treme floods in Europe over the past 500 years: Role of cy-clone pathway “Zugstrasse Vb”, J. Geophys. Res., 109, D23101, doi:10.1029/2004JD005034, 2004.
Mudelsee, M., Deutsch, M., B¨orngen, M., and Tetzlaff, G.: Trends in flood risk of the River Werra (Germany) over the past 500 years, Hydrolog. Sci. J., Special Issue Historical Hydrology, 51(5), 818–833, 2006.
Pauling, A. and Paeth, H.: On the variability of return periods of Eu-ropean winter precipitation extremes over the last three centuries, Clim. Past, 3, 65–76, 2007, http://www.clim-past.net/3/65/2007/. Petrow, Th., Merz, B., Lindenschmidt, K.-E., and Thieken, A. H.: Aspects of seasonality and flood generating circulation patterns in a mountainous catchment in south-eastern Germany, Hydrol. Earth Syst. Sci., 11, 1455–1468, 2007,
http://www.hydrol-earth-syst-sci.net/11/1455/2007/.
Petrow, Th., Delgado, J. M. M., and Merz, B.: Trends der Hochwassergef¨ahrdung in Deutschland und Konsequenzen f¨ur die Bemessung, Wasserwirtschaft, 11, 24–28, 2008.
Petrow, Th. and Merz, B.: Trends in flood magnitude, frequency and seasonality in Germany in the period 1951–2002, J. Hydrol., 371, 129–141, doi:10.1016/j.jhydrol.2009.03.024, 2009. Pfister, L., Kwadijk, J., Musy, A., Bronstert, A., and Hoffmann,
L.: Climate change, land use change and runoff prediction in the Rhine-Meuse Basins, River. Res. App., 20, 229–241, doi:10.1002/rra.775, 2004.
Rapp, J. and Sch¨onwiese, C.-D.: Atlas der Niederschlags- und Tem-peraturtrends in Deutschland 1891–1990, Universit¨at Frankfurt, Frankfurt, 1996.
Santos, J. A., Corte-Real, J., Ulbrich, U., and Palutikof, J.: Euro-pean winter precipitation extremes and large-scale circulation: a coupled model and its scenarios, Theor. Appl. Climatol., 87, 85– 102, doi:10.1007/s00707-005-0224-2, 2007.
Sen, P. K.: Estimates of the regression coefficient based on Kendall’s tau, J. Am. Stat. Assoc., 63, 1379–1389, 1968. Steinbrich, A., Uhlenbrook, S., Reich, Th., and Kolokotronis, V.:
Raum-zeitliche Zusammenh¨ange zwischen Großwetterlagen und Starkniederschl¨agen in Baden-W¨urttemberg, Wasserwirtschaft, 11, 14–19, 2005.
Sturm, K., Glaser, R., Jacobeit, J., Deutsch, M., Br´azdil, R., Pfister, Ch., Luterbacher, J., and Wanner, H.: Hochwasser in Mitteleu-ropa seit 1500 und ihre Beziehung zur atmosph¨arischen Zirkula-tion, Petermann Geogr. Mitt., 145, 14–23, 2001.
Svensson, C., Hannaford, J., Kundzewicz, Z., and Marsh, T.: Trends in river flows: why is there no clear signal in observations?, IAHS Publ., 305, Frontiers in Flood Research, 1–18, 2006. Ulbrich, U., Br¨ucher, T. Fink, A. H., Leckebusch, G. C., Kr¨uger, A.,
and Pinto, J. G.: The central European floods of August 2002: Part 2 – Synoptic causes and considerations with respect to cli-matic change, Weather, 58, 434–443, 2003.
van Bebber, W. J.: Die Zugstraßen der barometrischen Minima, Me-teorol. Z., 8, 361–366, 1891.
von Storch, H. and Navarra, A. (Eds.): Analysis of Climate Vari-ability – Applications of Statistical Techniques, Springer, New York, 1995.
Werner, P. C., Gerstengarbe, F.-W., and Wechsung, F.: Großwetter-lagen and precipitation trends in the Elbe river catchment, Mete-orol. Z., 17(1), 61–66, doi:10.1127/0941-2948/2008/0263, 2008. Yue, S., Pilon, P., Phinney, B., and Cavadias, G.: The influence of autocorrelation on the ability to detect trend in hydrological time series, Hydrol. Process., 16, 1807–1829, 2002.