O R I G I N A L R E S E A R C H
The Body Composition in Early Pregnancy is
Associated with the Risk of Development of
Gestational Diabetes Mellitus Late During the
Second Trimester
This article was published in the following Dove Press journal: Diabetes, Metabolic Syndrome and Obesity: Targets and Therapy
Yanping Liu 1,*
Jing Liu2,* Yinjie Gao3
Dan Zheng2
Wei Pan2
Min Nie3
Liangkun Ma 4
1Department of Clinical Nutrition, Peking Union Medical College Hospital, CAMS and PUMC, Beijing 100730, People’s Republic of China;2Guiyang Maternal and Child Health Care Hospital, Guiyang Children’s Hospital, Beijing 100730, People’s Republic of China;3NHC Key Laboratory of Endocrinology, Department of Endocrinology, Peking Union Medical College Hospital, Peking Union Medical College, Chinese Academy of Medical Sciences, Beijing 100730, People’s Republic of China;4Department of Obstetrics & Gynecology, Peking Union Medical College Hospital, Peking Union Medical College, Chinese Academy of Medical Sciences, Beijing 100730, People’s Republic of China
*These authors contributed equally to this work.
Objective: Gestational diabetes mellitus (GDM) causes both short- and long-term harm to mothers and fetuses. It is important to predict the occurrence of GDM as early as possible and take adequate measures to prevent it. The purpose of this study was to investigate the association between body composition of pregnant women in early pregnancy and the risk of GDM. Subjects and Methods:A total of 1318 pregnant women in the early stage of pregnancy were recruited from the Guiyang Maternal and Child Health Care Hospital. Detailed clinical data were recorded. Body composition was determined using the bioimpedance method at 13 weeks of gestation. The association between BMI before pregnancy (pre-BMI), fat mass percentage (FMP) and skeletal muscle mass percentage (SMMP) and the results of glucose tolerance screening in the second trimester of pregnancy were analyzed. Fat mass index (FMI) was calculated using fat mass in kilograms as measured using BIA at 13 weeks of pregnancy divided by the square of the woman’s height in meters (kg/m2) and was analyzed to determine the predictive effect of body fat on GDM.
Results:Of the 1318 participants, 249 were diagnosed with GDM and 1069 with normal blood glucose. The FMI and FMP in GDM were higher than in NGT (P<0.001), while the SMMP in GDM was lower than in NGT (P<0.001). Overweight women (pre-BMI≥24kg/m2) had a higher risk of developing GDM than women with normal pre-BMI (adjusted OR 2.604, 95% CI 1.846–3.673). Women with FMP greater than 28% had a higher risk of developing to GDM than women with normal-range FMP (adjusted OR 1.572, 95% CI 1.104–2.240). When FMI is used to predict the incidence of GDM, the area under the curve (AUC) is 65.8%, which is comparable to BMI (AUC=67.2%).
Conclusion: Body composition early during gestation is associated with the risk of GDM. The fat mass index in early pregnancy is a predictor of GDM, and it could be an indicator of the efficacy of any intervention to reduce the risk of GDM.
Keywords:gestational diabetes mellitus, body composition, fat mass percentage, fat mass index, skeletal muscle mass percentage
Introduction
Gestational diabetes mellitus (GDM) is diabetes that occurs or first diagnosed
during pregnancy. The incidence of GDM is about 2.3–29.6% in different ethnic
groups, and it has increased significantly in recent years.1At present, 2 h, 75 g oral
glucose tolerance test at 24–28 w is used to diagnose GDM in China. Pregnant
women with any one of three blood glucose values that are before or 1 or 2 h after
Correspondence: Min Nie; Liangkun Ma Email [email protected]; [email protected]
Diabetes, Metabolic Syndrome and Obesity: Targets and Therapy
Dove
press
open access to scientific and medical research
Open Access Full Text Article
Diabetes, Metabolic Syndrome and Obesity: Targets and Therapy downloaded from https://www.dovepress.com/ by 118.70.13.36 on 27-Aug-2020
taking sugar reaching or exceeding 5.1 mmol/L, 10.0
mmol/L, and 8.5 mmol/L, respectively, are
diag-nosed GDM.
GDM is associated with a range of short- and
long-term adverse outcomes for the mother and the fetus.2,3The
cumulative incidence of type 2 diabetes mellitus (T2DM) in GDM pregnant women within the ten years of delivery
can be as high as 60%.4,5 Pregnant women with GDM
have a significantly higher risk of giving birth to high or
low birth weight babies,6,7who are another potential cause
of diabetes.8,9 Normal-weight infants born to GDM
mothers had a higher incidence of obesity and impaired glucose tolerance during puberty than normal-weight
infants born to mothers with normal blood glucose.10
This shows that GDM can be an important cause of the increased prevalence of type 2 diabetes, and early detec-tion and intervendetec-tion of GDM pregnant women are crucial ways to reduce the incidence of type 2 diabetes.
The increased risk of GDM is associated with a variety
of factors, including maternal age ≥35 years, excess
weight or obesity before pregnancy, polycystic ovary
syn-drome, family history of diabetes—especially in fi
rst-degree relatives, GDM, and macrosomia delivery history.
Excessive body fat is a significant risk factor for GDM.11
A few studies investigated the association between adip-osity and gestational diabetes mellitus. Visceral and abdominal subcutaneous fat thickness measured by
ultra-sound during the first trimester of pregnancy may be
associated with the risk of developing GDM during
the second trimester of pregnancy.12–16 Nassr showed
that body fat index, which is calculated by multiplying the thickness of pre-peritoneal by that of subcutaneous fat
and then dividing by the patient’s height, is an excellent
predictor of the development of GDM.17
Conventional methods for assessing body composition in pregnancy include anthropometry, density measure-ment, and hydrometry. Bioelectrical impedance analysis (BIA) is a hydrometric method, and it allows accurate estimates of body composition early in pregnancy (14
weeks), as confirmed by comparison to deuterium
dilution.18 BIA is widely used for measuring body
com-position in China due to its inexpensiveness and practicability.
Abnormal body composition (high body fat and low skeletal muscle mass percentage) caused by excessive diet and a sedentary lifestyle can be corrected. If the value of abnormal body composition in GDM prediction can be clearly established, it can be used to begin early
intervention to prevent the occurrence of GDM rather than intervene after it occurs. We here aimed to investigate the relationship between body composition measured by BIA at 13 weeks of pregnancy and GDM diagnosed during the late second trimester.
Subjects and Methods
Study Design
This study retrospectively recruited pregnant women who delivered in Guiyang Maternal and Child Health Care Hospital (Guizhou Province, China). Written informed consent was obtained from all participants. The study was approved by the ethics committee of Peking Union Medical College Hospital (Protocol ID: S-K443) and in accordance with the Declaration of Helsinki.
Participants
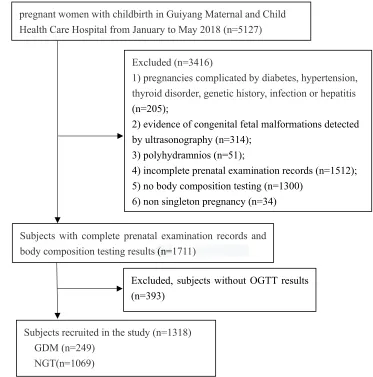
A total of 5127 healthy pregnant women with low-risk preg-nancies delivered in Guiyang Maternal and Child Health Care Hospital from January 2018 to May 2018. Since many preg-nant women do not attend antenatal care at the same hospital throughout their pregnancy, which results in incomplete infor-mation, and only some of them agreed to undergo body composition testing, a total of 1,745 pregnant women had complete prenatal follow-up records in this hospital. Excluding 34 pregnant women with non-singleton and 393 pregnant women for whom oral glucose tolerance test (OGTT) records were not available, a total of 1318 pregnant women were included in the study (Figure 1). The obstetric records of parturient and the hospital records of newborn were extracted from the prenatal care manual and discharge summary. All participants underwent a diagnostic 2 h 75 g OGTT between 24 and 28 weeks. Women with at least one elevated glucose
value based upon the IADPSG criteria (fasting≥5.1 mmol/L
(92 mg/dl), 1 h≥10.0 mmol/L (180 mg/dl), or 2 h≥8.5 mmol/L
(153 mg/dl)) were diagnosed with GDM. All other results were considered normal glucose test results (NGT). The exclu-sion criteria were as follows: (i) non-singleton pregnancy, (ii) pregnancies complicated by pre-gestational or gestational sys-temic diseases, such as hypertension, thyroid disorder, genetic history, infection or hepatitis, (iii) overt diabetes, (iv) evidence of congenital fetal malformations detected by ultrasonography, and (v) polyhydramnios.
Sample Size and Power Calculation
The sample size of the cohort was designed to detect a minimal odds ratio (OR) of 1.85 for GDM in overweight
Diabetes, Metabolic Syndrome and Obesity: Targets and Therapy downloaded from https://www.dovepress.com/ by 118.70.13.36 on 27-Aug-2020
pregnant women during the first term of pregnancy, which was referred to previous study that reported OR values
ran-ging from 1.85 to 5.70 in overweight pregnant women.19–21
The sample allocation ratio between two groups was set at 5
with the incidence of GDM being about 20% in China.22–24
The calculation also took into account other parameters, including an expected prevalence of GDM in normal-weight women of 10.0%, a power of 80.0%, and a
two-tailedαof 0.05. Based on these prerequisites, the theoretical
sample size is 1242, consisting of GDM group 207 and
control group 1035. We finally included 1318 pregnant
women, including 249 diagnosed as GDM and 1069 normal. For power analysis, given the above common parameters, we validated our sample size was able to achieve 85.27% power to detect an odds ratio in the group proportions of 1.85. All calculations were performed by PASS 15 software (NCSS,
LLC. Kaysville, Utah, USA.www.ncss.com).
Measurements
Maternal age, height, pre-pregnancy body weight, and neo-natal body weight were recorded. Body composition was measured in fasting and after urination by using the Body Composition Analyzer (Inbody720, Korea) according to the
manufacturer’s instructions in 13 weeks of pregnancy.
Maternal age was classified as “≥25 years” and “<25
years”. Body mass index before pregnancy (Pre-BMI) was
calculated using weight in kilograms during the three months before pregnancy, which was self-reported by the
partici-pants, divided by the square of the patient’s height in meters
(kg/m2). Pre-BMI was categorized into 3 groups according
to the standard of BMI for Chinese adults proposed by the Working Group on Obesity in China (WGOC): underweight
(<18.5 kg/m2), normal (18.5–23.99 kg/m2), overweight
(≥24 kg/m2). Fat mass index (FMI) was calculated using
fat mass in kilograms measured by BIA in 13 weeks of Subjects with complete prenatal examination records and
body composition testing results(n=1711)
pregnant women with childbirth in Guiyang Maternal and Child Health Care Hospital from January to May 2018 (n=5127)
Excluded (n=3416)
1) pregnancies complicated by diabetes, hypertension, thyroid disorder, genetic history, infection or hepatitis
(n=205);
2) evidence of congenital fetal malformations detected by ultrasonography (n=314);
3) polyhydramnios (n=51);
4) incomplete prenatal examination records (n=1512);
5) no body composition testing (n=1300) 6) non singleton pregnancy (n=34)
Excluded, subjects without OGTT results (n=393)
Subjects recruited in the study (n=1318) GDM (n=249)
NGT(n=1069)
Figure 1Flowchart showing enrollment in the study.
Diabetes, Metabolic Syndrome and Obesity: Targets and Therapy downloaded from https://www.dovepress.com/ by 118.70.13.36 on 27-Aug-2020
pregnancy divided by the square of the woman’s height in
meters (kg/m2). Fat mass percentage (FMP) and skeletal
muscle mass percentage (SMMP) were calculated using fat mass and skeletal muscle mass in kilograms as measured using BIA in 13 weeks of pregnancy divided by the body weight, respectively. FMP was categorized into 3 groups: insufficient (<18%), normal (18–28%), and excess (>28%).
Macrosomia was defined as birthweight of more than 4000
g and low birth weight as lower than 2500 g.
Statistical Analysis
Results are expressed as the mean ± standard deviation (SD). The relationships between GDM and clinical data, including age, FMI, FMP, SMMP, pre-BMI, were
evalu-ated using Spearman’s rank correlation analysis. The
chi-square (χ2) test was used to conduct statistical comparisons
of categorical data. The independent sample t-test was
carried out to assess the differences among continuous data. Logistic regression analysis was performed to assess the potential predictors for the development of GDM.
Factors found to be statistically significant according to
univariate logistic regression were considered confound-ing variables in the multivariable logistic regression model. The crude and adjusted odds ratios (OR) and
95% confidence intervals (CI) were calculated by
univari-ate and multivariunivari-ate logistic regression, respectively. The receiver-operating characteristic (ROC) curves were con-structed to calculate the area under the curve (AUC) for different measures of pre-BMI and FMI in predicting
GDM, and Delong’s test was used to compare the areas
under two ROC curves (Med Calc) named above. All analyses were performed using the IBM SPSS Statistics
21.0 (Armonk, NY, USA), and statistical significance was
set atP< 0.05.
Results
Of the 1318 pregnant women, 249 were GDM, and 1069 were NGT. The prevalence of GDM was 18.9%. The demo-graphic and clinical characteristics of the patients are
pre-sented inTable 1. The participants in the GDM group tended
to be older than those in the NGT group (32.6±5.1 vs 30.1 ±4.8). The FMI, FMP, and glucose of 3-point OGTT in
GDM were higher than in NGT (P<0.001), while the
SMMP in GDM was lower than in NGT (P<0.001).
There was a positive correlation between GDM and age, pre-BMI, FMP, and a negative correlation between
GDM and SMMP (Table 2).
Mothers over 25 years of age were more likely to have increased risk of GDM than those who were younger
(20.0% vs 7.3%, P<0.001) (Table 3), even after adjusting
for pre-BMI and FMP (adjusted OR=2.326, 95% CI 1.-103–4.903) (Table 4).
Overweight women (pre-BMI≥24kg/m2) had a higher
risk of developing GDM than women with normal pre-BMI (36.4% vs 14.7%, adjusted OR 2.604 (95% CI
1.-846–3.673), controlling for age and FMP) (Tables 3and
4). Pregnant women with FMP over 28% had a higher risk
of developing GDM than women with normal FMP (OR
Table 1 Comparison of Clinical Characteristics Between Pregnant Women with Normal Glucose Test and Gestational Diabetes Mellitus
NGT (n=1069)
GDM (n=249)
pvalue
Age (yrs) 30.1±4.8 32.6±5.1 <0.001
Pre-BMI (kg/m2) 21.40±2.76 23.25±3.50 <0.001
Weeksa(wks) 11.8±2.0 11.9±2.1 0.654
Fat mass index (kg/m2) 6.00±1.91 7.14±2.26 <0.001
Fat mass percentage (%) 27.5±5.6 30.1±5.8 <0.001
Skeletal muscle mass percentage (%)
43.0±10.8 40.0±8.3 <0.001
Glucose (0)b 4.51±0.29 5.22±0.62 <0.001
Glucose (1hr)b 7.06±1.36 9.74±1.79 <0.001
Glucose (2hr)b 6.30±0.97 8.17±1.51 <0.001
Body weight of neonate 3.27±0.47 3.30±0.42 0.244
Macrosomia, n (%) 41(3.8) 9(3.6) 0.871
Notes: a
The gestation week to measure the body composition.b
The plasma glucose level of 75g OGTT.
Abbreviations:NGT, normal glucose test; GDM, gestational diabetes mellitus.
Table 2 Correlations Between GDM and Age, Pre-BMI and Body Composition
Variables Correlation
Coefficient
pvalue
Age 0.165 <0.001
Pre-BMI 0.195 <0.001
Fat mass percentage (%) 0.157 <0.001
Skeletal muscle mass percentage (%)
−0.114 <0.001
Abbreviations:GDM, gestational diabetes mellitus; Pre-BMI, pre-pregnancy BMI.
Diabetes, Metabolic Syndrome and Obesity: Targets and Therapy downloaded from https://www.dovepress.com/ by 118.70.13.36 on 27-Aug-2020
2.431, 95% CI 1.803–3.277). The risks were slightly lower after controlling for age and pre-BMI (adjusted OR 1.572,
95% CI 1.104–2.240) (Table 4).
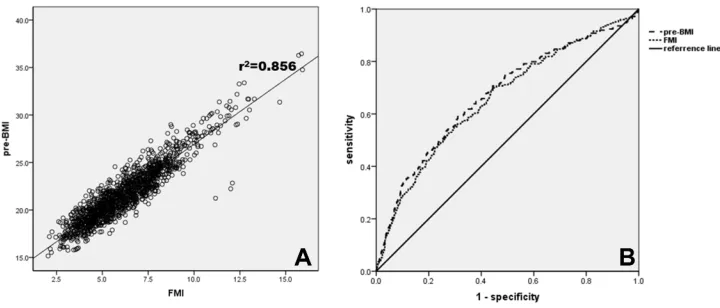
FMI showed a positive relationship to pre-BMI with
a correlation coefficient of 0.925 (Figure 2A). ROC curve
analysis showed that the AUC was 65.8% when GDM was predicted by FMI, which is comparable to BMI (67.2%), and the difference in AUC between FMI and Pre-BMI was not
significant (P=0.093) as indicated by DeLong’s method
(Figure 2B).
Of the 1318 neonates, 50 had macrosomia, 31 were low birth weight, and the others were normal birth weight.
The incidence of macrosomia was 3.8% (50/1318) in this study. There is no difference in the incidence of
macro-somia between NGT or GDM group (Table 1).
Discussions
We performed a cross-sectional investigation on the associa-tion between body composiassocia-tion measured at 13 weeks of
gestation and GDM confirmed at 24–28 weeks of gestation
and found two main results. First, the prevalence of GDM was 18.9% using the International Association of Diabetes and Pregnancy Study Groups (IADPSG) criteria, and the risk of GDM increased with age, pre-BMI, and FMP but
Table 3Number and Percentage of Subjects in Different Age, Pre-BMI and Fat Mass Percentage Group
Characteristics NGT (n=1069) GDM (n=249) pvalue
Number Percentage (%) Number Percentage (%)
Age (yrs)
<25 102 92.7 8 7.3 –
≥25 967 80.0 241 20.0 <0.05a
Pre-BMI (kg/m2)
<18.5 132 87.4 19 12.6 0.494b
≥18.5 and <24 766 85.3 132 14.7
-≥24 171 63.6 98 36.4 <0.001b
Fat mass percentage (%)
<18% 42 85.7 7 14.3 0.681c
≥18% and <28% 536 87.7 75 12.3
-≥28% 491 74.6 167 25.4 <0.001c
Notes:aCompared with age<25 years old group.bCompared with 18.5 kg/m2≤Pre-BMI <24 kg/m2group.cCompared with 18%≤Fat mass percentage <28% group.
Abbreviations:NGT, normal glucose test; Pre-BMI, pre-pregnancy BMI.
Table 4Crude and Adjusted Odds Ratios (OR) of the Risk Factors for Gestational Diabetes Mellitus
Variables Unadjusted OR (95% CI) p-value Adjusted OR (95% CI) Adjusted
p-value
Age (yrs)
<25 1 1
≥25 3.178(1.526–6.616) 0.002 2.326(1.103–4.903)a 0.027
Prepregnancy BMI
Normal 1 1
<18.5 0.835(0.499–1.398) 0.494 1.040(0.582–1.858) 0.895
≥24.0 3.326(2.440–4.532) <0.001 2.604(1.846–3.673)b <0.001
Fat mass percentage
Normal 1 1
<18% 1.191(0.516–2.748) 0.682 1.242(0.510–3.024) 0.634
≥28% 2.431(1.803–3.277) <0.001 1.572(1.104–2.240)c 0.012
Notes:a
Mothers over 25 years of age were more likely to have increased risk of GDM than those who were younger after adjusting for pre-BMI and FMP.b Overweight women (pre-BMI≥24kg/m2) had a higher risk of developing GDM than women with normal pre-BMI after adjusting for age and FMP.cPregnant women with FMP over 28% had a higher risk of developing GDM than women with normal FMP after adjusting for age and pre-BMI.
Diabetes, Metabolic Syndrome and Obesity: Targets and Therapy downloaded from https://www.dovepress.com/ by 118.70.13.36 on 27-Aug-2020
decreased slightly with SMMP. Second, when GDM was predicted by FMI, the AUC was 65.8%, which was compar-able to that of BMI (AUC=67.2%).
Chinese pregnant women are at high risk of developing GDM. The prevalence of GDM is related to the criteria used.
Before 2010, there was no unified method to diagnose GDM
in China. After 2010, the IADPSG method was generally recommended to diagnose GDM. Studies in different regions show that the incidence of GDM among Chinese women is
between 14.8% and 19.9%.22–24Our study also demonstrated
that the prevalence of GDM in Guiyang in Guizhou Province was as high as 18.9%, which is comparable to that of other local and regional studies mentioned above.
Maternal age is a definite risk factor for GDM, but there is
no consensus about the age above which the prevalence of GDM increases. Some studies have shown that the rate of GDM in women aged over 35 years old was higher than
among those under 35,23while others showed 25 years to be
the lowest cutoff age for the screening for GDM. The
recom-mendations of the American Diabetes Association,19several
previous studies, and this study indicated that an age of 25 years or older was associated with an increased prevalence of GDM. A study reported by Lao et al found that screening for GDM among patients 25 and older had a higher predictive
value in recognizing GDM.20 A meta-analysis by Lee et al
showed the OR of GDM among women 25 older to be 2.17.21
Our study found that women aged 25 years old and older had 2.499 times the chance of having gestational diabetes in com-parison to those under 25 years.
Obesity in the period immediately before pregnancy is one of the main factors underlying the development of GDM. BMI is commonly used as a marker to assess the severity of
obesity. In this study, the BMI cutoffs recommended by
WGOC were used.25We found the odds ratio for GDM to
be 2.604 (95% CI 1.846–3.673) in overweight women
(pre-BMI ≥24 kg/m2). Our results are consistent with those of
previous studies in which the odds of pre-BMI≥24 kg/m2for
GDM ranged from 1.85 to 5.7 in China.26–28
However, previous studies have shown that the Chinese population, like other Asian populations, has a lower BMI but a higher percentage of body fat than Caucasians of similar age
and gender.29BMI does not differentiate between bone,
mus-cle, and fat mass, so a simple and inexpensive method of assessing fat mass may be better for predicting the develop-ment of GDM. Methods such as bioelectrical impedance ana-lysis for the assessment of fat mass and fat-free mass in pregnant women in the body composition studies have been described.30–35Our study establishes that BIA is a feasible and reproducible method that can be used during pregnancy. We found pregnant women with FMP over 28% had a higher risk of developing GDM than women with normal FMP (adjusted
OR 1.572, 95% CI 1.104–2.240). These results are similar to
those of previous studies, in which the visceral fat mass,12
thickness of subcutaneous adipose tissue,15 and body fat
index (thickness of pre-peritoneal fat (mm) × thickness of subcutaneous fat (mm)/height (cm)) were good markers for
determining the risk of the development of GDM.17We also
found that SMMP was negatively correlated with increased risk of gestational diabetes. According to a study conducted by Kawanabe et al, inadequate appendicular skeletal muscle mass/fat mass ratio is a risk for the development of insulin
resistance in Japanese patients with GDM.29Unfortunately, we
did not evaluate the relationship between SMMP and insulin resistance since insulin test is not included in the routine
Figure 2Correlation between pre-BMI and FMI and receiver-operating characteristic (ROC) curve to predict GDM. (A) Correlation between Pre-BMI and FMI. There was a significant correlation between pre-BMI and FMI (r=0.925, p<0.001). (B) ROC curve predicts the presence of GDM. The AUC of FMI and Pre-BMI is 0.658 (p<0.001) and 0.672 (p<0.001), respectively. The DeLong test shows that the difference of AUC between FMI and Pre-BMI is not significant (p=0.093).
Diabetes, Metabolic Syndrome and Obesity: Targets and Therapy downloaded from https://www.dovepress.com/ by 118.70.13.36 on 27-Aug-2020
prenatal examination and we cannot extract the insulin results of the participants from antenatal records.
Our studies further established that the FMI has a positive correlation with pre-BMI (r=0.925) and is an excellent alter-native to pre-BMI (AUC=67.2%) for prediction of GDM (AUC=65.8%). Although FMI did not show a stronger pre-dictor of GDM than pre-BMI, it may be suitable for assessing the effectiveness of intervention measures for pregnant women. Wanget al found FMP was a better risk predictor
of GDM than pre-BMI,30which seems different from this
study. The difference of the two studies is that Wang et al analyzed the prediction of FMP for GDM in the second trimester (G13-20w), while this study investigated the pre-diction of FMP for GDM in early pregnancy (<G13w).
According to the results of Wang’s study and this study, it
suggests that FMP be a risk predictor of GDM from early term of pregnancy, and as the gestational age increases, FMP becomes a stronger predictor of GDM than pre-BMI.
The incidence of macrosomia is between 3.1% and
7.8% in different parts of China.36–39 Several studies
have shown that excessive gestational weight gain
(GWG) is associated with macrosomia, but
pre-pregnancy BMI is not.36 Maternal lipid parameters were
also found to be independent risk determinants of fetal
overgrowth in pregnancies.40Our results showed that the
prevalence of macrosomia in Guiyang is 3.8%, which falls near the lower limit for incidence of macrosomia in China. Several limitations of this study need to be mentioned. First, this is a retrospective study performed at a single
center, and thefindings need to be verified by other
prospec-tive cohort studies. Second, we focused only on the effect of
maternal body composition during thefirst trimester of
gesta-tion on the development of GDM, and we did not evaluate any other clinical data such as the family history of diabetes, insulin level, lipid profile, or adipokine levels.
Conclusions
The incidence of GDM in Guiyang was 18.9% as determined using the International Association of Diabetes and Pregnancy Study Groups (IADPSG) criteria. Age over 25 years and overweight or obese status immediately prior to pregnancy were all associated with a greater risk of GDM. The body composition in early gestation is associated with the risk of GDM. FMP over 28% was associated with the increased risk for developing to GDM and higher SMMP with a lower risk of gestational diabetes. The fat mass index in early pregnancy is a predictor of GDM, and it could be an
indicator of intervention efficacy to reduce the risk of GDM.
Acknowledgments
This work was supported by the National Natural Science Foundation of China (Grant No. 81270879). We would like to thank all participants for their participation in the research.
Disclosure
The authors declare that they have no conflicts of interest.
References
1. Yuen L, Wong VW, Simmons D. Ethnic disparities in gestational diabetes. Curr Diab Rep. 2018;18(9):68. doi:10.1007/s11892-018-1040-2
2. Johns EC, Denison FC, Norman JE, Reynolds RM. Gestational diabetes mellitus: mechanisms, treatment, and complications.Trends Endocrinol Metab.2018;29(11):743–754. doi:10.1016/j.tem.2018.09.004 3. Metzger BE, Coustan DR, Trimble ER. Hyperglycemia and adverse
pregnancy outcomes.Clin Chem.2019;65(7):937–938. doi:10.1373/ clinchem.2019.303990
4. Tam WH, Yang XL, Chan JCN, et al. Progression to impaired glucose regulation, diabetes and metabolic syndrome in Chinese women with a past history of gestational diabetes.Diabetes Metab Res Rev.2007;23(6):485–489. doi:10.1002/dmrr.741
5. Ben-Haroush A, Yogev Y, Hod M. Epidemiology of gestational diabetes mellitus and its association with type 2 diabetes. Diabet Med.2004;21(2):103–113. doi:10.1046/j.1464-5491.2003.00985.x 6. Claesson R, Aberg A, Marsál K. Abnormal fetal growth is associated
with gestational diabetes mellitus later in life: population-based reg-ister study. Acta Obstet Gynecol Scand. 2007;86(6):652–656. doi:10.1080/00016340701207682
7. Yang J, Cummings EA, O’connell C, Jangaard K. Fetal and neonatal outcomes of diabetic pregnancies. Obstet Gynecol. 2006;108(3 Pt 1):644–650. doi:10.1097/01.AOG.0000231688.08263.47
8. Hong YH, Chung S. Small for gestational age and obesity related comorbidities. Ann Pediatr Endocrinol Metab. 2018;23(1):4–8. doi:10.6065/apem.2018.23.1.4
9. Mahizir D, Briffa JF, Hryciw DH, Wadley GD, Moritz KM, Wlodek ME. Maternal obesity in females born small: pregnancy complications and offspring disease risk. Mol Nutr Food Res.
2016;60(1):8–17. doi:10.1002/mnfr.201500289
10. Boney CM, Verma A, Tucker R, Vohr BR. Metabolic syndrome in childhood: association with birth weight, maternal obesity, and gesta-tional diabetes mellitus. Pediatrics. 2005;115(3):e290–296. doi:10.1542/peds.2004-1808
11. Chu SY, Callaghan WM, Kim SY, et al. Maternal obesity and risk of gestational diabetes mellitus.Diabetes Care.2007;30(8):2070–2076. doi:10.2337/dc06-2559a
12. Balani J, Hyer SL, Shehata H, Mohareb F. Visceral fat mass as a novel risk factor for predicting gestational diabetes in obese preg-nant women. Obstet Med. 2018;11(3):121–125. doi:10.1177/ 1753495X17754149
13. De Souza LR, Berger H, Retnakaran R, et al. First-trimester maternal abdominal adiposity predicts dysglycemia and gestational diabetes mellitus in midpregnancy. Diabetes Care. 2016;39(1):61–64. doi:10.2337/dc15-2027
14. Gur EB, Ince O, Turan GA, et al. Ultrasonographic visceral fat thickness in thefirst trimester can predict metabolic syndrome and gestational diabetes mellitus. Endocrine. 2014;47(2):478–484. doi:10.1007/s12020-013-0154-1
15. Kansu-Celik H, Karakaya BK, Tasci Y, et al. Relationship maternal subcutaneous adipose tissue thickness and development of gestational diabetes mellitus. Interv Med Appl Sci. 2018;10(1):13–18. doi:10.1556/1646.10.2018.01
Diabetes, Metabolic Syndrome and Obesity: Targets and Therapy downloaded from https://www.dovepress.com/ by 118.70.13.36 on 27-Aug-2020
16. Yang SH, Kim C, An HS, An H, Lee JS. Prediction of gestational diabetes mellitus in pregnant Korean women based on abdominal sub-cutaneous fat thickness as measured by ultrasonography. Diabetes Metab J.2017;41(6):486–491. doi:10.4093/dmj.2017.41.6.486 17. Nassr AA, Shazly SA, Trinidad MC, El-Nashar SA, Marroquin AM,
Brost BC. Body fat index: a novel alternative to body mass index for prediction of gestational diabetes and hypertensive disorders in pregnancy. Eur J Obstet Gynecol Reprod Biol.2018;228:243–248. doi:10.1016/j.ejogrb.2018.07.001
18. Lof M, Forsum E. Evaluation of bioimpedance spectroscopy for measurements of body water distribution in healthy women before, during, and after pregnancy. J Appl Physiol. 2004;96(3):967–973. doi:10.1152/japplphysiol.00900.2003
19. American Diabetes Association. Gestational diabetes mellitus.Diabetes Care.2004;27(Suppl 1):S88–90. doi:10.2337/diacare.27.2007.s88 20. Lao TT, Ho L-F, Chan BCP, Leung W-C. Maternal age and
preva-lence of gestational diabetes mellitus. Diabetes Care. 2006;29 (4):948–949. doi:10.2337/diacare.29.04.06.dc05-2568
21. Lee KW, Ching SM, Ramachandran V, et al. Prevalence and risk factors of gestational diabetes mellitus in Asia: a systematic review and meta-analysis. BMC Pregnancy Childbirth. 2018;18(1):494. doi:10.1186/s12884-018-2131-4
22. Mak JKL, Lee AH, Pham NM, et al. Gestational diabetes incidence and delivery outcomes in Western China: a prospective cohort study.
Birth.2019;46(1):166–172. doi:10.1111/birt.12397
23. Gao C, Sun X, Lu L, Liu F, Yuan J. Prevalence of gestational diabetes mellitus in mainland China: a systematic review and meta-analysis.
J Diabetes Investig.2019;10(1):154–162. doi:10.1111/jdi.12854 24. Yan B, Yu Y, Lin M, et al. High, but stable, trend in the prevalence of
gestational diabetes mellitus: a population-based study in Xiamen, China.
J Diabetes Investig.2019;10(5):1358–1364. doi:10.1111/jdi.13039 25. Zhou B-F. Cooperative meta-analysis group of the working group on
obesity in China. Predictive values of body mass index and waist circum-ference for risk factors of certain related diseases in Chinese adults–study on optimal cut-off points of body mass index and waist circumference in Chinese adults.Biomed Environ Sci.2002;15(1):83–96.
26. Shao B, Mo M, Xin X, et al. The interaction between prepregnancy BMI and gestational vitamin D deficiency on the risk of gestational diabetes mellitus subtypes with elevated fasting blood glucose.Clin Nutr.2019. doi:10.1016/j.clnu.2019.10.015
27. Jia X, Li N, Gao S, et al. The impact of self-reported preconception body mass index on gestational abnormal glucose tolerance in a Chinese center. J Diabetes Complicat. 2018;32(10):951–954. doi:10.1016/j.jdiacomp.2018.07.009
28. Zheng T, Ye W, Wang X, et al. A simple model to predict risk of gestational diabetes mellitus from 8 to 20 weeks of gestation in Chinese women. BMC Pregnancy Childbirth. 2019;19(1):252. doi:10.1186/s12884-019-2374-8
29. Kawanabe S, Nagai Y, Nakamura Y, Nishine A, Nakagawa T, Tanaka Y. Association of the muscle/fat mass ratio with insulin resistance in gestational diabetes mellitus. Endocr J. 2019;66 (1):75–80. doi:10.1507/endocrj.EJ18-0252
30. Wang Y, Luo B-R. The association of body composition with the risk of gestational diabetes mellitus in Chinese pregnant women: a case-control study. Medicine. 2019;98(42):e17576. doi:10.1097/ MD.0000000000017576
31. Boyle VT, Thorstensen EB, Thompson JMD, et al. The relationship between maternal 25-hydroxyvitamin D status in pregnancy and childhood adiposity and allergy: an observational study.Int J Obes.
2017;41(12):1755–1760. doi:10.1038/ijo.2017.182
32. Facca TA, Mastroianni-Kirsztajn G, Sabino ARP, et al. Pregnancy as an early stress test for cardiovascular and kidney disease diagnosis.
Pregnancy Hypertens. 2018;12:169–173. doi:10.1016/j. preghy.2017.11.008
33. Piuri G, Ferrazzi E, Bulfoni C, Mastricci L, Di Martino D, Speciani AF. Longitudinal changes and correlations of bioimpedance and anthropometric measurements in pregnancy: simple possible bed-side tools to assess pregnancy evolution. J Matern Fetal Neonatal Med. 2017;30(23):2824–2830. doi:10.1080/ 14767058.2016.1265929
34. Kugananthan S, Gridneva Z, Lai CT, et al. Associations between maternal body composition and appetite hormones and macronutri-ents in human milk.Nutrients.2017;9:3. doi:10.3390/nu9030252 35. Gridneva Z, Kugananthan S, Rea A, et al. Human milk adiponectin
and leptin and infant body composition over thefirst 12 months of lactation.Nutrients.2018;10(8):1125. doi:10.3390/nu10081125 36. Wang N, Ding Y, Wu J. Effects of pre-pregnancy body mass index
and gestational weight gain on neonatal birth weight in women with gestational diabetes mellitus. Early Hum Dev. 2018;124:17–21. doi:10.1016/j.earlhumdev.2018.07.008
37. Hua X-G, Jiang W, Hu R, et al. Large for gestational age and macrosomia in pregnancies without gestational diabetes mellitus.
J Matern Fetal Neonatal Med. 2019; 1–10. doi:10.1080/ 14767058.2019.1578746
38. Zhao R, Xu L, Wu ML, Huang SH, Cao XJ. Maternal pre-pregnancy body mass index, gestational weight gain influence birth weight.
Women Birth.2018;31(1):e20–e25. doi:10.1016/j.wombi.2017.06.003 39. Liu Y, Li G, Zhang W. Effect of fetal gender on pregnancy outcomes in Northern China. J Matern Fetal Neonatal Med. 2017;30 (7):858–863. doi:10.1080/14767058.2016.1189527
40. Schaefer-Graf UM, Graf K, Kulbacka I, et al. Maternal lipids as strong determinants of fetal environment and growth in pregnancies with gestational diabetes mellitus. Diabetes Care. 2008;31 (9):1858–1863. doi:10.2337/dc08-0039
Diabetes, Metabolic Syndrome and Obesity: Targets and Therapy
Dove
press
Publish your work in this journal
Diabetes, Metabolic Syndrome and Obesity: Targets and Therapy is an international, peer-reviewed open-access journal committed to the rapid publication of the latest laboratory and clinicalfindings in the fields of diabetes, metabolic syndrome and obesity research. Original research, review, case reports, hypothesis formation, expert opinion
and commentaries are all considered for publication. The manu-script management system is completely online and includes a very quick and fair peer-review system, which is all easy to use. Visit http://www.dovepress.com/testimonials.php to read real quotes from published authors.
Submit your manuscript here:https://www.dovepress.com/diabetes-metabolic-syndrome-and-obesity-targets-and-therapy-journal
Diabetes, Metabolic Syndrome and Obesity: Targets and Therapy downloaded from https://www.dovepress.com/ by 118.70.13.36 on 27-Aug-2020