MULTILAYER THIN FILM OPTICAL BIOSENSORS
by
Vinay K. M. Pampapathi
a thesis submitted to
University of London
fo r the degree o f
Doctor of Philosophy
in
Electrical and Electronic Engineering
Department of Electrical and Electronic Engineering University College London
ProQuest Number: 10042827
All rights reserved
INFORMATION TO ALL USERS
The quality of this reproduction is dependent upon the quality of the copy submitted. In the unlikely event that the author did not send a complete manuscript and there are missing pages, these will be noted. Also, if material had to be removed,
a note will indicate the deletion.
uest.
ProQuest 10042827
Published by ProQuest LLC(2016). Copyright of the Dissertation is held by the Author. All rights reserved.
This work is protected against unauthorized copying under Title 17, United States Code. Microform Edition © ProQuest LLC.
ProQuest LLC
789 East Eisenhower Parkway P.O. Box 1346
_____________________________________________________________________Abstract
ABSTRACT
This thesis describes a planar optically resonant multilayer thin film device and discusses its application as an evanescent field fluorescence immunosensor. Previous workers have used multiple total internal reflection (TIR) techniques and both monomode and multimode waveguides for planar evanescent field fluorescence immunosensing. TIR methods give poor sensitivities (insufficient for many analytes of clinical interest) due to low evanescent field strengths and high background levels whereas efficient and reproducible exciting light coupling into planar waveguides presents a major instrument design problem. Optically resonant multilayer devices offer the high evanescent field strengths and low penetration depths of waveguide devices whilst retaining the ease of input coupling of TIR devices. Multilayer devices also offer the prospect (as do waveguide devices) of surface patterning using techniques such as photolithography, to allow mutiple-analyte measurements on a single device.
The theory of multilayer systems is briefly described followed by the fabrication of the multilyer devices using sol-gel silica and iron phosphate thin films - chosen because they allowed the inexpensive deposition of thin films from solution by dip and spin coating techniques. The multilayer devices were characterised by combining theory with observed resonance measurements, which allowed the refractive indices of the thin film materials to be estimated.
The model assay was a fluorescence immunoassay for mouse-IgG in a buffer solution. The multilayer device gave a seven-fold sensitivity improvement over a TIR device. The assay was performed using a 633nm Helium-Neon laser and a 650nm semiconductor laser diode. The results showed that similar sensitivities could be obtained despite the five-fold lower optical power output of the laser diode.
_____________________________________________________________________ Abstract
Acknowledgements
ACKNOWLEDGEMENTS
It is a pleasure to thank my supervisor, Dr. Michael T Flanagan for his support and excellent advice throughout this work. It was also a pleasure to have worked with Dr. Andrew N Sloper with whom I had many valuable discussions and whose help in the laboratory enabled me to perform my experiments. I am grateful, too, for the help of Maurice Gillet and his colleagues in the construction o f some parts of the apparatus required for the experimental work.
I am very grateful to both Dr. Phelim Daniels and Dr. John Attridge at Serono Diagnostics Ltd. for their help, advice and support.
I would also like to thank the Science and Engineering Research Council and Serono Diagnostics Ltd. for their financial support.
There are many others who also helped towards the completion of this work, but I would like to thank Dr. Dominic Godwin in particular for taking the effort to proof read this thesis.
To Pritheeva,
Table o f contents
TABLE OF CONTENTS
ABSTRACT 2
ACKNOWLEDGEMENTS 4
ABBREVIATIONS 14
1 INTRODUCTION 16
1.1 The medical diagnostics market 16
1.2 Biosensors 17
1.3 Biosensor applications 18
1.3.1 Health care 19
1.4 Biosensor requirements 20
1.5 Discussion 23
References 25
BIOSENSOR TECHNOLOGY 28
2.1 The biological sensing layer 28
2.1.1 The antibody 30
2.2 Immunoassays 32
2.3 Signalling of specific antibody-antigen binding 34
2.3.1 Labels used in indirect homogeneous immunoassays 35
2.3.2 No-label direct homogeneous immunoassays 37
2.4 Immunoassay performance 38
2.5 Transduction in immunosensors 40
2.5.1 Electrical immunosensors 40
2.5.2 Optical immunosensors 41
2.5.2.1 The evanescent field 42
2.6 Evanescent field immunosensors 45
2.6.1 Total internal reflection (TIR) 45
Table o f contents
2.6.3 Optical waveguides 48
2.6.3.1 Optical fibre immunosensors 49
2.6.3.2 Planar waveguide immunosensors 50
2.6.4 Sensitivities of direct and indirect sensing methods 52
2.6.5 The fluorescence capillary fill device 52
2.7 Enhancing evanescent field immunosensors 53
2.7.1 Signal strength enhancement 53
2.7.2 Signal-to-background ratio enhancement 54
2.7.3 Signal-to-noise ratio enhancement 55
2.8 Conclusions 56
References 57
PROJECT OBJECTIVES AND MULTILAYER THIN FILM SENSORS 63
3.1 Project objectives 63
3.2 Optically resonant multilayer thin film devices 64
3.3 Thin film fabrication methods and materials 68
3.3.1 Fabrication techniques 68
3.3.2 Materials 70
3.3.2.1 Sol-gel films 70
3.3..2.1 Metal phosphate films 72
3.4 Discussion 73
References 74
OPTICS OF MULTILAYER THIN FILM SYSTEMS 77
4.1 Abbreviations 77
4.2 Plane waves 78
4.2.1 Reflection and transmission at a single interface 78
4.2.2 The fresnel reflection and transmission coefficients 79
Table o f contents
4.2.4 Power flow across the interface 83
4.3 Thin layers and stratified systems 84
4.3.1 The method of successive field summations 84
4.3.2 The matrix method 88
References 90
EXPERIMENTAL MATERIALS AND METHODS 92
5.1 Computer modelling 92
5.1.1 The multilayer thin film system 92
5.1.2 The immunosensor 92
5.1.3 Antibody-antigen binding 93
5.2 Thin film fabrication and characterisation 93
5.2.1 Chemicals 93
5.2.2 Substrates and substrate preparation 93
5.2.3 Coating solution preparation 95
5.2.4 Spin coating 95
5.2.4.1 The spinner 95
5.2.4.2 Thin film deposition 97
5.2.5 Curing 97
5.2.5.1 Silica films 98
5.2.5.2 Metal phosphate films 99
5.2.6 Deposition of multiple layers 99
5.2.7 Film thickness measurement 100
5.2.7.1 Metal phosphate films 100
5.2.7.2 Silica films 100
5.2.8 Capillary fill device (CFD) 103
5.2.9 Experimental apparatus 105
5.2.9.1 The light source 106
5.2.9.2 Prism/CFD arrangement 107
Table o f contents
5 2 .9 A Angular scans 109
5.2.10 Multilayer system characterisation 110
5.2.10.1 Thin film refractive index estimation 110
5.2.10.2 The nile blue solution 112
5.3 Immunosensing experiments 115
5.3.1 The immunoassay 115
5.3.2 Chemicals 117
5.3.3 Multilayer thin film preparation 117
5.3.4 Capture IgG immobilisation 117
5.3.5 CFD assembly 119
5.3.6 The labelled antibody 119
5.3.6.1 Allophycocyanin 119
5.3.6.2 CY5.18 121
5.3.6.3 Labelling of antibody with CY5.18 dye 121
5.3.7 Immunosensing measurements 122
References 124
6 MULTILAYER THIN FILM SYSTEMS 127
6.1 Multilayer thin film system modelling 127
6.1.1 Modelling considerations 128
6.1.2 Computer programming 129
6.1.2.1 Simplex maximum search routine 129
6.1.3 The single interface total internal reflection system 131
6.1.4 The four layer resonant system 133
6.1.4.1 Thin film thickness dependence 137
6.1.4.2 Thin film refractive index dependence 142
6.1.5 The five layer resonant system 144
6.1.6 Discussion 146
6.2 Multilayer thin film system characterisation 148
Table o f contents
6.2.2 Iron phosphate film spin coating 151
6.2.3 Film thickness uniformity 153
6.2.4 Optical resonance in the four layer system 154
6.3 Thin film refractive indices estimation 156
6.4 Discussion 160
References 162
MULTILAYER THIN FILM OPTICAL IMMUNOSENSORS 165
7.1 Devices for immunosensing 165
7.1.1 Multilayer thin film sensor specification 165
7.1.2 Total internal reflection sensor specification 167
7.1.3 The capillary fill device 168
7.2 Capture antibody immobilisation 168
7.3 The model immunoassay 172
7.3.1 Fluorescence excitation, collection and measurement 172
7.3.2 The sample and reference solutions 173
7.3.2.1 The sample solution 173
7.3.2.2 The reference solution 174
7.3.2.3 Signal normalisation 174
7.4 Multilayer thin film immunosensors 175
7.4.1 Immunosensor signal time response 175
7.4.1.1 Immunosensor signal levels 176
7.4.2 Immunosensor angular scans 178
7.4.2.1 Multilayer thin film immunosensor 178
7.4.2.2 Total internal reflection immunosensor 187
7.4.3 Immunosensor dose response 190
7.5 Discussion 193
Table o f contents
THEORETICAL MODELLING OF THE IMMUNOSENSOR 198
8.1 Antibody-analyte binding 198
8.1.1 Theory 198
8.1.2 Application to observed data 200
8.2 Theoretical considerations 203
8.2.1 The incident light beam 203
8.2.2 The multilayer immunosensor system 204
8.2.2.1 The solution layer 204
8.2.2.2 The protein layer 206
8.2.2.3 The waveguide layer thin film thickness 208
8.2.3 The TIR immunosensor system 211
8.2.4 Fitting theory to the observed data 211
8.2.4.1 The immunosensor signal components 211
8.2.4.2 The theoretical immunosensing signal 213
8.2.5 Constraints on the distribution o f scattering/fluorescing points 214 8.2.5.1 Constraints between the reference and sample cells 214
8.2.5.2 Constraints between separate devices 215
8.2.5.3 Exciting light input coupling efficiency 215
8.3 Fitting to the multilayer immunosensor data 216
8.3.2 Fitting results 216
8.3.2.1 Helium-neon (633nm) laser, allophycocyanin label 217
8.3.2.2 L^ser diode (650nm), allophycocyanin label 221
8.4 Fitting to the TIR immunosensor data 225
8.4.1 Fitting results 225
8.4.1.1 Helium-neon (633nm) laser, allophycocyanin label 226
8.4.1.2 L^ser diode (650nm), allophycocyanin label 230
8.5 Re-designing the immunosensor 233
8.6 Discussion 235
8.6.1 Antibody-analyte binding 235
8.6.2 Thin film fabrication 236
Table o f contents
8.6.4 Comparison of 633nm and 650nm lasers 238
8.6.5 Scope of the theoretical model 238
References 240
DISCUSSION 242
9.1 Introduction 242
9.2 Multilayer thin films 244
9.2.1 Design considerations 244
9.2.1.1 Thin film refractive indices 244
9.2.1.2 Thin film layer thicknesses 245
9.2.2 Fabrication considerations 245
9.2.2.1 Thin film materials 245
9.2.2.2 Film thickness variations 247
9.2.2.3 Thin film deposition 247
9.3 Multilayer thin film optical immunosensors 248
9.3.1 The immobilised capture layer 248
9.3.2 Immunosensor performance 249
9.3.2.1 Sensor response 249
9.3.2.2 Sensor sensitivity 249
9.3.2.3 Signal referencing 253
9.3.3 Comparison of exciting laser light sources 253
9.3.4 Comparison of the fluorescent labels 254
9.3.5 General use of the multilayer sensor 254
9.4 Immunosensor modelling 255
9.4.1 Scope of model 255
9.4.2 Results of immunosensor modelling 256
9.4.2.1 Antibody-antigen binding 256
9.4.2.2 Signal sources 256
9.4.3 Achievements of modelling the immunosensor 258
Table o f contents
9.5.1 Planar thin film architecture 259
9.5.2 Immobilised capture antibody 259
9.5.3 The immunoassay 260
9.5.4 The multilayer immunosensor 260
References 262
APPENDIX 1
A1 ELECTROMAGNETIC WAVE THEORY OF PLANE WAVES 267
A 1.1 Abbreviations 267
A 1.2 Basic electromagnetic theory 268
A l.2.1 Maxwells equations 268
A l.2.2 Time harmonic electromagnetic fields 268
A l.2.3 The electromagnetic wave equation 269
A 1.2.4 Plane wave solutions 271
A l.2.5 Power flow in an electromagnetic wave 272
A 1.3 Reflection and transmission at an interface 273
A l.3.1 Boundary conditions at a dielectric interface 273
A l.3.2 Reflection and transmission 273
A l.3.3 The reflection and transmission coefficients 275
A l.3.4 Total internal reflection 279
Abbreviations
ABBREVIATIONS
£ electric permittivity. A-ab Absorption wavelength.
Agx Excitation wavelength.
Emission wavelength.
|i magnetic permeability.
APC Allophycocyanin.
BSA Bovine serum albumin.
CFD Capillary fill device.
CVD Chemical vapour deposition. DNA Deoxyribose nucleic acid.
ELISA Enzyme linked immunosorbent assay. FET Field effect transistor.
FCFD Fluorescence capillary fill device.
hCG Human chorionic gonadotropin.
HeNe Helium-Neon.
IgG Immunoglobulin G.
LED Light emitting diode.
MW Molecular weight.
PBS Phosphate buffered saline. PMT Photomultiplier tube. PTFE Polytetrafluoroethene.
RI Refractive index.
RNA Ribose nucleic acid,
rpm Revolutions per minute.
SPR Surface plasmon resonance.
TE Transverse electric polarisation. TIR Total internal reflection.
TM Transverse magnetic polarisation.
Introduction_________________________________________________________Chapter 1
CHAPTER 1
INTRODUCTION
This chapter provides an overview o f biosensors - their applications and requirements. Considerations concerning the design and development o f sensors are discussed and the PhD project objectives are very briefly outlined.
1.1 THE MEDICAL DIAGNOSTICS MARKET
There is an ever-increasing feeling in the medical community that prevention of the many physical ailments that affect people is better and more cost-effective than curing the problems [1]. This policy requires early detection of the symptoms (infection, hormone deficiency, etc.) or in some cases (such as congenital abnormalities and inherited diseases) detection of possible future problems before there are any visible symptoms. Thus, there is a great emphasis on the development of better diagnostic techniques that can give rapid, accurate analyses at ever-lower detection limits.
Introduction_________________________________________________________Chapter 1
the test (assay) can then be performed, and the results conveyed back to the patient's doctor or the patient. It has been noted that, while an assay may take a few minutes, sorting and preparation of the sample and transport to and from the laboratory may take
2V2 hours [2]. When the sample is taken by a GP, who has no direct access to any testing facilities, the delay may be of the order of days. These delays may, at worst, seriously compromise patient care, but it certainly does not help the 'prevention is better than the cure' objective. Ideally, a clinical testing instrument is required that needs minimal sample manipulation, provides rapid, accurate, reproducible results, can be used for a wide range of analytes and is relatively inexpensive.
The development of automated assay systems which remove the washing and reagent addition steps [4, 5] have made some progress towards simplifying the testing process. However, these instruments still require regular maintenance and calibration, and are certainly not cost-effective enough to be moved away from a central laboratory [5] and, hence, there is no real improvement in the delays involved in conducting the tests. Biosensors are initially being developed to fill this market niche and (considering medical applications) are particularly aimed at providing a cost-effective means of de centralizing clinical testing whilst attempting to retain the sensitivities of currently available products.
1.2 BIOSENSORS
Introduction Chapter 1
Transducer
Biological sensing layer
Add analyte
Signal
No signal
Fig. 1.1 The Biosensor [6].
useful in sensor systems. It is, however, necessary to combine the biological component with a transducer (see fig. 1.1) which produces a physical signal, corresponding to the concentration of the analyte, that can be easily quantified (eg. electrical, optical, acoustic).
1.3 BIOSENSOR APPLICATIONS
Introduction Chapter 1
Health care Diagnostics [8].
Clinical testing.
Bedside/Doctor's surgery. Intensive care units [9]. Continuous monitoring [10].
Closed loop systems (eg. diabetic insulin administration) [10]. Process Control Fermentation [11].
Closed loop production controls. Environmental Pollution control/monitoring [19].
Agriculture (fertiliser/pesticide control) [20]. Industrial waste management.
Pharmaceutical Drug monitoring/control.
Food and Drink Production control.
Freshness testing [21]. Additives monitoring.
Veterinary Diagnostics, etc.
Military Infectious agent and toxin detection
Table 1.1 Possible future biosensor applications.
testing (a market that is currently estimated to be worth 4000 million US$ in Europe alone in 1993 [6]). Veterinary and agricultural applications will also form an important market (up to a combined 25% share) followed by industrial process control and environmental monitoring applications. It has been estimated that the global biosensor market will be worth up to 350 million US$ by 1996 [7].
1
.3.1
Health careIntroduction______________________________________________________Chapter 1
o f skill, or experience to use. This is due to the fact that many of the kits and equipment require the addition of various reagents during the assay procedure or include washing steps that must be performed correctly and in the required order to obtain an accurate or correct result. Thus, most clinical testing is carried out in centralised laboratories by experienced personnel which places a time delay between taking a sample and obtaining a result.
Biosensors are, thus, being aimed at applications that would allow a nurse, GP or a patient to perform a measurement at the bedside, in the doctor's surgery or at home, reducing many of the delays. These biosensors will be used by relatively inexperienced personnel and therefore, need to be very simple to use; eg. requiring no more than the addition of the relevant sample and they will also need to incorporate any necessary reference or calibration measurements. This de-centralization o f testing and the use of biosensors by inexperienced personnel places certain conditions on the design and requirements of a biosensor device (eg. safety aspects, instrument size and cost).
1.4 BIOSENSOR REQUIREMENTS
Table 1.2 lists the requirements that a commercial biosensor may be required to meet, some of which will be discussed in further detail below.
Introduction Chapter 1 Sensor device Environmental stability. Accuracy, reproducibility. Calibration/reference. Sensitivity. Dynamic range.
Speed of response.
eg. pH and temperature sensitivity Are variations significant?
Automatic or user calibration?
Is detectable limit sufficient for analyte? Is measurement range wide enough for all analyte concentrations.?
Ideally, a few minutes. Instrument Reliability.
Safety.
Ease of use. User-friendliness. Costs.
eg. maintenance requirements and lifetime.
Risks of contamination, cross-infection, chances and consequences of false results.
Sample manipulation or reagent addition? Is instrument operation straightforward? What are the capital and running costs?
Table 1.2 Considerations when designing a marketable biosensor.
to be stable in a range of environments.
Typical analytes of clinical interest are: drugs; metabolites; hormones; enzymes; large proteins and even whole viruses, bacteria or cells. These vary considerably in their size from a molecular weight of -1 0 0 daltons (eg. pesticides) to a few thousand daltons (hormones) to several hundred kilodaltons (eg. antibodies, DNA fragments). Analytes such as viruses and bacteria are very large and complex and are better measured in terms of their physical dimensions. It is conceivable that a single sensor technology could be used to detect all the above analytes but, more likely is that different sensor technologies will be more suited to different analytes.
Introduction Chapter 1
I
u W)►
3
-2
-4 -6 ■ -8 --10 -12 -14I
Key to analytes
A Glucose [14] B Theophylline [15] C Thyroxine [16] D Cortisol [17] E D igoxin[18] F Testosterone[19]
G Human Chorionic Gonadotropin [20] H Calcitonin [17]
B C D E F
Analyte (see key)
G H
Fig. 1.2 Typical concentrations and dynamic ranges o f some clinical analytes.
Typical sensitivities required for clinical analytes range from concentrations of ImM to less than IpM (see fig. 1.2). Fig. 1.2 also shows the dynamic ranges that are required of clinical analytes. These are typically about three orders of magnitude, but can be as low as a single order o f magnitude or, sometimes, greater than four. It is, thus, unlikely that a single biosensor technology will be applicable for all analytes, but more likely that a biosensor can be 'tuned' for use on a range of analytes requiring similar sensitivities and dynamic ranges.
Introduction_________________________________________________________Chapter 1
addition, running costs need to be kept down as well becuase the sensors are likely to be single use disposable devices. Safety is also a prime consideration, not only in preventing physical harm to the user but also psychological harm. It has been shown that as many as 50% of the general population readily interpret the results o f 'at home' pregnancy testing kits incorrectly [23]. The reasons for this were user error, misleading instructions or bad kit design, but false results, whether due to user or equipment error, may be highly stressful to the patient.
1.5 DISCUSSION
When designing a biosensor there are a number of factors that need to be considered:
what market is the biosensor aimed at? which analytes will the sensor be used for?
what sensitivity and dynamic range will be required of the sensor? which media is the measurement to be made in?
what are the safety aspects?
what reference or calibration measurements are required? what will be the likely cost?
Once these questions have been answered, it is possible to design a biosensor to meet the requirements - for example, a biosensor for the clinical diagnostics market will need to be highly reliable, highly accurate and produce reproducible results, whilst a similar sensor for environmental applications may not be so heavily constrained.
Introduction_________________________________________________________Chapter 1
sensor that will be a single-use disposable device. Detection of the specific binding was done by measuring the fluorescence emitted by the sensing biological molecule labelled with an approriate fluorophore. The biosensor incorporated only one reference measurement but it is possible to fabricate the sensor so that multiple reference measurement or multiple analyte detection can be done.
Introduction_________________________________________________________ Chapter 1
REFERENCES
1 RASAIAH B, Role of home and clinic testing in health care, Clinical Biochemistry, 1993, 26, 15-17.
2 ZALOGA G P, Evaluation of bedside testing options for the critical care unit, Chest, 1990, 97, 185S.
3 ANONYM OUS, Label-free technology visualizes biomolecular interactions in real time.
Biosensors & Bioelectronics, 8(2), xi - xiv.
4 CAM ARA P D et al. Evaluation of the Boehringer Mannheim ES300 immunoassay analyzer and comparison with enzyme immunoassay, fluorescence polarization immunoassay, and radioimmunoassay methods. Clinical Biochemistry, 1992, 25, 251-254.
5 M cCANN J, Exploiting biosensors, in TURNER AFF, KARUBE I, W ILSON G S eds., Biosensors: Fundamentals and applications, Oxford University Press, New York, 1987, 1st ed., 737-746.
6 HALL E A H, Biosensors, Open University Press, Milton Keynes, 1990, 1st ed., p p 6, 3.
I ANONYM OUS - 'BIOELECTRONICS UPDATE*, Biosensors & Bioelectronics update.
Biosensors & Bioelectronics, 1992, 7(9), 606-607.
8 BLUESTEIN B I, W A L C Z A K I M, CHEN S-Y, Fiber optic evanescent wave immunosensors for medical diagnostics, TIBTECH, 1990, 8, 161-168.
9 ALCOCK S J, DANIELSSON B, TURNER A P E , Advances in the use of in vivo sensors.
Biosensors & Bioelectronics, 1992, 7, 243-254.
10 TURNER A P E , PICKUP J C, Diabetes mellitus: biosensors for research and management.
Biosensors, 1985,1, 85.
II SCHEPER T, Biosensors for process monitoring. Journal o f Industrial Microbiology, 1992, 9, 163-172.
12 YAO S H, Chemistry and potential methods for in vivo glucose sensing, in WISE D L ed.. Bioinstrumentation and Biosensors, M arcel Dekkerlnc., New York, 1991, 1st ed., pp229.
13 St. LOUIS P 3 et at, An evaluation of the Kodak Ektachem clinical chemistry slide for theophylline. Therapeutic Drug Monitoring, 1989,11, 93-96.
14 JAEEE B M, BEHRM ANN H R eds.. Methods of hormone radioimmunoassay. Academic Press Inc., London, 1979, 2nd ed., ppl008.
15 Various immunoassay methods, fi/ogenem
16 BOCHNER E et at. Handbook of clinical pharmocology. Little, Brown & Co., Boston, 1983, 2nd ed..
17 GOW ER D B, Steroid hormones, Croom Helm, London, 1979, 1st ed., pp61.
Introduction_________________________________________________________Chapter 1
19 ROGERS K R, LIN J N, Biosensors for environmental monitoring, Biosensors & Bioelectronics, 1992, 7, 317-321.
20 BIER F F e f a/, Use of a fiber optic immunosensor for the detection of pesticides, Sensors and Actuators B, 1992, 7, 509-512.
21 W ATANABE E, TANAKA M , Determination of fish freshness with a biosensor system, in WISE D L ed., Bioinstrumentation and Biosensors, M arcel Dekkerlnc., New York, 1991, 1st e d , pp39. 22 M ANNING B, MALEY T, Immunosensors in medical diagnostics - major hurdles to commercial
success. Biosensors & Bioelectronics, 1992, 7, 391-395.
Biosensor technology________________________________________________ Chapter 2
CHAPTER 2
BIOSENSOR TECHNOLOGY
Biosensors, referring to chapter 1, fig, 1.1, combine a biological sensing layer with a physical transducer. This chapter provides a critical assessment, in the context o f the discussions o f chapter 1, o f the biological materials available fo r the sensing layer and also o f the various transduction methods that are being employed. However, the emphasis is on evanescent field optical immunosensors as these are most directly relevent to the sensors that are the subject o f this thesis. Finally, there is a discussion o f some o f the problems encountered with optical immunosensing systems and some of the improvements that could be considered or incorporated to tackle these problems.
2.1 THE BIOLOGICAL SENSING LAYER
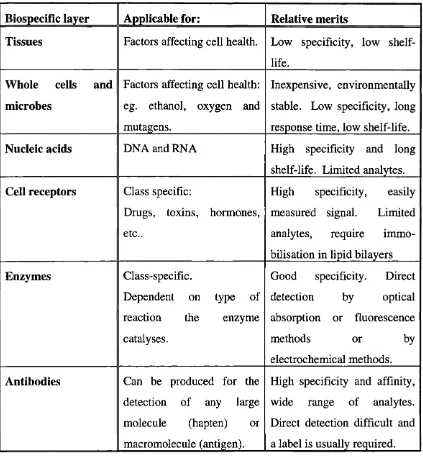
Table 2.1 lists the possible biological components of a biosensor together with the analytes that they can be used to detect and their relative advantages or disadvantages.
Biosensor technology Chapter 2
Biospecific layer Applicable for: Relative merits
Tissues Factors affecting cell health. Low specificity, low
shelf-life.
Whole cells and
microbes
Factors affecting cell health: eg. ethanol, oxygen and mutagens.
Inexpensive, environmentally stable. Low specificity, long response time, low shelf-life.
Nucleic acids DNA and RNA High specificity and long
shelf-life. Limited analytes.
Cell receptors Class specific:
Drugs, toxins, hormones, etc..
High specificity, easily measured signal. Limited analytes, require immo bilisation in lipid bilayers
Enzymes Class-specific.
Dependent on type of
reaction the enzyme
catalyses.
Good specificity. Direct
detection by optical
absorption or fluorescence
methods or by
electrochemical methods.
Antibodies Can be produced for the
detection of any large
molecule (hapten) or
macromolecule (antigen).
High specificity and affinity, wide range of analytes. Direct detection difficult and a label is usually required.
Table 2.1 The biospecific component o f a biosensor.
Biosensor technology________________________________________ Chapter 2
Cell receptor proteins [4]. Despite their high selectivity, affinity and the production of a readily measurable signal, these sensors have a major drawback in their stability. It has been difficult to isolate and immobilise the receptor proteins whilst retaining their activity. Most current receptor-based sensors need to immobilise the proteins in a lipid bilayer [5] or use the receptors present in their natural host. This factor may render receptor-based sensors commercially non-viable.
Enzymes [6]. Enzymes act as catalysts for chemical reactions (changing a 'substrate' into its products) within living organisms and are class-specific (according to the type of reaction they catalyse). Enzymes have found widespread use in assays and biosensor devices because they are capable of producing a readily measurable signal (eg. electric current, colour changes, etc). Although enzymes can only be used directly for the detection of the presence of their substrate, they can be used indirectly as labels in other biosensing systems [7]. However, the limited range of analytes that enzymes can detect directly has prevented a more widespread use.
2.1.1 The antibody
Biosensor technology Chapter 2
Carbohydrate
Heavy chain
Disulphide bond
Light chain Antigen
binding sites
Variable region
Fig. 2.1 The basic structure ofIgG [10] (molecular weight ~ 160000). The molecule has a number o f constant portions (dark shade) that do not vary between IgG. The variable regions (light shade) at the end o f each arm are specific fo r the antigen.
Biosensor technology_________________________________________________ Chapter 2
association constant typically in the range 10% to 10^^ M ^ Monoclonal antibodies are preferred to polyclonal antibodies in assays because o f their well defined characteristics, high specificity and high binding affinity for the antigen, and also because of the inexhaustible production.
The dissociation rate constants of antibody-antigen complexes are generally very low (10% to lCf4 s'l) because of their high association constants, but it is possible to dissociate the antibody-antigen complex (which is performed, for example, during the production and purification of antibodies [12]). The process, however, is too complex, (sometimes reducing the activity of the antibody) for it to be incorporated into most commercial immunosensors, and so most immunosensors are likely to be single-use disposable devices. This is the case for the immunosensors discribed in this thesis.
2.2 IMMUNOASSAYS
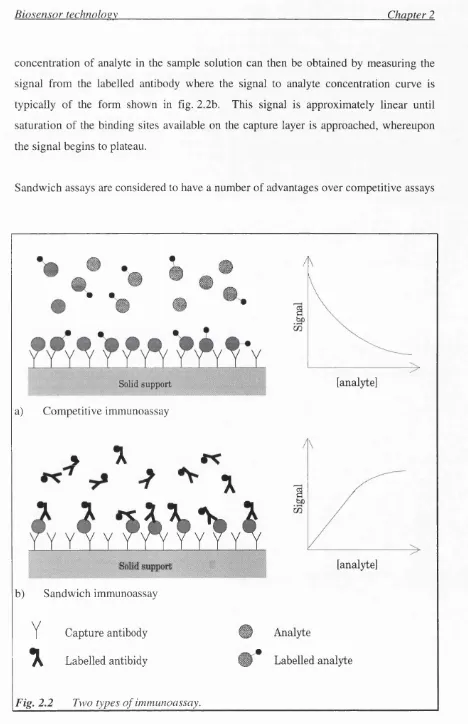
There are two major types of immunoassays that are applicable to and most commonly used in immunosensors. These are illustrated in fig. 2.2. Note that both techniques require the immobilisation, on a solid support, of an antibody specific for the analyte being quantified. The immobilised layer is typically termed the 'capture layer'.
Competitive immunoassay. A known quantity of labelled analyte is added to the sample solution and the labelled and sample analytes compete for binding sites on the capture antibody layer. The amount of labelled analyte binding to the capture antibodies is inversely proportional to the sample analyte concentration, giving a signal to sample analyte concentration curve as shown in fig. 2.2a.
Biosensor technoloev Chapter 2
concentration of analyte in the sample solution can then be obtained by measuring the signal from the labelled antibody where the signal to analyte concentration curve is typically of the form shown in fig. 2.2b. This signal is approximately linear until saturation of the binding sites available on the capture layer is approached, whereupon the signal begins to plateau.
Sandwich assays are considered to have a number of advantages over competitive assays
• * - , • , •
'
*•
•
*•
S\
a) Competitive immunoassay
»
A
-f
\
1
Y^ Y * ? A '^ 7 ^ Y ^
[analyte]
\
'' M dmppo# ' '
r
[analyte]b) Sandwich immunoassay
Y
Capture antibody®
Analyte##
•A
Labelled antibidy®
Labelled analyteBiosensor technology Chapter 2
(eg. linear response, wider working range, higher precision and sensitivity [13]). Sandwich assays also require shorter reaction times and the use of two different antibodies may give a higher specificity. One drawback of sandwich assays is the necessity for two binding sites on the analyte which limits its use in the assay o f small haptens. A sandwich assay was used in the immunosensors described in this thesis, but competitive assay techniques could also have been used.
2.3
SIGNALLING OF SPECIFIC ANTIBODY-ANTIGEN BINDINGImmunoassays (both competitive and non-competitive) can be broadly classed into four categories under the terms: heterogeneous; homogeneous; direct and indirect as illustrated in table 2.2.
Signal measurement in a heterogeneous immunoassay is done after the sample solution (containing potentially interfering background proteins and labelled material) has been removed by washing steps, leaving the bound layer in a known environment. The signal, thus measured, would be free of any background signals from the sample solution. However, as discussed in chapter 1, many commmercial immunosensors will require the elimination of any washing steps, and thus signal measurement will need to be performed in the presence of an interfering sample solution. Thus, heterogeneous immunoassays are not applicable to commercial immunosensors and so will not be
Heterogeneous Homogeneous
Direct Requires washing/separation steps. No labelled reagent addition.
No washing/separation steps. No labelled reagent addition. Indirect Requires washing/separation steps.
Requires labelled reagent addition.
No washing/separation steps. Requires labelled reagent addition.
Biosensor technology_________________________________________________Chapter 2
discussed further.
In homogeneous immunoassays, the signal measurement is made in the presence o f the sample solution. The measurement can be 'direct' (no labels) or 'indirect' using appropriate labels.
2.3.1
Labels used in 'indirect' homogenous immunoassays
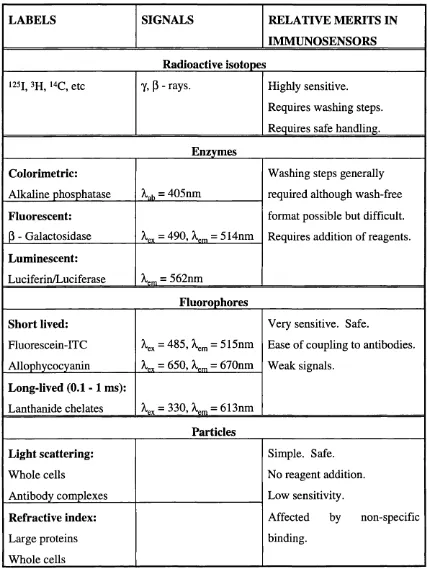
The typical labels available for use in indirect immunoassays are listed in table 2.3.
Radioisotopes.
Radioimmunoassays have achieved very high sensitivities (in thefemtomolar range [9]) but have a number of drawbacks when considered for immunosensors. Radioimmunoassays, in general, require washing steps for the separation of the bound layer from the sample solution, although wash-free assays have been reported [14]. There are also many safety aspects involved in the handling of radioactive materials which, together with the costs of disposal, make them unsuitable for immunosensor use.
Enzymes.
Enzyme immunoassays are usually colorimetric (measurement of opticalabsorption or colour changes) but it is also possible to use fluorescence, luminescence or electrochemical methods. Enzyme immunoassays can also be performed in a wash-free format [15]. However, such assays still require the addition of reagents such as the enzyme substrate or inhibitor, thus introducing extra steps that would need to be avoided when considering the commercial development of immunosensors.
Fluorophores.
Fluorophores were originally used as alternatives to radio-isotopesBiosensor technology Chapter 2
intrinsic fluorescence of proteins which would contribute to background signal (this
LABELS
SIGNALS
RELATIVE MERITS IN
IMMUNOSENSORS
Radioactive isotopes
1251, m , 14C, etc Y, P - rays. Highly sensitive.
Requires washing steps. Requires safe handling.
Enzymes
Colorimetric;
Alkaline phosphatase = 405nm
Washing steps generally required although wash-free format possible but difficult. Requires addition of reagents.
Fluorescent:
P - Galactosidase ~ 490, = 5 14nm
Luminescent:
Luciferin/Luciferase Km = 562nm
Fluorophores
Short lived:
Fluorescein-ITC Allophycocyanin
^ex = 485,^^^ = 515nm
= 650, = 670nm
Very sensitive. Safe.
Ease of coupling to antibodies. Weak signals.
Long-lived (0.1-1 ms):
Lanthanide chelates = 330, = 613nm
Particles
Light scattering:
Whole cells
Antibody complexes
Simple. Safe. No reagent addition. Low sensitivity.
Affected by non-specific binding.
Refractive index:
Large proteins Whole cells
Biosensor technology____________________________________________ Chapter 2
factor is particularly important in wash-free assay formats). The major problems with fluorescence immunoassay are caused by background fluorescence (from unbound labelled antibody), scattered exciting light and fluorescence quenching (by the sample solution) [16]. However, the advantages of using fluorophores in immunosensors has led to much interest being shown in their development. The optical immunosensors described in this thesis used fluorophores (allophycocyanin: = 650nm, = 660nm; and CY5.18 cyanin dye: X^^ = 650nm, = 670nm) as the labels. Allophycocyanin and CY5.18 were chosen because they can be excited by both a 632nm HeNe laser and a 650nm semiconductor diode laser thus allowing comparison of the two lasers as excitation sources.
Magnetic particles have been used as labels to aid the separation of the antibody-analyte complex from the bulk solution. However a second labelled antibody is still required to provide the measurable signal [17]. Antibodies bound to latex microspheres have been employed in light scattering immunoassays [68]. However, the application of this technique in a biosensor device has not been greatly investigated and it is unlikely that it will offer sufficient sensitivity.
2.3.2
No-label 'direct' homogeneous immunoassays
Biosensor technology_________________________________________________Chapter 2
22], However, intrinsic effects can often be too weak to measure effectively and immunosensors using direct detection methods are more likely to be affected by non specific binding [23] which gives rise to a background signal that is often dependent on the sample solution environment. For example, the presence of any electroactive species will affect the results of an electrochemical sensor and the presence o f large proteins or whole cells may greatly affect the results of the refractive index and mass loading methods.
2.4 IMMUNOASSAY PERFORMANCE
Prior to the discussion of immunosensors in general and immunosensor transduction methods in particular, the means by which the performance of a particular assay (or immunosensor) can be assessed are considered. There seems to be great deal of confusion in the definition of the terms by which an assay performance can be described: sensitivity, detection limit, precision, accuracy, dynamic (working) range are all used liberally in publications, often with inadequate or ambiguous definitions. Throughout the following text and the rest of the thesis, the following definitions (according to Ekins [24]) will be used.
Precision. This is equivalent to accuracy and can be defined as the minimum detectable difference (MDD) between two measurements. This is not only governed by the resolution of the measuring instrument but also by the scatter of repeated measurements at a single analyte concentration. Assuming that the instrument resolution is much better than the scatter of the measured points, then the precision can be defined as shown in fig. 2.3.
Biosensor technoloev Chapter 2
Fitted sensor response
P
c
ANALYTE CONCENTRATION
Fig. 2.3 Definition o f precision and sensitivity. The shaded area represents the noise (eg. standard deviation or confidence interval fo r repeated measurements) in the system. It is then possible to define the precision (P' - C) fo r the measurement at C and the sensitivity (S) - the minimum measureable analyte concentration. Note that the noise may not be constant over the working range o f the sensor.
variations and other factors ensure that this is not possible. Sensitivity is a highly abused term being defined in many different ways by different workers, but Ekins'
definition, that sensitivity is best described by the standard deviation of the zero analyte measurement, is used in this thesis. However, because it was not possible to fabricate a large number of devices, sufficient repetitions of the zero analyte measurement could not be made and the above definition was modified to the standard deviation of the measured points from a fitted straight line. The detection limit was then taken to be the analyte concentration that gave a signal that was two standard deviations from the zero analyte signal.
Biosensor technology_________________________________________________Chapter 2
2.5
TRANSDUCTION IN IMMUNOSENSORS
Enzyme redox reactions readily produce free electrons that can contribute to a measurable current in an electrode. Antibody-antigen reactions, however, cannot be so directly monitored but can be detected by a number of methods which may be grouped into three major categories:
• Acoustic • Electrical • Optical
Acoustic.
The capture layer is immobilised onto a piezoelectric or surface acousticwave device. The binding of the analyte increases the mass loading on the surface which alters the frequency of oscillation of the device [26]. This is a direct sensor which is simple to fabricate and operate and is particularly useful in the gaseous phase or for the detection of large analytes in complex liquid environments (eg, serum) [25] or small analytes in simple liquid environments (eg. water) [69]. Although sensitivities down to the nanomolar range are theoretically possible, the measurements are greatly affected by non-specific binding and are dependent on the viscosity o f the sample solution [26], thus making acoustic sensors unsuitable for general use in complex environments.
2.5.1
Electrical immunosensors
This category can be further sub-divided into conductance [70], capacitance [71], amperometric, and potentiometric, of which only the last two have received widespread interest.
Biosensor technology_________________________________________________Chapter 2
use of electrodes across which a potential has been applied. The current generated will be some function of the concentrations of the enzyme and its substrate [6]. The simplicity o f the technique has led to the widespread use o f amperometric assays, particularly for enzyme substrates such as glucose [73], oxygen [27] and even penicillin [72]. It is possible to fabricate an amperometric immunosensor by using an enzyme as the label on the antibody [28, 38]. Although nanomolar sensitivities have been obtained [6] using enzyme immunoassays, the requirement of such sensors for the addition of reagents (enzyme sustrate, inhibitor, etc.) or the inclusion o f washing steps increases their complexity making them less commercially viable.
Potentiometric.
Most proteins, antibodies, antigens, etc. are electrically chargedmolecules and so it is feasible to fabricate an immunosensor device that is sensitive to changes in charge distribution. The most promising techniques currently being pursued make use o f the semicoductor field-effect transistor (FET) device. The gate on a conventional electronic FET is replaced by a biological capture layer in the FET biosensor. The binding of the analyte onto the capture layer changes the surface charge distribution allowing current to flow in the device. The FET devices have many advantages. They are direct sensors that are simple to fabricate by modifying existing micro-electronic fabrication techniques and, hence, it is relatively inexpensive to fabricate an array of devices, allowing easy and cost-effective inclusion o f reference and calibration measurements and also the possibility of multiple-analyte testing [29]. The major and limiting problem with potentiometric sensors, as with amperometric sensors, is one of sample solution dependence - any electro-active species present in the sample solution (eg. H+, CT or charge carrying protein) can affect the signal [30].
2.5.2
Optical immunosensors
Biosensor technology_________________________________________________Chapter 2
potentiometric sensors, are receiving most attention. The bulk of conventional clinical immunoassays use optical techniques - fluorescence [31], luminescence [32], light scattering [33], etc.. It was, thus, a logical step to attempt to modify these for use in wash-free immunosensors with the possibility of achieving the same sensitivities as the conventional optical immunoassays. It is also possible to achieve multiple analyte testing by the use of multiple labels and multi-wavelength exctitation, or by optical signal processing methods. Optical sensors are also more suitable as in-vivo sensors (using optical fibres) as they can be truly 'remote' from the measuring instrument.
The drawbacks are that signals from optical sensors are affected by ambient background light, scattered exciting light, or by unwanted signals from the sample solution or glass substrate (eg. background fluorescence and phosphorescence). Signal levels when measuring fluorescence can be very weak, thus requiring sensitive detection devices such as a photomultiplier tube (PMT) which adds to the cost of optical sensors. Commercially viable sensor technologies will require cheap disposable devices, moderately priced instrumentation and a wash-free assay format with detection limits similar to conventional optical immunoassays (ie. picomolar range). Thus, referring back to section 2.2, a suitable method is required whereby the signals from the bound layer can be discriminated from those in the bulk solution while retaining signal strength and without compromising instrument complexity. Evanescent field immunoassay techniques address this particular problem and so have received much attention. The evanescent field immunosensors that are the subject of this thesis aim to increase the signal-to-background and signal-to-noise ratios over a simple total internal reflection technique thus improving the sensitivity and detection limit.
2.5.2.1
The evanescent field
Biosensor technology Chapter 2
Incident
Evanescent
field \
Fig. 2.4 The field o f a totally internally reflected light beam, nj > 0 > 0^ the critical angle fo r total internal reflection.
interface at which total internal reflection has occurred (see fig. 2.4). Evanescent fields are, thus, also associated with waveguides (planar slab and optical fibre) and also with the oscillations of conduction band electrons at a metal/dielectric interface.
Biosensor technolosv Chapter 2
EXCITATION
i i i i
Substrate
Solution
Fluorophore
Bulk solution ^ fluorescence
Bound layer fluorescence
Fig. 2.5 Evanescent collection o f fluorescence and the discrimination o f bound layer and bulk solution flourescence.
fig. 2.5) is greater than the critical angle. Coupling into these angles is only possible for fluorophores lying close to the interface, whereas fluorophores in the bulk solution couple at lower angles of incidence. This can be used to separate bound layer and bulk sample solution fluorescence [35].
Biosensor technology_________________________________________________ Chapter 2
2.6
EVANESCENT FIELD IMMUNOSENSORS
2.6.1
Total internal reflection (TIR)
Kronick and Little [34] first demonstrated the concept of performing evanescent field excited, wash-free fluorescence immunoassays by using the evanescent field of a single reflection on the inside face o f a quartz prism to excite fluorescein labelled antibody. The competitive assay they performed for the analyte (morphine) yielded a high detection limit concentration of 200nM because of low signal levels. The detection limit was too high for many analytes (chapter 1, fig. 1.1), which require measurement in the picomolar range, and so many workers have attempted to improve it.
Sutherland et al [36] used multiple internal reflections within a microscope slide and also within an optical fibre (0.6mm diameter) to improve the signal levels. They achieved a detection limit of 270nM for an assay of the drug methotrexate when using an optical absorbtion method. However, this was dramatically improved when an evanescently excited fluorescence assay for human IgG was performed, giving detection limits of 19nM and 9.5nM for the microscope slide and optical fibre respectively. Sutherland et al claimed that their fluorescence assays were limited by background fluorescence from unbound labelled antibody lying within the evanescent field. This, as will be demonstrated in this thesis, is only part of the problem and other background signal sources such as scattering o f exciting light and phosphorescence of the glass may also be significant contributors.
Biosensor technoloQV Chapter 2
2.6.2
Surface plasmon resonance (SPR)
A surface plasmon wave is a TM polarised electromagnetic wave, supported by oscillations in the density of the conduction band electron cloud, that propagates along a metal/dielectric interface. The oscillations are heavily attenuated and, therefore, the wave propagates for only a short distance (of the order of 100pm [38]). Surface plasmons are excited when the propagation velocity of the exciting light matches that of the surface plasmon and, thus, a glass prism or a diffraction grating is required to reduce the propagation velocity of the exciting light. A surface plasmon can then be excited by varying the angle of incidence or the incident wavelength to allow the matching conditions to be met (fig. 2.6). When surface plasmon resonance occurs, most of the incident light energy is absorbed by the plasmons and then quickly lost through attenuation. Thus, the reflected light intensity shows a minimum at the angle of incidence for resonance (fig. 2.6). Fig. 2.6 shows a typical prism configuration, where the exciting light is reflected off a thin metal film (usually silver or gold). However, this configuration requires tight control over the film thickness to ensure that the evanescent
Evanescent field sample
Surface
plasmons Metal film
Prism
Exciting light
00
0Fig. 2.6 Surface plasmon resonance - 50 (difference between the resonant angles fo r the reference and sample solutions) is a measure o f the amount o f analyte bound to the
Biosensor technology______________________________ Chapter 2
field of the incident light reaches the opposite face of the metal film so that SPR can be excited on this face. An alternative to prism coupling is to use a grating patterned on the metal surface in contact with the sample solution [39]. This has the advantages that a planar substrate (instead of a prism) can be used and that it requires a less rigorous control over film thickness, but, the surface plasmons now have to be excited through the sample solution and this may lead to greater sample solution dependence.
The resonant angle is dependent on the refractive index of the dielectric material within the evanescent field of the surface plasmon wave and any alteration in this refractive index will show as a shift in the resonant angle of incidence. Thus, if a capture antibody layer is immobilised on the metal film and a sample solution containing the analyte is added, the subsequent binding of the analyte will alter the refractive index and thus the minima in the reflected light beam will shift (fig. 2.6). The change in the angle is a measure of the amount of analyte bound to the capture antibody. Surface plasmon resonance has attracted a great deal of interest due to its inherent simplicity, because it is a direct sensing technique, and because it requires relatively cheap instrumentation (eg. a photodiode to monitor the intensity of the reflected light). Daniels et al [40] achieved a detection limit of lOnM for an immunoassay for a-feto protein in phosphate buffered saline (PBS). Surface plasmon resonance based sensors have also had some, if limited, commercial success with systems such as PHARMACIA'S 'BIAcore' system [41]. However, these expensive systems still require manipulation and processing of the sample solution and as such are limited to laboratory environments.
Biosensor technology Chapter 2
protein layer [43]. To improve the performance of SPR sensors, a number of enhancements have been suggested such as the use of 'high refractive index labels', but suitable labels are not readily available, and their size and mass may unduly affect chemical kinetics. A more promising route is to use the enhanced evanescent field o f a surface plasmon wave (-1 0 times more intense than the evanescent field for TIR) to excite fluorescent labels. Such enhanced excitation of fluorescence by SPR has been demonstrated previously [44] and the technique was used by Attridge et al [23] in an immunoassay for human chorionic gonadotropin (hCG) in serum which achieved a sensitivity of 240pM (a six-fold improvement on TIR).
2.6.3
Optical waveguides
Optical waveguide sensors were developed to improve on the performance o f TIR and multiple-TIR sensors. Guided light is essentially in a resonant mode confined within the guide and so has a high associated field strength which gives rise to a high evanescent field strength outside the waveguide. The light also propagates (assuming a reflection model) at very high incident angles and, therefore, the evanescent field has a low penetration depth. The combination of a high evanescent field strength, low penetration depth and continuous interrogation (as opposed to discrete spots in TIR - see fig. 2.7) o f the sensing surface should, in theory, improve the signal-to-background ratio of waveguide sensors over TIR systems. Waveguides can be fabricated by a large variety of methods borrowed from micro-electronics and thin-film fabrication techniques, but can be broadly classed into two categories: a) optical fibres; and b)
Area excited Areas excited
b) Planar waveguide a) TIR
Biosensor technology_________________________________________________Chapter 2
J:
V
Excitation lig h t___
Emitted fluorescence
\ y
Fig. 2.8 Optical fibre fluorescence immunosensor.
planar waveguides.