T h e In tera ctio n
b e tw e e n a C om et and th e
Solar W in d
D eb b ie E llen H u d d lesto n
Mullard Space Science Laboratory
Department of Physics and Astronomy
University College London
A thesis subm itted to the University of London for the degree of Doctor of Philosophy
August 1990
All rights reserved INFORMATION TO ALL USERS
The qu ality of this repro d u ctio n is d e p e n d e n t upon the q u ality of the copy subm itted. In the unlikely e v e n t that the a u th o r did not send a c o m p le te m anuscript and there are missing pages, these will be note d . Also, if m aterial had to be rem oved,
a n o te will in d ica te the deletion.
uest
ProQuest 10797767
Published by ProQuest LLC(2018). C op yrig ht of the Dissertation is held by the Author.
All rights reserved.
This work is protected against unauthorized copying under Title 17, United States C o d e M icroform Edition © ProQuest LLC.
ProQuest LLC.
789 East Eisenhower Parkway P.O. Box 1346
2
A b str a c t
Ion ‘pickup’ is an interesting physical process which occurs when new ions are introduced into a m agnetized plasm a flow w ith a m otion relative to the bulk plasm a. T he com etary environment provides an excellent ‘labora to ry ’ in which to study such processes. Ions of com etary origin are gradually accom odated into th e solar wind flow. The rate of isotropization of the im planted ion velocity distribution in the solar wind fram e depends on the level of am bient and self-generated turb u len t waves w ith which the ions interact.
T he work presented here studies the parallel pickup process to ascertain w hether or not pitch-angle diffusion driven by the observed turbulence is fast enough to explain the development of the ion distributions. T he theoreti cal description used is based on a quasilinear approach, and considers the im plantation of com etary ions along solar wind flowlines. To m ake such a study requires some way of extrapolating our m easurem ents on th e G iotto trajecto ry into the upstream region. Models for mass-loading and turbulence are used.
A simplified mass-loading m odel provides the plasm a flow param eters which depend upon position relative to the comet, and the com etary gas emission characteristics. The tu rb u len t power spectrum is required for the diffusion coefficient of th e wave-particle interaction. Theoretical calcula tions of free energy m ade available to upstream and dow nstream propagating Alfven waves during the pickup process are used to estim ate the wave in ten sity in the region u pstream from the spacecraft track. T he spectral shape is found to be reasonably constant throughout th e region of interest.
4
C o n ten ts
A b str a c t 2
1 T h e S olar W in d 11
1.1 In tro d u c tio n : Solar System Plasm as ... 11
1.2 Expansion of the Solar Corona ... 14
1.3 “Frozen-in” M agnetic Field ... 18
1.4 Solar W ind Properties ... 21
1.5 Waves in the Solar W i n d ... 26
2 S p acecraft C o m e ta r y M issio n s 29 2.1 Spacecraft missions to Comet Hailey ... 29
2.2 T he Vega 1 and 2 Instrum ents ... 31
2.3 Suisei and Sakigake ... 34
2.4 T he G iotto Spacecraft ... 36
2.5 JPA Experim ent on G iotto ... 40
2.5.1 Fast Ion S e n s o r... 41
2.5.2 Im planted Ion S e n s o r ... 44
2.5.3 Bulk P aram eters from M oments ... 46
2.6 The G iotto M agnetom eter ... 48
2.7 IC E Mission to Giacobini-Zinner ... 51
3 C o m e t s : M issio n R e s u lts 54 3.1 Origin of Comets ... 54
3.2 S tructure of Nucleus, Com a and Tails ... 55
3.3 Production and Ionization of Gas ... 57
3.4 Plasm a Regions and B o u n d a rie s... 60
3.4.1 Regimes at Comet H a ile y ... 60
3.4.2 Plasm a Regimes at G iacobini-Z inner... 68
4 S olar W in d M a ss-L o a d in g at C o m et H a ile y 73
4.1 In tro d u c tio n : Ion M otion ... 73
4.1.1 G yration and Drift ... 73
4.1.2 F luid T h e o r y ... 76
4.1.3 Kinetic Theory ... 77
4.2 A M ass-Loading Model ... 78
4.2.1 N eutral P article D istribution ... 78
4.2.2 Perpendicular P ic k u p ... 80
4.2.3 Ion F lux ... 81
4.3 D ata A n a ly s is ... 86
4.4 Gas Emission C h a ra c te ristic s... 95
4.5 Application to Shock Profile ... 100
4.6 Sum m ary ... 104
5 P a r a lle l P ick -u p and W ave E n erg y 106 5.1 Parallel Pick-up Mechanism ... 106
5.2 Alfven Waves ... 108
5.2.1 Phase and Group Velocity ... 108
5.2.2 Alfven and Magnetosonic Modes ... 109
5.3 Velocity Diffusion and Wave G r o w th ... 114
5.4 Theoretical Calculation of Free E n e rg y ... 116
5.4.1 O ne-Particle Shell-Portion D is trib u tio n s ... 118
5.4.2 U pstream and D ow nstream Energies ... 121
5.4.3 Bispherical Bulk Velocity ... 124
5.5 Wave Energy at G iotto ... 126
5.6 Energy Released and Dam ping ... 139
5.7 Sum m ary ... 144
6 W ave S p e c tr a l A n a ly sis 146 6.1 T he Fourier Transform ... 146
6.1.1 Discrete Fourier Series ... 149
6.1.2 Power Spectrum Estim ation by F F T ... 152
6.2 Wave Spectra ... 154
6
6.2.2 Doppler Effect ... 160
6.2.3 Norm alization ... 164
6.3 Sum m ary ... 167
7 Im p la n te d C o m e ta r y Io n D is tr ib u tio n s 168 7.1 Ion Kinetic E quation ... 168
7.2 Source D is trib u tio n ... 172
7.3 Quasilinear Velocity Diffusion ... 176
7.4 Numerical A n a ly s is ... 180
7.4.1 M ethod of Solution ... 180
7.4.2 Numerical Lim itations ... 184
7.5 Im planted Ion D istributions ... 187
7.6 Sum m ary ... 206
C o n clu sio n s 20 7
A c k n o w led g em en ts 210
G lo ssa ry o f P u b lic a tio n s 211
1.1 The “ballerina” model of the heliospheric current sheet ... 18
1.2 D iagram of the “Parker spiral” ... 20
1.3 Identification of ion species in the solar w i n d ... 22
1.4 An anisotropic solar wind proton distribution ... 25
1.5 Solar wind Alfven waves ... 27
2.1 Flyby param eters for the encounters w ith comet H a ile y ... 30
2.2 Diagram to show the comet Hailey orbit ... 35
2.3 The structure of the G iotto s p a c e c ra ft... 36
2.4 Instrum ent positioning on the G iotto spacecraft ... 39
2.5 Schematic diagram of the Fast Ion S e n s o r ... 42
2.6 The 3-D angular coverage of th e JPA ... 43
2.7 The Im planted Ion Sensor layout ... 45
2.8 Functional block diagram of the fluxgate m agnetom eter ... 49
3.1 Sketch of the principle features of the comet Hailey n u c le u s 55 3.2 Geometry of com etary ion pick-up in real space ... 59
3.3 Basic regimes of the comet - solar wind interaction region ... 61
3.4 Plasm a regions identified in the electron d a ta ... 63
3.5 Plasm a flow param eters observed at H a ile y ... 65
3.6 The shock structure observed in the G iotto JPA d a t a ... 66
3.7 Schematic sum m ary of the plasm a regions at Giacobini-Zinner . . . . 69
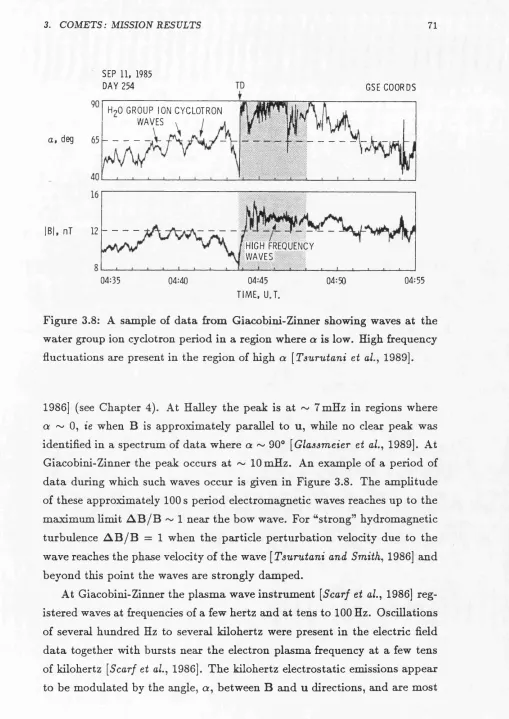
3.8 A sample of d a ta from Giacobini-Zinner showing waves present . . . 71
4.1 Com etary neutral density and ion flux for Kepler orbit and spherically symm etric models ... 80
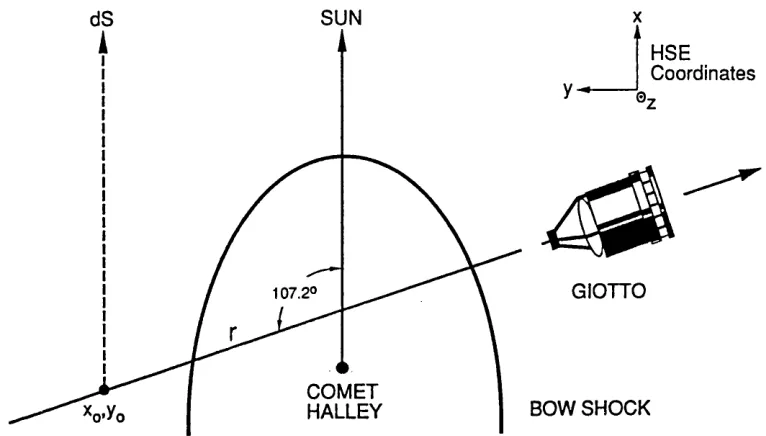
4.2 Schematic representation of the G iotto flyby in the HSE system .. 81
4.3 Solar wind proton bulk p a r a m e te r s ... 87
4.4 Smoothed solar wind speed and density profiles ... 88
4.5 Profiles of modelled param eters ... 89
8
4.7 Effect of differing gas emission v a lu e s ... 91
4.8 Illustration of an example fit to the m o d e l... 93
4.9 Set of possible s o lu tio n s ... 94
4.10 Variability of comet Hailey w ater production ra te ... 97
4.11 Pre- and post-perihelion m easurem ents of a c t i v i t y ... 98
4.12 Com parison of modelled and m easured heavy ion density ... 101
4.13 Shock profile inferred from the m o d e l... 102
5.1 Real-space and velocity-space representations of pickup geometry .. 107
5.2 Phase space velocity versus propagation angle for MHD wave modes ... 113
5.3 Single wave c h a ra c te ristic s... 115
5.4 Sketch of velocity-space shell portion geometry ... 118
5.5 Spherical shell portion or ‘cap’ in the upstream case ... 119
5.6 a-dependences of shell portion populations and free e n e r g ie s 125 5.7 P artial shell configurations for a = 0 and a = 90° ... 126
5.8 Wave components in FLD coordinates ... 128
5.9 M easured wave energy p ro file s ... 129
5.10 Solar wind and wave param eters along the G iotto t r a je c t o r y 130 5.11 Theoretical upstream and dow nstream free energy profiles ... 132
5.12 Free, released and m easured wave energy density p ro file s ...133
5.13 Scatter plot of U against E p ... 134
5.14 Profiles of Poynting vector m agnitude and S y ... 137
5.15 Linear correlation of wave energy estim ated from 5 against m easured U ... 138
5.16 E stim ated u pstream and dow nstream energy density proportions . 140 5.17 Com parison of vox and vBh ... 141
5.18 Com parison of E p , Er and U profiles, and the dam ping lifetime . 143 6.1 D iagram showing signals of identical frequency components b u t different phase ... 148
6.2 Fourier coefficients in the complex p l a n e ... 148
6.3 M inim um and m axim um frequencies for discrete a n a ly s is ...150
6.5 Schematic representation of a spectrum in term s of PSD n ... 153
6.6 Comparison of spectra using 128 and 512 sample p o i n t s ... 155
6.7 7 versus tim e for 128- and 512-sample spectra ... 156
6.8 Spectral index profiles for com ponents of B ... 157
6.9 Spectral index versus tim e profile for B ... 159
6.10 Illustration of th e Doppler shift calculation ... 161
6.11 Examples of spectra and fits on a linear s c a l e ... 162
6.12 Comparison of to tal power calculated in the tim e and frequency domains ... 166
7.1 The ^-component of the im planted ion beam velocity ... 171
7.2 Sim ulation results for the ionization lifetime ... 173
7.3 Infinitessimal elements of surface and volume in te g ra tio n ...175
7.4 How ‘overcorrection’ m ay result in an oscillation of bin v a lu e s 185 7.5 Forward and backw ard centering m ethods ... 186
7.6 Development of num erical ion distribution along a flo w lin e 188 7.7 Numerical distributions obtained on the G iotto p a t h ... 192
7.8 10%-widths for m easured d is trib u tio n s ...196
7.9 Comparison of m ean pitch-angle w idths ... 198
7.10 Illustration of th e effect of a ... 199
7.11 Com parison of m ean v- widths ... 201
10
L ist o f T ables
1.1 Average solar wind param eters a t 1 AU ... 23
2.1 Missions to comet Hailey ... 30
2.2 Experim ents on th e Hailey spacecraft ... 32
3.1 Observed interaction regions at comet H a ile y ... 62
4.1 Hailey and solar wind properties from model fits ... 95
4.2 Comet Hailey gas emission characteristics ... 96
4.3 A com parison of models ... 96
4.4 Observed an d modelled bow shock crossings ... 103
6.1 Characteristics of B spectra m easured in spacecraft frame freq u e n c ie s...158
T h e Solar W in d
1.1
Introduction: Solar S y stem P lasm as
On E arth , plasmas occur very rarely. In the environment of space, however, th e plasm a state accounts for over 90% of the volume of the universe. The term ‘plasm a’ is normally used to describe a dissociated gas of electrons and positive ions, and encompasses a wide range of possible properties. The gas in the interstellar medium is excited by stellar radiation and remains in the plasm a state by virtue of its low density, hence low recom bination rate. However, the atmospheres of stars are almost completely ionized because the very high tem peratures of the particles ensure collisions of sufficient energy to knock out electrons from the atom s. T he emissions from stellar photospheres and magnetized plasmas may be detected by m odem astronom ical telescopes in th e radio, optical, Xray and 7-ray bands [Alfven, 1987].
A good working definition of a plasm a is [Chen, 1984]:
“A 'plasma is a quasi-neutral gas of charged and neutral particles which
exhibits collective behaviour
If a gas has a sufficient level of ionization, the long-range Coulomb force dom inates the physics and produces a ‘collective behaviour’ [Chen, 1984], whereby the movement of an element of plasm a generates fields which affect o ther regions. ‘Q uasi-neutrality’ results from the plasm a’s ability to shield out an applied electric potential - a phenom enon known as Debye shielding. An isolated charge surface in a plasm a will a ttra c t around it particles of the opposite charge such th a t outside these clouds there is, ideally (in the zero
1. THE SOLAR WIND 12
tem perature case), no electric field. T he Debye length, Ad, is a m easure of the shielding distance. A plasm a is quasi-neutral since the electron and ion num ber densities are approxim ately equal over a distance greater th an Ad, however V . E ^ 0; electromagnetic fields exist. This is the ‘plasm a approxim ation’. The ‘plasm a param eter’, N o , is defined as the num ber of particles in the Debye sphere (ie a sphere of radius Ad), and for statistical significance, collective behaviour requires N o > > 1.
This thesis is concerned with the interaction of solar wind and com etary plasm as. A complex interaction region develops around a comet when it makes its closest approach to the Sun. W ithin this region there are three principal domains; a cometary ion dom inated coma, a solar wind dom inated upstream region, and between these a ‘m ixing’ region. The behaviour of th e particles is strongly spedes-dependent (not all spedes behave as fluids) and the interaction is influenced by the varying interplanetary m agnetic field direction.
Historically, it was observations of comet tails th a t led Biermann [1951] to suggest the continuous flow of particles from the Sun (now known as the solar wind). The plasm a tail of a comet does not lie along the orbit, b u t ra th e r is aligned along the relative velocity vector between the comet and an outw ardly flowing solar wind stream (the velodty of which can be esti m ated from such observations). Bierm ann postulated th a t the force involved in producing the “tail aberration” was due to the collisions of solar particles w ith cometary particles in the tail. He suggested th a t the stream s from the Sun m ust flow continuously, rath er th a n interm ittently as had been previ ously believed based on the occurrance of geomagnetic storm s at th e E arth. T he work of Bierm ann in tu rn prom pted Parker [1958] to develop a theoret ical model of solar coronal expansion. P ark er’s theory provided estim ates of solar wind velocity and tem perature which were confirmed following space craft observations a few years later. However, the measured density was very m uch smaller th an previously supposed by Bierm ann, so dem onstrating th a t solar wind particle collisions alone are insufficient to produce th e observed tail deflections. New ideas were needed.
Morehouse. He noticed paraboloidal envelopes th a t formed first on the sun- comet line, and spread outwards in b o th directions to eventually form tail rays. But it was Alfven [1957] who realized the im portant role of the m agnetic field, which is strong enough to enforce fluid-like behaviour of the solar wind plasm a around the comet since the ion gyroradius in the field (< 100 km) is small com pared w ith the size of th e object. (For comparison, the collision m echanism of Biermann [1951] has a m ean free p ath of ~1AU and is therefore considerably less effective.) The m agnetic field is ‘frozen-in’ to the solar plasm a (see Section 1.3) and is dragged dow nstream with it. On encountering the comet the field lines become drap ed around the head to form the tail which acts like a windsock.
1. THE SOLAR WIND 14
1.2
E xpansion o f th e Solar Corona
The corona of the sun is so hot th a t th e pressure of a static atm osphere cannot be contained, and the plasm a extends into space. The ‘solar w ind’ is the nam e given to this expanding plasm a. It forms an interplanetary m edium which interacts with the fields and ionized particles in the atm ospheres of the planets and other bodies in the solax system . A variety of complex structures observed in the solar wind originate from solar surface features (such as loops and coronal holes) and variations in solar activity (such as flares).
T h e solar wind has several constituent ion species, each w ith different velocity-space distributions. Nevertheless it is useful to employ a simple single-fluid theory to examine th e bulk outflow. A steady state, radial, spherically-symmetric expansion m ay be described by the following con servation equations for mass, m om entum and energy [eg. Schwartz, 1985, Hundhausen, 1972]:
~ (p u r2) = 0 (1.1)
du , 1 dp _ G M,s „
U* + p * - _ _ H _ (1-2)
i ( p p - ) = 0 (1.3)
W here u and p are the solar wind flow speed and mass density (m n) respec tively, p is the total pressure of th e flow, M q the mass of the sun, G the gravitational constant, and r the radial distance from the centre of the sun. This analysis ignores the magnetic field (which is justified for coronal holes, b u t not in the region of sunspots). T he mass equation simply gives:
const. /H v
pU = — — (1.4)
and states th a t the mass-flux m ust fall off according to 1/ r2 as it expands in to an increasing spherical area. T h e m om entum equation comes from:
| + u.v ) u + V.p = force (1*5)
and relates to the num ber of degrees of freedom, Af, in a system by 7 =
(2 + AT)/AT.
T he m om entum flux equation m ay be integrated to give an energy flux equation as follows:
/
du 1dp G Mq11-7- + — + dr = const. (1*6) dr p dr r 2
Integrating the first term by p arts gives:
J
u ^ - d r = u 2— J
u d u = (1*7)To integrate the second term , consider the to tal derivative of p /p : d ( p \ _ 1 dp p dp
dr \ p ) p dr p2 dr ( 1.8)
Also, differentiating equation (1.3) and setting equal to zero leads to a rela tionship between dp and dp,
dp _ p dp dr 7p dr which is substituted into (1.8) to give:
d f p \ __ (7 — 1) dp dr \ p J 7p dr
From this, 1/p(dp/dr) m ay be replaced in the integral:
(1.9)
(1.10)
= _ 2 _ £
(i.ii)
J p dr (7 — 1) J dr \ p J (7 — 1) p
T he th ird term in equation (1.6) simply gives —G M ^ /r . Finally, combining term s:
—u 2 -f -——— = constant = E (1*12)
2 (7 - 1) p r as given in [Schwartz, 1985].
1. THE SOLAR WIND 16
In order to examine the form of th e flow, the m om entum equation (1.2) can be rearranged and expressed in term s of the Mach num ber
, 2 \ 2
" = ( % ) ( 1 -1 3 )
which is the ratio of the flow velocity, u, to the local speed of sound,
« • - ( ? ) *
<■•»>
T he algebra is tedious and may be approached in the following way. In order to replace the d u /d r and dp/dr in (1.2), consider
d ( M 2) _ d / pu2\ __ (1 — 7) p« 2 dp 2pu du _ . dr dr \~fp J 7 2 p2 dr 7p dr
(in which (1.9) has been substituted for dp/dr), and from equation (1.1);
u dp du 2u „ , „ .
— / + — + — = () 1.16)
7p dr dr r
(using (1.9) again). These two equations m ay now be used w ith the momen tu m equation to eliminate d u /d r and dp/dr. From equation (1.16), d u /d r can be replaced in both (1.2) and (1.15), giving
7p — pu2 dp 2u 2 G M q
7PP dr and
(1.17)
(7 + l)p u2\ dp _ d ( M 2) + 4pu2 ^ I 7 2p2 J dr dr 'ypr
respectively. These are then combined to elim inate dp/dr:
7
P
f
P«2 - 7P | / d ( M 2) 4pu2\ _ 2u^ _ G M e . ig .(7 4- l)p I pu2 ) I dr ypr J r r 2
It now remains to re-express the p, u and p dependences. From the definition of Ad;
P«2 - 7 P = J _ = M 2 - 1
pu2 M 2 M 2 v '
Identifying M .2 terms: ( M 2 - 1 \ d ( M 2) _ 2
\ AA2 ) dr r (1.22)
i c i j r ) T T * - f [ < t - 1) " ! + 2] { i
-The M .2 components may be collected together and a factor of [(7—1) A t2+2] taken out from both the resulting term s on the RHS:
(7 + l)p G M Q/ r ) 2l p [(7- l ) p u2/7p + 2] J (1.23) T he denom inator on the right can be rearranged in term s of
r, , G M s _ u 2 7p (7 - l)p u2 + 2 ip
E + — 2 ( 7 - D p (L24)
to give finally [Schwartz, 1985]:
(7 + 1) (G M e / r ) 1
4(7 - 1) E + (G M @/ r ) \ (1.25) On the RHS of this equation, the term in square brackets will always be positive (for 7 > 1). However, the term in curly brackets will pass through zero at a “critical radius” , r c, where
(7 + 1) (G Mq/Tc) 4
(
7-
1)
E + (G M Q/ r c)from which r c is obtained [Schwartz, 1985]:
= 1 (1.26)
3 ( 5 / 3 - 7 ) £ M e
4 (7 — 1) E v '
1. THE S O L A R WI ND 18
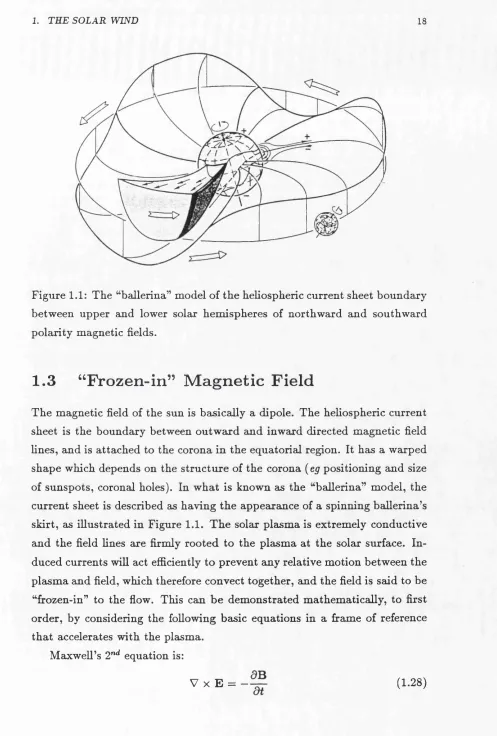
Figure 1.1: T he “b allerin a” m odel of th e heliospheric cu rren t sheet b o u n d ary
betw een u p p er and lower solar hem ispheres of n o rth w ard an d southw ard
p o la rity m agnetic fields.
1.3
“F r o z e n -in ” M a g n e tic F ie ld
T h e m agnetic field of the sun is basically a dipole. T he heliospheric cu rren t
sheet is th e b o u n d ary betw een o u tw a rd an d inw ard directed m agnetic field
fines, and is a tta ch e d to the corona in th e equatorial region. It has a w arped sh ap e which depends on th e s tru c tu re of th e corona (eg positioning an d size
of su nspots, coronal holes). In w h at is know n as th e “b allerin a” m odel, the
cu rren t sheet is described as having th e app earan ce of a spinning b a lle rin a ’s
sk irt, as illu stra te d in Figure 1.1. T h e solar plasm a is extrem ely conductive
and th e field fines are firmly ro o ted to th e plasm a a t th e solar surface. In
duced cu rren ts will act efficiently to prevent any relative m otion betw een th e
p lasm a an d field, which therefore convect to g eth er, an d th e field is said to be
“frozen-in” to the flow. This can b e d e m o n strated m athem atically, to first o rd er, by considering the following basic equations in a fram e of reference
th a t accelerates w ith the plasm a.
M axw ell’s 2nd equation is:
O hm ’s law for a moving conductor is (eg. Boyd and Sanderson, 1969)
j = 0-(E + u x B ) (1.29) where j is current density and a th e conductivity. Assuming an infinite conductivity plasma, j/<7 = 0, leads to the approxim ate relationship:
E = —u x B (1.30)
(1.31)
V x (B x u) = B (V .u ) - u (V .B ) + (u .V )B - (B .V )u (1.32) However Maxwell’s 3rd relation states th a t V .B = 0. Also, in a reference frame accelerating with the flow, u is a fixed vector and V .u = 0. Therefore
V x (B x u) = (u .V )B (1.33) Now consider the total, or ‘convective’ derivative of B . It is apparent from equations (1.31) and (1.33) th a t
dB <9B , _ N_ d B _ j\
= — + (u .V )B = g j - + V x ( B x u ) = 0 (1.34) ie th e total change of B is zero in th e fram e moving w ith u; the field convects w ith the plasma.
As the solar wind flows out from th e sun, the m agnetic field ‘lines’ are draw n out w ith it. The sun ro tates w ith angular frequency fi®, so th a t the field-lines (anchored at the sun) are w rapped around and the plasm a flows out radially, at an angle to th e direction of the B-vector, in w hat has been term ed a “garden-hose” fashion. Because the field and plasm a convect together their motion is parallel. T hus, in the frame of reference rotating w ith the sun, the plasm a flow velocity is tangential to the lines of B as represented in Figure 1.2, and is given by [Schwartz, 1985]:
V = ur - f i ®r<£ (1.35)
T he com bination of equations (1.28) and (1.30) yields:
__ j __ v d B
1. THE S O L A R WIND 20
SUN
1 A.U<
e a r t h's
O R B IT
F igure 1.2: D iagram of the “P a rk e r spiral” in te rp la n e tary m agnetic field
configuration in the ecliptic plane, showing th e velocity com ponents (in th e
co-rotating fram e) of a fluid elem ent as it leaves the Sun. (A d ap ted from
where f and <j> are unit vectors in th e direction of the polar-coordinate axes (r, (j>). Since B is parallel to V in this frame, B $ and B r components m ust be in the same ratio as those of V, it:
B<t> fi® r
(1.36) B r u
Thus the ratio of the components of B (hence the direction of B ) changes with r. The equation represents th e “P arker spiral” (so called after Parker, 1963) sketched in Figure 1.2. Note th a t this is an approxim ation to the real situation because the plasm a and field are assumed not to affect each other. An assum ption of radial outflow (taken also in Section 1.2) is only suitable where the field does not significantly restrain the plasm a, requiring the kinetic pressure to exceed th a t of the field:
V > 2
/io ( 1 ' 3 7 )This m ay be rearranged into a condition on th e flow velocity, u > Va, where Va = B /ln o p )1/2 is the local Alfven wave speed (see C hapter 5). Inside 1 /4 AU, the magnetic pressure dom inates and the plasm a is forced into approxim ate co-rotation w ith the sun.
1.4
Solar W in d P ro p erties
There are two fluid components to th e solar wind. The low velocity, high density plasm a is highly variable an d spatially structured, and it is interlaced w ith the high-velocity component in thin stream s. The fast solar wind is correlated w ith coronal holes, m agnetically open regions at the solar surface, so it has a smooth, homogeneous n atu re. Expansion of high-speed features and sporadic solar flare ejecta in to slower moving flows has been suggested to produce some of the observed in terp lan etary shocks.
1. TEE SOLAR WIND 22
10-8-1965 0 3 3 8 -0 3 5 5 UT
C/5
I- A-COUNTS
z 3 O o
1o7+6+ He
,3+ 'm
C-COUNTS
u.
o
2
3 CO
0.3 0.5 2 3 5 10 20
ENERGY PER CHARGE. kV
Figure 1.3: Identification of ion species in the solar wind from E/q spectra at two different pulse-counting thresholds, m easured by Vela 3 [Bame et al., 1968].
th a n this. The interplanetary m edium thus provides a good ‘laboratory’ in which to study plasm a ion populations. Some properties of the solar wind are listed in Table 1.1.
Relative abundances of ions in the solar wind can be determ ined from the energy-per-charge spectra th a t have been observed by spacecraft such as M ariner 2, Vela 3, Explorer 34 and HEOS-1 [ffundhausen, 1972]. The ions are predom inantly protons, w ith a ~ 4 — 5% (by num ber) alpha particle content on average. Various heavier ion peaks are also identified, (eg. 160 ,
12C, 14N), not all of which are fully ionized. Unfortunately, E /q is somewhat ambiguous (eg. a mass-4, charge-1 ion and a mass-12, charge-3 ion bo th have m / q = 4) and identification is often based on the assum ption of a common expansion speed of all ions from th e sun. Full consideration of ionization and recom bination processes in the expanding solar corona is ideally required.
Param eter Value
Bulk Parameters
velocity (it) 300-1000 km s"1
density (n) 4-10 /cc
tem perature (T) 105K
magnetic field (|J3|) 6 7
Velocities (k m s-1)
^thermal proton 30
^thermal electron 1000
Ya 50
Frequencies (ra d s ” 1)
ion cyclotron (fit) 0.5
electron fie 1000 .
ion plasm a (cjp, ) 3000
electron cope 10s
ion collision (2^1/^ ) 27r x 3 x 10”7
Timescales (s)
ion gyroperiod 12
electron gyroperiod 6 x lO”3
collision tim e 3 x 10⁶
expansion ( r /tt) 3 x 10⁵
Lengthscales
ion Larm or (r^,-) 60 km
electron 1km
m ean free p a th , \ mf P 0.6 AU Debye length, Ad 10 m
1. THE S O L A R WI ND 24
Figure 1.3, nearly all counts a p p ea r in tra c e A, b u t only very large pulses
are recorded in C.
T he solar w ind electrons accom pany th e ions at th e average bulk speed
(over all species) since the plasm a m u st rem ain n eu tral. (Positive and neg
ative charge m ust leave th e sun at an equal ra te and thus any difference in
electron expansion speed relative to th e ions would lead to a difference in
densities in th e ion fram e, hence a n o n -n e u tra l situ atio n.) T h e flow speed
of th e alp h a particles is typically observed to be g reater th a n th a t of th e
p ro ton s, by an am ount of th e ord er of th e Alfven speed, V4. T here have
been a tte m p ts to explain this velocity difference in term s of flow and heating
m echanism s involving wave processes in th e sun. Such a difference wrould be an expected consequence of w ave-particle interactions betw een th e alp h a
particles and Alfven waves in th e solar w ind (see C h ap ter 5), and it is con
ceivable th a t these alp h a particles are being “picked-up” w ith the protons as they leave th e sun.
A gas in therm al equilibrium has particles of different velocities dis
trib u te d about a central, m ost likely velocity. T he m ost probable d istrib u tio n
is described by a ‘M axw ellian’ function. T he average energy is related to the w id th , or te m p eratu re of the d istrib u tio n , an d is \ k e T per degree of freedom
(o b tain ed from the 2nd m om ent of th e M axw ellian d istrib u tio n , see eg. Chen,
1984), where kg is the B oltzm ann co n sta n t a n d T the tem p eratu re. To avoid any confusion, E th = k e T is norm ally used. A plasm a m ay have several te m
p e ra tu re s sim ultaneously, for each species of particle present, and according
to forces and constraints. In a m ag n etized plasm a, tem p eratu res are often
u nequal in directions p erp en d icu lar an d parallel to th e 5 -field because of
th e Lorentz force. T he ion species in th e solar wind have te m p eratu res ap
p roxim ately p roportional to m ass, ie. all ions have nearly th e sam e thermal
velocities [Schwartz, 1985], w here v th is o b tain ed from the th erm al energy:
E ,h = k BT = \ m vfh ; vth = (1.38)
A V m
T he ‘fluid’ approxim ation, m uch-used in describing plasm a flow, relies on
a high collision ra te in the p lasm a to m a in ta in equilibrium . It is relevant
to com pare th e collisional m ean-free-p ath wdth the scalelength over which
observa-Cross-sections
\ \ ^ p e r p e n d ic u la r \ \ parallel to B
- 8 0 160 2U0 3 2 0
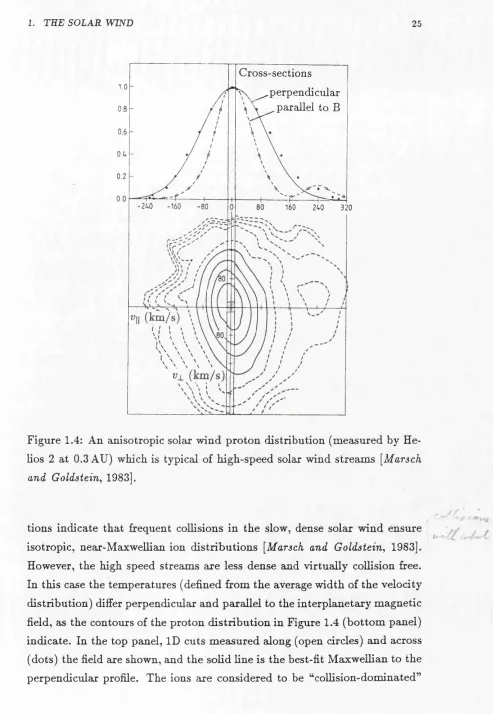
Figure 1.4: An anisotropic solar w ind p ro to n d istrib u tio n (m easured by He
lios 2 at 0.3 AU) which is typical of high-speed solax w ind stream s [Marsch and Goldstein, 1983].
tions indicate th a t frequent collisions in th e slow, dense solar w ind ensure
isotropic, near-M axw ellian ion d istrib u tio n s [Marsch and Goldstein, 1983].
However, th e high speed stream s axe less dense and v irtu ally collision free.
In th is case the tem p eratu res (defined from th e average w idth of th e velocity
d istrib u tio n ) differ perpendicular an d parallel to th e in te rp la n e tary m agnetic
field, as the contours of the p ro to n d istrib u tio n in Figure 1.4 (b o tto m panel) indicate. In th e top panel, ID cuts m easu red along (open circles) a n d across
(dots) th e field axe shown, and th e solid line is th e best-fit M axw ellian to th e
1. THE SOLAR WIND 26
where they have suffered at least one im pact since leaving the sun. W ithin the vertical lines in Figure 1.4 is the collisional regime outside of which severe deviations from a Maxwellian are to be expected. This region is smaller for higher tem perature, lower density distributions.
Double-peaked ion distributions axe frequently observed in the in terplan etary medium [Marsch and Goldstein, 1983]. The higher speed beam often travels at around the local Alfven speed relative to the bulk flow, in the direc tion parallel to the magnetic field. It has been suggested th a t wave-particle interactions between the ions and Alfven waves in the solax wind m ay be responsible for the acceleration of these ions. In the ‘coUisionless’ dom ain, any process th a t changes the distribution from Maxwellian cannot be sta tistically counteracted by Coulomb collisions and anisotropies can therefore develop.
1.5
W aves in th e Solar w ind
Most of the wave modes th a t are possible in the solax wind (from low- frequency MHD waves up to high-frequency plasm a oscillations) axe reported to have been observed. Unfortunately, the observations of a single, moving spacecraft do not allow separation of spatial and tem poral features, b u t in m any cases the mode can be inferred from polarization considerations and the plasm a param eters [Schwartz, 1985].
+4 ■■ -■ 25
- 4 • *- -■-25
+ 4 ■■
- 4 - ■
+4
- 4
B
8 12 16 20 24
TIME (HRS)
Figure 1.5: Solar wind Alfven waves observed in the M ariner 5 d a ta [Belcher and Davis, 1971], characterised by highly correlated field and velocity com ponents (upper 3 panels) and little fluctuation in field strength and proton num ber density (bottom panel).
spectra observed out to ~ 1 AU also evolve w ith R. In particular, the slope of the spectrum (see Chapter 6) is fla tter closer to the Sim; the spectral index was observed between values of 0.87 and 1.15 at 0.29 AU, reaching between 1.59 and 1.69 at 0.97 AU.
predomi-1. THE SOLAR WIND 28
Spacecraft C o m eta ry M ission s
2.1
Spacecraft M ission s to C om et H ailey
T he retu rn of Hailey’s Comet in 1986 provided the opportunity for five spacecraft missions to study th e com etary environment. In Table 2.1, some details of the spacecraft trajectories are given. The phase angle and closest approach distance, CA, are shown schem atically in Figure 2.1.
D uring the Com et’s active period, its asym m etric outgassing into the sunward hemisphere causes an acceleration of the nucleus away from the Sun, extending the ‘Keplerian’ orbit by four days [Reinhard, 1986c]. These non-gravitational forces cannot be modelled precisely, which makes space craft targeting a difficult task. G iotto was th e last spacecraft to encounter the comet and its aiming on final approach benefitted from the position inform ation passed on from Vega 1 an d 2. T he encounters of the five space craft between the 6th and 14^ of M arch 1986 fell around 4 weeks after the Hailey perihelion passage (with heliocentric distance between 0.79 and 0.89 AU) when the comet was at its m ost active [Reinhard, 1986a]. Hailey’s retro grade orbit imposes a very high flyby speed, so th a t close targeted spacecraft required extensive protection against dust im pact dam age to ensure a rea sonable chance of survival.
The spacecraft carried experim ents designed to study all aspects of gas and dust emission, the interaction of com etary ions w ith the solar wind, and the comet nucleus. The full complement of instrum ent types aboard the five
2. SPACECRAFT COMETARY MISSIONS 30
Table 2.1: Missions to Comet Hailey CLOSEST A PPROA CH
D ate Time D istance Flyby Speed Phase angle (km) (km s *) (<*eg)
Vega 1 6 M ar 86 07:27 8,500 79.2 111.2
Vega 2 9 M ar 86 07:20 8,500 76.8 113.4
Suisei 8 M ar 86 13:01 150,000 73.0 104.2
Sakigake 11 M ar 86 04:37 7,000,000 75.3 109.4
G iotto 14 M ar 86 00:02 500 68.4 107.2
S U N
P h a se
A n g le
S pacecraft tr a je c to r y
C O M E T
H A L L E Y B o w Shock
spacecraft are indicated in Table 2.2 [Reinhard, 19866].
2.2
T h e V ega 1 and 2 in stru m en ts
The instrum ents aboard the two Vega spacecraft [Grard et al., 1986] are summ arized as follows.
• The television system (TVS) is designed to observe the dimensions and albedo of the cometary nucleus and study the central coma. The system incorporates a narrow-angle cam era (TVY) providing high-resolution imaging and a wide angle cam era (TDN) to track the comet. Each has a set of filters giving spectral analysis capability.
• The infrared spectrom eter (IKS) analyses 2.5 - 12 /zm radiation from the inner coma to study chemical composition, nucleus size and therm al emission.
• The three-channel spectrom eter (TK S) measures the intensity of radi ation in the UV, visible, and IR ranges of the spectrum . The visible range records light diffused by the nucleus and dust particles, the UV channel measures emissions from atom s and ions in the coma and tail for composition studies, and th e IR region covers radiation from molec ular vibrations.
• A shield penetration detector (PH O TO N ) records the flux density of cometary dust particles and tests the performance of the shield.
• SP-1 and SP-2 dust particle im pact detectors measure the flux and the mass distribution of dust particles. An acoustical detector records the count rate. The ion and electron clouds produced by each particle im pact are collected in the plasm a detectors, where the pulse m agnitude is proportional to particle m ass.
2. SPACECRAFT COMETARY MISSIONS 32 ►© co oo os •E53 c * H (3 M O 0) O d p , CO 0) 13 W y Ahp d o d 0) •B0) a M w c4 cm y •fi $ hp y hp y
A
d <D > ‘So a; 3>*
a o Pi O d O • N o (0 d b0 33 d CO a; co *3 co CM <3 d b 0 £ d <0 3 'B y Ph K W-
I § 1
£ O
co
Ph Ph
CO CO
W H
CO d o • H • d d CO d o P i h p y co 13 T3 d £ £
o o
CO CO
d . a 5 8 • ?
Ph .2
Pm ^
s £
p-i
o a s
•«! < <0 'd
W
2 2 o
CO CO d CO
< < A «d Eh H-H 2 Ph Ph
P i d Ph OS bO Pi y d W
>
I>
Ph *I>
Ph<
P i y H P CO 9 l d d 0 £ H P y d d 3 bO CO d d 2 CU<
o o<
Ph »~S c o "o
<
s co p3 Ph co d -d *d d d co d O CO 2 55 O 55 Pi <0 h j as 3 o Pi h p CJ <0 Ph COI 13
3 d <o 5 5 Ph Ph <0 h p OS 3 o P i ■p O (0 Oh CO CO CO d 3 Q PH Q CM I Ph CO Ph CO £
o
E-* O W Ph Pi <0 HP <0 3 o Ph h p y <0 Ph CO CO CO d y d Ph3 . §
HP -HP
CO CO d d Q Q
co
>
H d Pi <0 1 o>
& d P i I d U>
& o 3 cS bO d V) d CO CO W Ph O CO Ph O Pi <0 HP <0 3 o Pi H P y co Ph CO 1 3 d H 3 d d o CO o P . O H P o A Ph A y i y <o Pi Hm * C d d
S w d e3 «h *rt
n 3 d
with am plitude proportional to im pact velocity (known ram velocity) and mass [Simpson et al., 1986].
• The dust mass spectrom eter (PUM A) employs a time-of-flight tech nique to measure the chemical composition, size, and the spatial den sity of dust particles.
• The neutral-gas mass spectrom eter (ING) measures the chemical com position of the cometary atm osphere. It consists of a field ionization detector and an electron ionization detector which use, respectively, an electron-stripping and time-of-flight mass analysis, and electron im pact ionization followed by electrostatic mass analysis. T he advantage of the first m ethod is th a t th e molecules are not dissociated, b ut in the second case an energy range can be chosen to discount the gas evaporated from the spacecraft.
• The plasm a energy analyser (PLASM AG-1) package includes two elec trostatic ion energy distribution analysers (the com etary ram analyser, CRA, and solax direction analyser, SDA [Gringauz et al., 1986a]), an electrostatic electron energy analyser, a solar direction Faraday cup (integral detector), a ram Faraday cup (RFC) for com etary ions, and a photon and particle bom bardm ent m onitor.
• The energetic particle instrum ent (Tunde-M ) measures energy and flux of energetic cometary ions in two telescopes set at different angles to provide some angular distribution information.
• The m agnetom eter (MISCHA) includes a single axis sensor and a tri- axial sensor which are m ounted on a boom 1 m and 2 m , respectively, from the solar panel, enabling also the spacecraft effects on the mag netic field to be examined.
• The two sensors of the plasma-wave and ion-trap experim ent (APV-N) are an electric dipole consisting of two mesh spheres on a Y-shaped boom, and a Faraday cup.
2. SPACECRAFT COMETARY MISSIONS 34
form a dipole, and two cylindrical Langm uir probes, s im ila r ly m ounted, to measure plasm a density.
2.3
Suisei and Sakigake
The instrum ents carried by Suisei and Sakigake [Hirao, 1986] are listed be low.
S u isei
• The ultra-violet imager (UVT) is designed to obtain a photo-mosaic of the comet’s hydrogen coma, operating in the wavelength range of the hydrogen-alpha line. Inside the coma, the cam era is operated in photom eter mode which converts the im age d ata into a light-level his togram distribution [Kaneda et al., 1986].
• The solar wind experiment (ESP; energy spectrum of particles) mea sures the 3-dimensional velocity distributions of solar wind ions and electrons using two 270° spherical electrostatic analysers.
Sakigake
• The Plasma-wave probe (P W P ) incorporates a dipole an ten n a for the electric field signals and a search coil to measure the m agnetic field components of waves.
• The solar wind instrum ent (SOW ) m easures density, bulk velocity and tem perature of solar wind ions using a Faraday cup. A m odulator grid ju st inside the aperture grid alternates between 0 and a voltage V, where V can be selected from ground, to transm it pulses of incoming ions w ith energy/q > V to the ion collector.
LLI CO
OJ in
C\l LO
CD
CD
CM
CM
c o cr>
CO
o
c o
ecliptic
p
la
n
e
)
an
d
th
e
G
io
tt
o
tr
a
je
c
to
ry
[
R
e
in
h
a
rd
,
1
9
8
6
a
2. S P A C E C R A F T C O M E T A R Y MISSIONS 36
S -B A N D F E E D
X -B A N D F E E D
TO EARTH
M A G L O W G A IN C A R D IO ID A N T E N N A
HIG H GA IN D ISH A N T E N N A
S O L A R C E LL A R R A Y '
D E S P IN M E C H A N IS M
T W T A 's
O P E
U P P E R P L A T F O R M
H Y D R A Z IN E T A N K S
LO W GA IN
FILL IN A N TEN N A C A M E R A
R E A R S H E E T
/
B U M P E R S H IE L D
F R O N T S H E E T
F L A P M E C H A N IS M
TO SUN COM ETARY PARTICLES
L O W E R P L A T F O R M
E X P E R IM E N T B O X
E X P E R IM E N T P L A T F O R M
KICK M O T O R
Figure 2.3: T he stru ctu re of th e G io tto spacecraft [.Reinhard, 1986a].
2 .4
T h e G io tto s p a c e c r a ft
G iotto was launched on the 2nd Ju ly 1985 an d th e cruise phase was 8 m onths.
T he o rb it is illu strated in Figure 2.2 in th e sun-centred system . T h e space
craft is spin-stabilized at 1 5 rp m (4 seconds p e r spin), w ith th e spin axis
aligned along the relative-velocity vector. T h e stru c tu re of G io tto is illus
tra te d in Figure 2.3.
A dual sheet bum per is used to p ro te c t G io tto from d ust im p act dam age,
because w ith im pacts occuring a t ~ 6 8 k m s -1 (flyby velocity) a single ab
sorbing shield would need to be thick an d extrem ely heavy [Reinhard, 1986c].
D ust particles are completely vaporised on im p act w ith th e th in fro n t sheet
the im pact over a large area of the rear sheet, so dissipating the energy. A high-gain parabolic dish an ten n a transm its d ata back to the E arth. It is despun to retain a constant point direction (at 44.3° to the G iotto rearw ard direction) as the spacecraft spins. A deviation of more th an 1° from the norm al attitu d e would result in the loss of the downlink [Reinhard, 1986c]. Such an event could be caused by an im pact w ith a > 0.1 g dust particle (the probability of which was estim ated before launch to be a few percent [Reinhard, 1986c]) and was observed soon after closest approach when contact was lost for ~ 20 seconds.
A brief description of experiments on board Giotto follows.
• The Hailey multicolour cam era (HMC) is a narrow angle cam era de signed to image the nucleus. It has three detectors each w ith a fixed colour filter and one with an interchangeable-filter wheel for coma and dust observation [Schmidt et al., 1986].
• The dust im pact detector system (DID) monitors dust im pacts on the Giotto bum per shield using three piezo-electric elements (microphones) to record the shock wave, and particle mass is derived from the size of the plasm a cloud produced on im pact [McDonnell et al., 1986].
• The dust mass spectrom eter (PIA ; particulate im pact analyser) accel erates to a time-of-flight m ass analyser th e ions formed when a dust particle disintegrates on im pact at th e detector’s target [Kissel, 1986]. Thus the composition of individual dust particles is m easured.
• The neutral mass spectrom eter (NMS) consists of two sensors. In both of these the cometary neutrals are first ionized by electron bom bard ment. T he M-analyser is a double focusing system involving an electro static analyser followed by a m agnetic sector field and ions are focused at positions on the detector m icro-channel plate according to m ass/q only. The electrostatic parallel-plate El-analyser focuses ions of a given Ejq independent of their angle of incidence to the sensor [Krankowsky
et al., 1986a].
SPACECRAFT COMETARY MISSIONS 38
sures the ion abundances and 3-dimensional velocity distributions in the outer coma. It uses a sector m agnet w ith entrance and exit slits which fixes a particular ion norm al m om entum and an electrostatic deflector then acts as a m ass/5 analyser. The high intensity spectrom eter (HIS) is optimised to operate in th e inner coma where densities are high. It has a mass analyser combining electrostatic and m agnetic deflection systems, and an electrostatic quadrispherical angle analyser. • In brief, the Johnstone plasm a analyser (JPA ) [Johnstone et al., 1986a]
includes a fast ion sensor (FIS), which is a 270° electrostatic analyser measuring the 3-dimensional energy distributions of the ions, and the im planted ion sensor (IIS), combining electrostatic and time-of-flight analysis to give mass discrim ination b u t w ith lower tim e resolution. A more extensive description follows in Section 2.5.
• Two instrum ents form the RPA -Copem ic plasm a experim ent [Reme et al., 1986]. The electron electrostatic analyser (EESA) has an entrance aperture in the centre of a hem ispherical electrostatic energy-selecting section and the electrons axe deflected through 90° to be detected at positions on a micro channel plate ring dependent upon their polar angle of incidence. The positive ion cluster composition analyser (PICCA ) measures the mass of com etary ions of assum ed charge and velocity in the inner coma using also an electrostatic E /g analyser.
• The energetic particle experim ent (E P O N A /E P A ) is designed to detect electrons and ions w ith energies > 2 0keV. It consists of 3 identical small telescopes, two at 45° to the ram direction (one of which adm its protons and electrons, the oth er adm its electrons only) and one at 135°. Each telescope has two solid-state (depleted silicon) detectors [McKenna-Lawlor et al., 1986a].
MAG-1
0 — MAG-4
MAG OPE
IMS
PIA
X , JPA RPA
NMS
DID HMC EPA
DID
2. SPACECRAFT COMETARY MISSIONS 40
w ith one core and two pick-up coils. A detailed description is presented in Section 2.6.
• The optical probe experiment (O PE ) is a photo-polarim eter [Levasseur-Regourd et al., 1986], aimed rearw ards along the spacecraft velocity vector so th at the integral column brightness can be transform ed into values for a small volume of space traversed by the instrum ent field of view between two successive measurements. Observations of light diffused by dust grains axe m ade in three wavelength ranges, and four specific spectral bands are used to m easure line emissions from OH, CN, C2 and CO+.
• The radio-science experiment (G RE) is designed to m easure the colum nar electron content of the com et’s ionosphere by observing the phase shifts developed in two initially coherent, monochromatic radio signals of different frequencies tran sm itted at the spacecraft and received at the E arth [Edenhofer et al., 1986].
The location of the instrum ents on the G iotto spacecraft is shown in Figure 2.4.
2.5
JP A E xp erim en t on G iotto
T he work of this thesis prim arily uses d a ta aquired by the Johnstone plasm a analyser (JPA ) on board the G iotto spacecraft. The JPA instrum ent is therefore considered in detail in this section.
2.5.1
Fast Ion Sensor
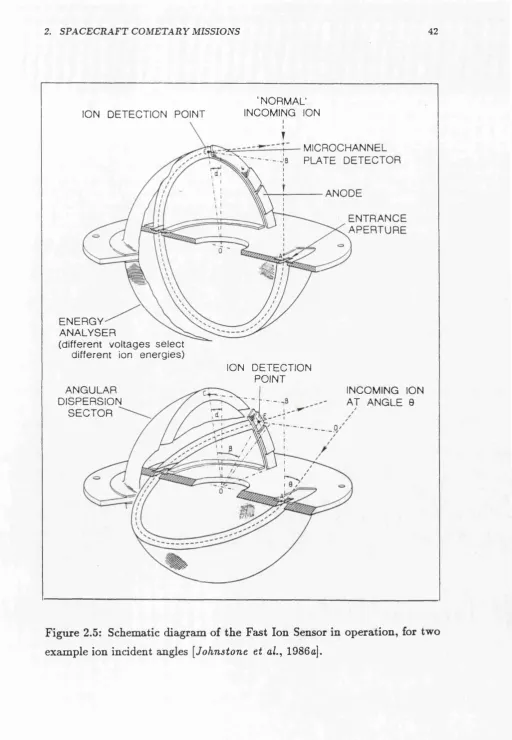
T he fast ion sensor is illustrated in Figure 2.5. Ions are adm itted through an entrance aperture into a hemispherical electrostatic energy analyser consist ing of two concentric deflection plates. Variable plate voltages are applied in a fixed ratio of Vnncr/Vmtcr = —1.18 which gives a zero-potential ‘surface’ midway between them . The radius of curvature of the analyser p a th and the applied voltages selects th e ion E/q band, where 5 E /E = 4.7% according to analyser characteristics such as the narrow plate spacing. After 180° all hemispherical paths (for the given E/q ) reconverge regardless of ion incidence angle to the detector, and the ions pass through an interm ediate ap ertu re to enter the 80° (not quite quadrispherical) angular dispersion sector. They then disperse according to angular incidence (see Figure 2.5) to arrive around a 160° sector microchannel plate (M C P) detector, which generates an elec tron cloud for each ion im pact. Behind the M CP the electrons are collected on one of eight discrete m etal anodes of defined angular range. Each anode is connected to a charge-sensitive pulse amplifier. The MCP can handle high count-rates of up to ~ 2 x 10⁶ pulses per second, per anode sector.
T he (polar) acceptance angle of the detector is 160° in the plane con taining the spacecraft spin axis, as shown in Figure 2.6. The 3-dimensional coverage is swept out by the detectors as the spacecraft spins. For any ion detected by the instrum ent, the polar angle is known from the anode regis tering the count and the azim uthal angle is com puted from the Sun reference pulse (SRP) timing. 96% of 47r solid angle is covered, missing only a 20° cone about the velocity vector (in the ram direction).
T he FIS energy range is 10 eV to 20keV. For operation in the full ‘wide energy’ mode, the energy passband is swept over the range continuously in an exponential decay curve from the m axim um to minim un in 1/16 of a spin. Successive sweeps through the same energy therefore occur at azim uthal intervals 22.5° apart. Since the acceptance of the detector is a narrow 5° in azim uth, then obviously the 22.5° are not covered each tim e and the energy distributions have gaps in azim uthal coverage.
2. S P A C E C R A F T C O M E T A R Y MISSIONS 42
ION DETECTION POINT
INCOMING ION AT ANGLE 9 ANODE
ENTRANCE APERTURE
ENERGY ANALYSER
(different voltages select different ion energies)
ANGULAR DISPERSION
SECTOR
'NORMAL' INCOMING ION
i i
T
MICROCHANNEL PLATE DETECTOR ION DETECTION POINT
F ig u re 2.5: Schematic diagram of th e F ast Ion Sensor in o p eratio n , for tw o
AZIMUTH E arth
Spin_ Axis
Plane of
SUN
RAM direction
POLAR acceptance
Figure 2.6: The 3-D angular coverage of the JPA is determ ined by the polar acceptance angle of the instrum ents, which sweeps around in azim uth as the spacecraft spins.
a solar wind (SW) mode is used on alternate spins (with 8 second resolution), covering one quarter of the energy range, four times as often, in the 45° x 45° angular sector centred on the solar direction. The FIS operation sequence has a duration of two spins where each spin divided into eight 45° sectors, and is synchronised to the rotation according to the Sun reference pulse. During the first sector the instrum ent operates in the solar wind mode, m aking eight short energy sweeps during each of which the spacecraft and detector rotates through 5°. The field-of-view fan crosses the solar direction after 22.5° (te half way through this first spin sector). Counts are accum ulated in
8 azim uthal and 4 polar angle bins, and in 30 logarithmic energy steps. For the next 15 sectors to complete the two spins, operation is in the full wide energy mode with two full energy sweeps p er sector.
2. SPACECRAFT COMETARY MISSIONS 44
A utoranging proved invaluable for following the large changes in the solax wind speed at the bow shock which occurred over a very short tim e period of tens of seconds. Then as the solax wind distribution broadened and the count-rate dropped, the autoranging was switched off and the energy sweep set to the lowest level by ground control at 20:20 hrs ground received tim e.
T he fast ion sensor operated during the inbound leg and u n til shortly after closest approach when it ceased to re tu rn d ata as a result of damage sustained during the dust bom bardm ent.
2.5.2
Im p lan ted Ion Sensor
The im planted ion sensor (IIS) is an ion spectrom eter prim arily designed to m easure the distributions of im planted cometary ions. It combines elec tro static energy analysis with a time-of-flight technique. The layout of the sensor is illustrated in Figure 2.7.
The IIS has an array of five sensors, each m ade up of a spherical-section electrostatic analyser segment (ESA) and a time-of-flight (T O F) analyser, as shown in Figure 2.7. These sensors cover an angular range of 15° to 165° in five equally spaced 10° sectors in the plane th a t includes the spacecraft spin axis, such th a t as the spacecraft ro tates (see Figure 2.6), three-dim ensional coverage is provided in the same way as for th e FIS.
The ESA sectors have a mean radius of 50 mm and a plate spacing of 3 m m , w ith an energy bandw idth 5 E /E = 10%. The outer plate is held at 0 V and up to -11 kV may be applied to th e inner plate. Positive ions axe selected in the ESA according to their Ejq . They axe then accelerated by 10 kV to pass through a thin carbon foil at th e entrance of the T O F analyser, in the process of which a small fraction of their energy is transferred to secondary electrons th a t axe deflected from th e foil onto an MCP to record the ‘s ta r t’ signal. The ‘stop’ detector is an alum inium absorber and the secondary electrons in this case axe released from th e surface layer. T he spherical concave shape of the ‘stop’ detector lim its to ±5% the error in flight-path length caused by coulomb angular scattering of the ions w ith atom s in the ‘s ta r t’ foil.
----20
125
HVPS
Um c p: 1,0 - 3,1 k V Uo : 0 .0 1 - 11 k V
Up : 5,0 - 1 5 k V
- x
-160
x =
mm z = 101
c- t o f‘<
E S A
Figure 2.7: The Implanted Ion Sensor layout, (a) in plan, showing the array of five analysers covering different ion angles of incidence at the aperture
2. SPACECRAFT COMETARY MISSIONS 46
on q/m ass and thus the selected E /q an d the measured tim e of flight (after acceleration) over a known p ath length are combined to give m /q . Counts axe sorted into 5 mass bins using an on-board look-up table. A period of 25 fis is required to process the signals for each event, during which tim e further pulses cannot be processed. A m axim um tim e interval of 80 ns is allowed between the sta rt and stop signals before the event is discounted. Such a coincidence technique gives a high rejection of background signals, allowing low densities to be reliably m easured.
T he IIS operation sequence has a du ratio n of 32 spins (128 seconds); th e energy range of 86 eV /q to 86 keV/q is covered in 32 logarithm ically spaced steps, where an entire angular d istribution is aquired at one energy level every spin.
2.5.3
B ulk P aram eters from M om en ts
The detector response function G (v) relates the response of the detector (counts recorded on an anode in a fixed period of time, dt) to the phase space density, / ( v ) , of the plasm a it is m easuring. / is a function representing the density of ions th at have velocity v . T he detector response is a narrow function of v which peaks at the central velocity, v0, in the energy passband. In other words, the sensor operating a t a selected energy level should respond to ions whose velocities lie in a close spread around v<j (where the spread should be wide enough in order to record statistically significant counts at all ion densities to be m easured). T he ‘geometric factor’ of an instrum ent, given in term s of G (v) and the a p ertu re area of the sensor, is a property independent of the energy level (ie. Vo) and is obtained during calibration testing (w ith known ion beams) p rio r to launch. Thus the counts recorded during operation of the instrum ent a t encounter may be converted in to / ( v ) using the known geometric factor.
the fractional angle in spacecraft spin covered during a m easurem ent and between measurements, and the energy w idth in an E /g-level bin (where it is necessary to identify the ion species and charge state). In some p arts of three-dimensional velocity space the velocity bins overlap and other regions may have gaps in coverage. The results are m ost accurate if only one species is present in a distribution since w ith m ultiple peaks, part-m erged, the counts may become confusecf. As the solar wind proton tem perature becomes higher the distribution widens to the point where the alpha particle peak is swam ped and alpha param eters cannot be derived.
Bulk param eter calculation involves integration (or sum m ation) over the whole m easured velocity distribution. Such moments are defined as follows (see also C hapter 4, Section 4.1.3 for further explanation). The ion density is simply the total num ber of ions in the velocity distribution:
n = / / ( v ) d v (2- l )
The fluid velocity is the average obtained by ‘adding’ all the velocities of th e n ions and then dividing by n:
u = < v > = — [ v f ( y ) d v (2.2) n J
The tem perature is defined
TTl < v } u > T i l f , , / X T
T = - i f c T - = 3
i / (v - u) /(v )
dv
(2-3)
for three degrees of freedom, where the average ion therm al energy is < v j, > = \ k BT per degree of freedom; is the therm al (or random ) velocity of the ion, v t/» = v — u, and kB is th e Boltzm ann constant. T he solar wind proton distribution has two distinct tem peratures, parallel and perpendicular to the magnetic field lines. Three values are obtained for the therm al velocity aligned w ith the principal axes of th e instrum ent. These axes are arb itrarily related to the magnetic field direction so th a t it is not possible to derive values of the parallel and perpendicular tem perature. The value used is th e m ean of the three values. The pressure tensor is given by:

![Figure 2.3: The structure of the Giotto spacecraft [.Reinhard, 1986a].](https://thumb-us.123doks.com/thumbv2/123dok_us/9163674.1454682/37.612.38.550.16.751/figure-structure-giotto-spacecraft-reinhard-a.webp)
![Figure 2.4: Instrument positioning on the Giotto spacecraft [Reinhard, 1986a]. (Acronyms are given in the text.)](https://thumb-us.123doks.com/thumbv2/123dok_us/9163674.1454682/40.614.118.451.164.538/figure-instrument-positioning-giotto-spacecraft-reinhard-acronyms-given.webp)

![Figure 4.1: Cometaxy neutral density and cometary ion flux for both the Kepler orbit and spherically symmetric gas outflow models, plotted against distance from Hailey [Daly and Jockers, 1989],](https://thumb-us.123doks.com/thumbv2/123dok_us/9163674.1454682/81.612.95.469.81.310/cometaxy-cometary-spherically-symmetric-plotted-distance-hailey-jockers.webp)