www.nat-hazards-earth-syst-sci.net/16/977/2016/ doi:10.5194/nhess-16-977-2016
© Author(s) 2016. CC Attribution 3.0 License.
Factors of subjective heat stress of urban citizens in contexts
of everyday life
Tina Kunz-Plapp1, Julia Hackenbruch2, and Janus Willem Schipper2
1Geophysical Institute, Karlsruhe Institute of Technology, Karlsruhe, Germany
2South German Climate Office, Institute of Meteorology and Climate Research, Karlsruhe Institute of Technology,
Karlsruhe, Germany
Correspondence to: Tina Kunz-Plapp (tina.kunz-plapp@kit.edu)
Received: 7 July 2015 – Published in Nat. Hazards Earth Syst. Sci. Discuss.: 5 August 2015 Revised: 29 January 2016 – Accepted: 29 March 2016 – Published: 19 April 2016
Abstract. Heat waves and the consequent heat stress of urban populations have a growing relevance in urban risk management and strategies of urban adaptation to climate change. In this context, social science studies on subjective experiencing of heat as stress by urban citizens are a new emerging field. To contribute to the understanding of self-reported subjective heat stress and its major determinants in a daily life perspective, we conducted a questionnaire survey with 323 respondents in Karlsruhe, Germany, after heat waves in July and August 2013. Statistical data anal-ysis showed that subjective heat stress is an issue permeating everyday activities. Subjective heat stress at home was lower than at work and in general. Subjective heat stress in general, at home, and at work was determined by the health impair-ments experienced during the heat and the feeling of being helplessly exposed to the heat. For subjective heat stress at home, characteristics of the residential building and the built environment additionally played a role. Although the rate of implemented coping measures was rather high, coping mea-sures showed no uniform effect for the subjective heat stress. We conclude that in terms of urban adaptation strategies, fur-ther research is needed to understand how various processes of daily social (work) life enable or limit individual coping and that communication strategies are important for building capacities to better cope with future heat waves.
1 Introduction
Given the increased likelihood of longer, more frequent, and more intense heat waves in Europe (IPCC, 2013), heat waves and the prevention of the consequent heat stress of urban populations have become a growing concern in managing natural hazards impacts on society (WHO and WMO, 2012). The death tolls of the heat waves in Europe in 2003 and 2010 in Moskow, Russia, with estimates of up to 70 000 and 20 000 fatalities, respectively, (Revich and Shaposhnikov, 2012; Robine et al., 2008) dramatically showed the impacts of extreme heat events on human health. Economic projec-tions expect that with rising temperatures lost labor capacity in peak months of heat stress may double by 2050 (Dunne et al., 2013) and that the average global income may be reduced by 23 % by 2100 (Burke et al., 2015). In particular, urban cit-izens are likely to suffer heat wave impacts more often in the future due to the urban heat island effect (Beniston et al., 2007; Oke, 1973; Patz et al., 2005; Revi et al., 2014). In Eu-rope, reducing impacts of heat stress thus is among the top issues of urban climate change adaptation strategies (EEA, 2012; Revi et al., 2014).
stress (Großmann et al., 2012; Pfaffenbach and Siuda, 2010). Subjective heat stress hereby refers to the individual and self-reported assessment of respondents to what extent they expe-rience high summer temperature as stress. The existing stud-ies have shown that sociodemographic characteristics, health impairments, behavior during the heat, and factors in the ur-ban built environment are associated with higher or lower subjective heat stress. At the same time, however, it is not yet clear to which extent these factors statistically determine subjective heat stress and help explain the inter-individual variance observed.
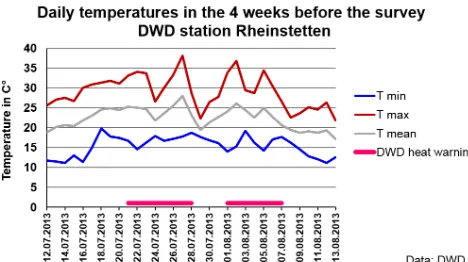
To close this gap in the current understanding of subjective heat stress of urban citizens, we present results of a ques-tionnaire survey on subjective heat stress (SHS) with 323 respondents conducted in Karlsruhe, Germany. The survey took place in summer 2013 immediately after two heat waves with measured temperatures above 30◦C and 7 and 6 days, respectively, with heat warnings by the German Weather Ser-vice DWD. Our main research aim was to identify what individual, social factors as well as factors of the urban built environment determine the SHS in different contexts of daily life. We therefore investigated to what extent ur-ban citizens experienced heat as stress in their everyday life in general, at home, and at work, and to what extent health impairments, attitude, behavior, housing and urban environ-ment, and sociodemographic factors make a difference to the self-reported heat stress. In this paper, we first outline fac-tors for (subjective) heat stress and heat health impacts as known from different research strands and derive the aim of our study. We then briefly describe the study concept, op-erationalization, data collection, and analysis in Sect. 3. In Sects. 4 and 5 we present and discuss the results. We finally summarize our conclusions in Sect. 6.
2 Factors for heat stress
Factors that contribute to health impacts from heat and to physiological heat stress have been investigated extensively in temperature-related mortality and morbidity studies and in biometeorological studies on human thermal discomfort. More recently, social science perspectives have emerged that focus on subjective heat stress, behavior during heat waves, and on vulnerability to heat.
2.1 Temperature-related approaches
Epidemiological studies investigating the relationship be-tween temperature and mortality and morbidity have re-vealed a widespread pattern of intrinsic, individual, and ex-trinsic socioeconomic and environmental factors that are as-sociated with increased mortality and morbidity during heat events in addition to high temperatures (Fernandez Milan and Creutzig, 2015). Intrinsic, individual factors for higher mortality found across studies are, in particular, old age and
high physiologic susceptibility because of pre-existing health problems or medication use, and also being confined to bed (Conti et al., 2007; Fouillet et al., 2006; Gronlund, 2014; Madrigano et al., 2013; Vandentorren et al., 2006; Zanobetti et al., 2013). Vandentorren et al. (2006) demonstrated ad-ditionally the positive effects of individual heat-protective behavior during the heat wave in 2003, e.g., of cooling the body or going outside during cooler times of the day. Extrin-sic factors for higher mortality associated with the socioe-conomic status are living alone (Fouillet et al., 2006; Ue-jio et al., 2011), in some cases being female (Borell et al., 2006; D’Ippoliti et al., 2010; Zanobetti et al., 2013), and liv-ing in census tracts with a lower socioeconomic status and higher poverty rate (Madrigano et al. 2013; Xu et al., 2013; Zanobetti et al., 2013). Studies in the US observed that eth-nicity and linguistic isolation additionally played a role for both higher mortality and heat distress calls (Gronlund, 2014; Uejio et al., 2011). Regarding the urban built environment, increased mortality and hospital admission rates were ob-served in large cities with high temperatures also during the night (Conti et al., 2007; Grize et al., 2005; Laaidi et al., 2012), in areas with little surrounding green space, and in dense urban structures (Gabriel and Endlicher, 2011; Scher-ber et al., 2014; Xu et al., 2013). Further studies identified housing conditions, such as living in an area with low prop-erty values, in a building with low insulation standard, or having the bedroom in the attic floor, as being associated with higher mortality rates (Smargiassi et al., 2013; Vanden-torren et al., 2004, 2006; Xu et al., 2013). Similarly, Harlan et al. (2006) found the combination of dense urban settle-ment structures and low socioeconomic status to be a factor for vulnerability to heat stress.
sub-jective heat perception during a heat wave in Leipzig, Ger-many, Franck et al. (2013) found that the evening tempera-tures measured in the bedroom dominated the heat percep-tion, whereas other parameters, such as urban structure type and green space showed no clear relation to heat percep-tion. In their in-depth study of 29 homes, White-Newsome et al. (2011) showed that heat-protective behavior was signif-icantly associated with increasing indoor temperatures, and that residents in high-rise buildings and impervious areas showed a higher rate of behavior changes to adjust to the heat.
2.2 Factors of heat stress in a social science perspective
A recently growing number of social science studies have ex-plored subjective heat stress and vulnerability to heat using – more or less explicitly – various theoretical frameworks and concepts of the natural hazards and climate change research community. Some of them focused on the risk perception and the response to heat warnings of vulnerable groups such as the elderly (Abrahamson et al., 2009; Hansen et al., 2011; Sampson et al., 2013; Sheridan, 2007) and their social net-works (Wolf et al., 2010). Others tried to understand the so-cial dimensions of subjective heat stress and behavior dur-ing heat (Großmann et al., 2012) or the social production of heat wave impacts (Klinenberg, 2002). The studies employed qualitative or quantitative research designs and because of their timing, they differ as well regarding the temporal rela-tion to heat experience. In some of them, data collecrela-tion took place during a heat wave (Großmann et al., 2012; Klinen-berg, 2002; Sheridan, 2007), in others in the summer season without pronounced heat (Abrahamson et al., 2009; White-Newsome et al., 2011), in late spring (Pfaffenbach and Siuda, 2010), or during winter (Kalkstein and Sheridan, 2007).
Despite these conceptual and methodical differences, the common explicit or implicit understanding underlying the research activities is that heat and subjective heat stress are problems that unfold in the context of everyday social life and that a number of individual and social characteristics in-teracting with health and urban spatial structures affect sub-jective heat stress and coping behavior. In contrast to the pre-viously mentioned biometeorological approach using ther-mal discomfort indices (Harlan et al., 2006; Langner et al., 2014), subjective heat stress (SHS) refers here to the sub-jective and individual experiencing of heat as stress that is measured with the statements expressed by individual study participants.
This definition and measurement has been used in previ-ous empirical studies on SHS among residents of the Ger-man cities Leipzig (GroßGer-mann et al., 2012), Aachen (Pfaf-fenbach and Siuda, 2010), and Nuremberg (Wittenberg et al., 2012). These clearly indicated that SHS in everyday life is not solely an issue at home and in the residential environ-ment, but also at work. As the most common expression of SHS at work, the studies found a decreased ability to
con-centrate due to the heat (Großmann et al., 2012; Pfaffenbach and Siuda, 2010). Similarly, Sampson et al. (2013) pointed to the negative effect of the heat on the energy level and the heat’s negative effect to function normally also in daily ac-tivities. Other impairments and health-related problems re-ported by study participants in the context of heat included circulatory complaints, but also headaches, disturbed sleep, exhaustion, and respiratory diseases (Pfaffenbach and Siuda, 2010; Wittenberg et al., 2012). Pfaffenbach and Siuda (2010) found higher SHS rates among respondents with a chronic respiratory or cardiovascular disease. Furthermore, the stud-ies mentioned found significant differences in SHS according to elements of the urban spatial structure (building type and inhabited level in the building, settlement density, and sur-rounding green space) that correspond to the results of heat discomfort studies outlined above.
Regarding sociodemographic characteristics that make a difference to the intensity of SHS, results of previous stud-ies diverged in particular for elderly persons reporting higher SHS levels than the younger respondents (Pfaffenbach and Siuda, 2010) versus elderly persons reporting lower SHS lev-els than younger persons (Großmann et al., 2012). Studies among elderly citizens in the UK (Abrahamson et al., 2009; Wolf et al., 2010), the US (Sampson et al., 2013; Sheridan, 2007), and Australia (Hansen et al., 2011) suggested that they did not perceive themselves as vulnerable to heat just be-cause of their chronological age in years. Moreover, as Groß-mann et al. (2012) found that retired respondents more often changed their daily routines during the heat than the younger and economically active ones, they raised the question as to whether and how the elderly might balance their higher sus-ceptibility to heat with higher coping capacity through their freedom from the constraints of working life.
just “common sense” (Kalkstein and Sheridan, 2007). Addi-tionally, Wittenberg et al. (2012) observed that respondents perceived persistent heat as a problem one is helplessly ex-posed to, indicating only a moderate attitude that heat stress is a problem one can actively cope with.
In sum, the outlined results from previous surveys suggest that SHS is an issue relevant in different contexts of daily life. Second, they underline that various sociodemographic characteristics, health and behavior factors, and factors re-lated to the built environment help explain why individuals experience and report more or less SHS. These results, how-ever, were obtained in bivariate analyses and comparisons. The previous studies thus limit conclusions across the factors regarding their effects on SHS, and they limit conclusions on what factors play a major or minor role as determinants for SHS in different contexts of daily life. Additionally, the question is still open as to what proportion of the observed variability in SHS they actually explain. Furthermore, as for some of the mentioned studies the data collection took place without preceding pronounced hot-weather periods, the ac-tual weather conditions and the fact that respondents had to rely on their memories of heat experience might have influ-enced their responses (Abrahamson et al., 2009).
3 Methods
A questionnaire survey was conducted in August 2013 in Karlsruhe, Germany, to identify the determinants of SHS of urban citizens in a multivariate perspective. The general aim of our empirical study was to identify what individual and social factors, and factors of the urban built environment de-termine the SHS in different contexts of daily life during a heat wave. Our first main research question therefore was to explore to what extent urban citizens experienced heat in var-ious typical daily situations as stress, how their health was affected by the heat, and what measures they implemented to cope with it. Urban citizens experience heat at home, or at work outdoors, or in buildings surrounded by urban struc-tures with small-scale variability of temperastruc-tures. Our sec-ond main research question therefore was how health, cop-ing attitude, and behavior durcop-ing the heat wave, age, and other sociodemographic variables on the one hand, and spa-tial structures and elements of the urban built environment on the other hand, are associated with SHS.
3.1 Concept of the study
The study concept based on previous studies (Großmann et al., 2012; Wittenberg et al., 2012) approached SHS as a prob-lem individuals experience and respond to in their everyday life settings in an urban environment. SHS was operational-ized as subjective heat stress in general, at home, and at work as the three key dependent variables. SHS was included for 12 additional typical daily activities to account for the
vari-ety of everyday life contexts in which people are exposed to heat (see Table 1). For all of them, SHS was measured using the following question in an expressed-preferences approach. “During a hot weather period, to what extent do you experi-ence heat as stress (. . . in general/at home/at work/etc.)?”
To analyze what makes a difference to subjective heat stress and to identify the main determinants of SHS in gen-eral, at home, and at work, the study concept adopted and combined individual, social, behavioral, and environmental factors associated with SHS from previous explorative stud-ies (Großmann et al. 2012; Wittenberg et al., 2012). Adjust-ing the heuristic framework for vulnerability assessment of Birkmann et al. (2013) to subjective heat stress in everyday life, these factors are related to the exposure to heat in a daily life context, the susceptibility of individuals, and their ability to cope with the heat. The study concept therefore included the factors health, coping attitude, and behavior during the heat, building elements and spatial structures in the urban built environment, and finally a number of sociodemographic characteristics (Table 1). Characteristics of the type of work and work place were also addressed.
Health impairments referring to symptoms suffered dur-ing heat, subjective health status, and the negative copdur-ing attitude, i.e., the feeling of being helpless against the heat, were adopted from Wittenberg et al. (2012). The measures to cope with the heat referred to changed behavior in response to the heat that can be performed immediately in the “here and now” (Birkmann et al., 2013, p. 193). We hereby used the terms coping behavior and coping measures to distin-guish them from long-term adaptation measures to prepare for more future heat waves on an individual or institutional level, such as investments in heat protection and thermal in-sulation of buildings, urban planning, organization of work processes, and economic production (Ginski et al., 2013). The coping measures were derived from public information material on behavior during heat and from previous research, in particular from the studies by Großmann et al. (2012) and Abrahamson et al. (2009). The elements of the urban built environment covered housing conditions and urban spatial structures tested in previous studies in German cities (Groß-mann et al., 2012; Pfaffenbach and Siuda, 2010; Wittenberg et al., 2012). We included also heat protection and thermal insulation of buildings that help keep indoor temperature at an acceptable level and opportunities to relax outside and re-cover from the heat during the cooler times of the day with-out leaving home. This study concept was translated into a questionnaire with 28 questions that combined standardized questions with Likert scales, with ordinally and categorically coded answers (Table 1).
3.2 Study area
Karl-Table 1. Variables and scores included in the data analysis.
Variables Scale N Results
Subjective heat stress in general 1 (not at all) to 9 (very strong) 319 Fig. 3
(dependent variables) at home 317
at work 255
Subjective heat stress in 12 additional typical daily activities
at home during daytime at home sleeping at night at work
on one’s way (to work, school, . . . ) while doing housework while doing shopping
during leisure and sports activities in public transport
in the car
outside: in parks, gardens, pools in your residential quarter in the city center
1 (not at all) to 5 (very strong), does not apply to me
323 (each) Fig. 4
Independent variables
Negative coping attitude agreement to the statement “one is helplessly subjected to the persistent heat”
1 (no agreement at all) to 5 (full agree-ment)
319
Frequency of health impairments experienced feel tired sick feeling concentration problems excessive sweating headaches circulation problems sleep disorders
worsening of existing diseases annoyance by mosquitoes
1 (not all) 2 (seldom) 3 (from time to time) 4 (often)
306 to 318 Fig. 5
Health impairment score sum of frequency of health impairments divided by the total number of health impairments given that at least 8 of the 9 health impairments listed have valid answers
1–4 311
Subjective health status very good, good, satisfactory, impaired, strongly im-paired
1 (very good) to 5 (strongly impaired)
Coping measures drink plenty
light meals light clothing cool body avoid direct sun
shift work or activities to other times of the day seek cooler places
avoid exertion
make breaks and slow down air and shade rooms use air conditioning use a fan
implemented,
not implemented, would have liked to implement if I had had the possibility
307 to 321 Fig. 6
sruhe held the temperature record for Germany of 40.2◦C measured during the European heat wave in August 20031. As climate model simulations project a warming over Ger-many in the future (Wagner et al., 2013), the city of Karl-sruhe is expected to experience more heat waves. In the city’s strategy to adapt to climate change, preventing future heat wave impacts through public health measures, information and communication, and various urban planning measures is of high priority (Stadt Karlsruhe, 2013). Karlsruhe thus pro-vides a suitable setting for a study on SHS.
In 2013, all summer months June, July, and August at the Rheinstetten weather station of the German Weather Ser-vice (DWD) just south of Karlsruhe had a positive temper-ature anomaly compared to the climatological reference
pe-1On 5 July 2015, a new official German temperature record of
40.3◦C was measured at the DWD weather station Kitzingen.
ex-Table 1. Continued.
Variables Scale N Results
Heat loading of residential district residential district assigned to four heat loading categories∗
1 (lowest) to 4 (highest) 323 Fig. 2b, Table 5
House type one or two-family home, multiple dwelling unit, apart-ment tower
categories 319 Table 5
Floor level ground level, lower, middle and upper levels, attic 1 (ground level) to 5 (attic) 323 Table 5
use of multiple floors yes/no 323 Table 5
Heat protection elements (score) number of 3 elements available: – window shutters
– roller shutters or sun blinds mounted outside the windows
– air conditioning
0 to 3 elements 308 Table 5
Outdoor recreational elements (score) number of 3 elements available: – balcony or patio
– backyard usable for leisure activities – garden
0 to 3 elements 306 Table 5
Known insulation elements (score) number of 6 available thermal insulation elements known:
– insulation of the attic – insulation of exterior walls – insulated glazing – green façade
– thick walls typical for buildings before 1920–1930 – energetic refurbishment in the last 10 years
0 to 6 elements 323 Table 5
Distance to public garden walking distance to public garden 1 to 5 min, > 5 min
322 Table 5
Type of work My type of work is mainly – physically demanding – mentally challenging – sitting
– standing and walking
– in a fixed and strict daily work schedule – with warm work safety clothes – with business dress code
yes/no 252 to 254
Working environment I work mainly – indoors – outdoors
– in an air-conditioned environment – with several colleagues in one office – from home
– in a particularly warm rooms
yes/no 253
Sociodemographic variables gender age
living conditions occupational status
categories 307 to 322 Table 3
*Residential districts were assigned to heat loading categories based on Bach et al. (2013) and Nachbarschaftsverband Karlsruhe (2013).
periencing of heat as stress. As the Rheinstetten DWD station is not located directly within an urban area, it can be assumed that the temperatures in parts of the city of Karlsruhe were even higher due to the urban heat island effect (Oke, 1973).
3.3 Data collection and sample
The survey took place from 9 August until 25 September 2013 immediately after the two heat waves. Data were col-lected with an online version of the questionnaire that was available on the web page of the South German Climate Of-fice at KIT and that was advertised in the local and social media. Parallel to the online survey, the senior citizens’ of-fice of the City of Karlsruhe sent a paper–pencil version of the questionnaire to groups of senior citizens.
an-Figure 1. Daily temperatures in Karlsruhe (German Weather
Ser-vice DWD station Rheinstetten) and days with heat warnings issued by the DWD for Karlsruhe.
alyzing SHS at work is limited because of too little response spread in the characteristics of work type and work place.
3.4 Data analysis
Data were analyzed using the program IBM SPSS version 21. First, a descriptive univariate analysis was carried out to explore respondents’ SHS in different contexts of daily life, health impairments experienced during heat, their coping at-titude, and what measures they used to cope with the heat. In order to understand what makes a difference to low or high SHS in general, at home, and at work, in the next step bi-variate correlations and significant differences were tested with variables representing health, sociodemographic char-acteristics, coping measures, and elements of the spatial built environment. As the three dependent variables of the study, SHS in general, at home, and at work, and also a number of other variables were either not normally distributed or coded on an ordinal level, Spearman’s rank correlation coefficients and nonparametric statistical tests were applied.
Finally, three multiple regressions for SHS in general, SHS at home, and SHS at work as dependent variables were per-formed to identify their main statistic determinants. Those variables referring to health, beliefs, coping measures, so-ciodemographic variables, and the built environment were entered into the regression models as independent variables that yielded significant results in bivariate analysis and that were plausible given the empirical evidence gained in other studies. The resulting three regression models for SHS in general, at home, and at work showed a good model fit with Durbin Watson values of 1.99, 2.03, and 1.99, respectively. To avoid collinearity, the independent variables had been ac-cepted only if they fulfilled the criteria of a tolerance mea-sure > 0.25 and a variance inflation factor, VIF < 5. Observed tolerance values of > 0.5 and VIF < 2 were the case for all independent variables.
The analysis of SHS at work considered only the econom-ically active respondents (54.5 %) and the students/trainees
(21.7 %). Students were included based on the assumption that in the perspective of everyday life experience, the stu-dents’ and trainees’ time and performance requirements in the course of the day correspond to requirements of working life independently of earning an income with their work.
A number of variables first required transformation into scores to finally test them as determinants of SHS (see also Table 1). The health impairments score was developed ac-cording to the summated score by Wittenberg et al. (2012) as a measure for the overall health impact during heat for each respondent. We refined their calculation and related the sum-mated frequency of health impairments reported to the total number of health impairments with valid answers. Thermal insulation of buildings and heat protection help keep indoor temperature at home acceptable, and having a balcony or a garden provides opportunities to relax and recover from the heat during the cooler times of the day without leaving home. Our intention was to test the effects of having these possibil-ities at home for SHS and not primarily the effect of single elements as analyzed in previous studies (Großmann et al., 2012; Pfaffenbach and Siuda, 2010; Wittenberg et al., 2012). The scores for the heat protection, outdoor recreation, and insulation elements therefore each counted the number of el-ements available in the respondents’ residence.
Regarding the residential district of the respondents, the 27 city districts of Karlsruhe were classified into four categories (see Fig. 2b). These categories correspond to settlement den-sity and heat loading as modeled for Karlsruhe based on an urban climate model (Nachbarschaftsverband Karlsruhe, 2013) and on a combined approach using weather stations and remote sensing data (Bach et al., 2013). In the presented study, the two districts in the city center represent the districts with the highest settlement density and highest heat loading. The adjacent four urban districts (south, southwest, east, and west of the city center) represent the category with dense ur-ban settlement and high heat loading. Eleven districts with urban and suburban characteristics form the third category, corresponding to a moderate heat loading. Ten suburban dis-tricts that are either located out of town or close to adjacent forests correspond to the category with the lowest heat load-ing.
4 Results
Figure 2. (a) Number of respondents in districts of Karlsruhe per 10 000 inhabitants/district. (b) Category of heat loading assigned to the 27
districts of Karlsruhe. The gray color in the figure (a) indicates that there was no participation from this district in the study.
Figure 3. Box plots for subjective heat stress experienced in
gen-eral, at home, and at work. Only economically active respondents and students/trainees answered the question on heat stress at work.
4.1 Subjective heat stress, health impairments, and coping with the heat
The majority of the 323 respondents experienced heat as stress in general, at home, and at work to a rather high ex-tent (Fig. 3). At the same time, the box plots indicate a high individual variability for all of the three SHS variables. Wilcoxon signed-rank tests, however, showed that the SHS at home was significantly lower than the overall general SHS (z= −4.036,p=0.000) and the SHS at work (z= −2.529,
p=0.011).
Figure 4 displays how respondents experienced heat as stress in 12 typical situations and activities in daily life. More than half of the respondents reported strong or very strong heat stress in public transport, in the city center, and almost
Figure 4. Subjective heat stress experienced by respondents in
typ-ical daily activities. Exact numbers for percentages below 10 % are not indicated in the figure.
half of them at home while sleeping at night, and at work. The lowest percentages of heat experienced as stress were reported for being outside in gardens, parks, or pools/lakes, while doing shopping, and while being in the car. For the two latter this can be explained by the fact that most cars and shops or shopping centers are equipped with air condition-ing. The responses shown in Fig. 4 also reveal that due to individually different daily routines and life styles, the activ-ities or situations in which heat is experienced did not apply equally to all respondents.
Figure 5. Type and frequency of health impairments from heat
re-ported by respondents. Exact numbers for percentages below 5 % are not indicated in the figure.
Respondents most often reported excessive sweating, feel-ing tired, sleep disturbances, and concentration problems from the heat (see Fig. 5). Number and frequency of health impairments suffered during the heat was summa-rized in the health impairments score. The score mean of 2.40 (standard deviation – SD=0.60, score range 1 to 4) indicates that the majority of respondents reported a modest overall rate of health impairments. Respondents with a lower, impaired, or strongly impaired subjective health status reported a higher frequency of worsening of existing diseases (χ2=111.34, p=0.000), circulatory problems (χ2=66.66, p=0.000), headaches (χ2=26.96,
p=0.008), and feeling sick (χ2=25.11, p=0.014). El-derly persons above 65 years more often reported worsening of existing diseases (χ2=35.5960, p=0.000) and having circulatory problems (χ2=25.49,p=0.013), but less often having concentration problems (χ2=43.80,p=0.000; chi-square tests with 12 degrees of freedom in each case,n=305 to 314).
The agreement among the respondents to the negative coping attitude, i.e., their being subjected to the heat with-out being able to do anything against it, was rather high (mean=3.36, SD=1.10 on a scale from 1 to 5). Despite this, the majority of them implemented measures to cope with the heat. As can be seen in Fig. 6, almost all participants employed basic behavioral measures that focused on physi-cal well-being during the heat and that could be easily inte-grated into the daily routine, such as drinking plenty of flu-ids, wearing light clothes, and eating lighter meals. Among the other behavioral measures that imply changes or alter-nations in daily routines and thus may require certain flex-ibility, were avoiding the direct sun, cooling the body, and avoiding exertion or exercise; these were implemented most by the respondents. To a lesser extent, the respondents sought
Figure 6. Implementation of coping measures: percentages of
re-spondents. Exact numbers for percentages below 10 % are not indi-cated in the figure.
cooler places, allowed themselves breaks, and slowed down or shifted work or activities to other (cooler) times of the day. At the same time, approximately up to a third of all re-spondents would have employed the three latter measures if they had had the possibility to do so. Out of the structural and technical measures to keep the indoor temperature at a tolerable level, almost all respondents used ventilation and shading of their rooms. Fans and in particular air condition-ing (9.8 %) were used less frequently. However, with 43.6 %, a reasonable percentage of respondents would have switched on the air conditioning if they had had the possibility to do so.
Female respondents more frequently changed over to lighter meals (χ2=7.37, p=0.007) and lighter cloth-ing (χ2=3.89, p=0.049) and more often avoided exer-tion or exercise (χ2=4.77, p=0.029). Male respondents more often used air conditioning (χ2=6.32, p=0.012; df=1 in each case, N=301 to 316). Regarding age, in particular the respondents aged 65 years and older shifted their activities more often to other times of the day (χ2=41.605, p=0.000) or allowed breaks and slowing down (χ2=55.88,p=0.000). They also more often sought cooler places to evade the heat (χ2=26.89,p=0.000), and more often avoided direct sun and exertion (χ2=11.75,
p=0.019, χ2=31.83, p=0.000 respectively; df=4 in each case,n=307 to 318).
4.2 What makes a difference to subjective heat stress?
correlated with the subjective health status, which in turn was weakly correlated with the health impairment score. For SHS at home and at work, the respective correlation coefficients are somewhat lower, and there is no significant correlation with the subjective health status.
Regarding sociodemographic and economic characteris-tics, the respondents mainly differed in their experiencing heat as stress at home, and to a lesser extent for SHS in general, and not at all for SHS at work. Table 3 lists the test results for SHS at home. Male, young (up to 24 years) respondents, and respondents living as single parents or in shared flats reported higher SHS levels at home. Students and trainees reported higher SHS levels than employed spondents (full- and part-time). Conversely, the retired re-spondents and those aged 65 years and older reported the lowest levels of SHS at home. Similar to SHS at home, the retired also reported lower SHS in general than the rest of the sample (χ2(4,n=319)=11.293,p=0.046; Kruskal– Wallis test).
Only 5 out of the 12 coping measures listed in the ques-tionnaire showed significant differences in SHS (Table 4). Seeking cooler places, allowing oneself to rest, and using the air conditioning were more often associated with lower SHS at work. In comparison to this, the other significant differ-ences point in the opposite direction: avoiding the sun was more often associated with higher SHS levels in all three contexts, using the air conditioning with higher SHS levels in general and at home, and using the fan with higher SHS levels at home.
The respondents differed significantly in their SHS at home for almost all elements of the residential building and the surrounding urban environment included in the question-naire, but not for SHS in general or at work. The test results for SHS at home in Table 5 show that higher heat loadings of the residential district are associated with higher SHS. Re-spondents with a one- or two-family home and reRe-spondents who have the possibility to use multiple floors in their home reported lower SHS levels than those living in multiple-unit dwellings or in apartment towers. Respondents in apartments in the upper levels and in particular in attics expressed higher SHS at home than those living at ground level. Based on the median values listed in Table 5, however, a steadily increas-ing average value of SHS with increasincreas-ing buildincreas-ing level was not observed.
Regarding the scores for heat-protective elements, the pos-sibilities to sit outside, and the known insulation elements, the results in Table 5 show that having no or a low number of elements in each case is associated with higher levels of SHS experienced at home; hereby, the respondents who do not have any heat-protective elements (neither shutters nor blinds mounted outside to shade the window, nor air conditioning) disproportionately often lived in apartments in the attic (χ2
(12,n=308)=25.50,p=0.012). Only for the walking dis-tance to the next public green space, could no significant dif-ference in the level of SHS at home be observed.
4.3 Determinants of subjective heat stress
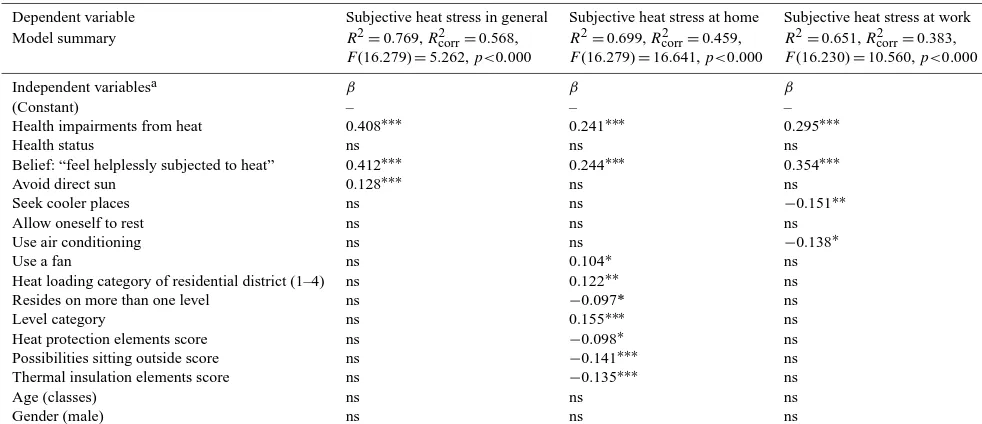
Table 6 lists the results of the multiple regression analyses to identify which of the variables making a difference at the bivariate level are the main statistic determinants for SHS in general, SHS at home, and SHS at work on a multivariate level of analysis. With resulting determination coefficients
Rcorr2 of 0.567 for SHS in general, 0.458 for SHS at home, and 0.379 for SHS at work, the regression models yielded moderate, yet satisfactory results in terms of the variance ex-plained.
As it can be seen from the standardized beta coefficients in Table 6, first, not all of the variables that yielded signifi-cant differences in bivariate analyses turned out to also have a significant effect in the multiple regressions. Second, health impairments and the feeling of being helplessly exposed to the heat had a significant positive (increasing) effect for all three SHS variables. The other determinants varied for SHS in general, at home, and at work. A number of characteris-tics of the residence significantly influenced the SHS at home only. Both the heat loading of the district and the level used in the building had an effect, whereby living in districts with higher heat loading or living on a higher level in a building increased SHS at home. The possibility to use more than one level at home, a higher number of available heat protection elements, a higher number of possibilities to sit outside, and a higher number of known insulation elements showed a de-creasing effect on SHS at home.
Among the coping measures, seeking cooler places and using air conditioning had a significant negative, thus de-creasing, effect on SHS at work. In comparison to this and as already observed on the bivariate analysis level, avoiding the sun had a weak positive, thus increasing effect for the SHS in general, and using a fan had a positive effect for SHS at home. The tested demographic variables, age and gender, did not show significant effects in the models, as was the case for the subjective health status.
5 Discussion
Table 2. Correlations (Spearman’s rho) for subjective heat stress.
Spearman’s rho (n) (1) (2) (3)
Subjective heat stress
(1) . . . in general –
(2) . . . at home 0.500∗∗∗ (313) –
(3) . . . at work 0.570∗∗∗ (254) 0.245∗∗∗ (250) –
Health impairment (score) 0.637∗∗∗ (308) 0.357∗∗∗ (305) 0.456∗∗∗ (253)
Subjective health status 0.134∗ (318) −0.066, ns (316) 0.009, ns (255)
Negative coping attitude 0.658∗∗∗ (316) 0.466∗∗∗ (313) 0.533∗∗∗ (252)
Heat stress in general, at home, and at work is measured on a scale from 1 (not at all) to 9 (very strong). The negative coping attitude was measured with the agreement to the statement “one is helplessly subjected to the heat” on a scale from 1 (no agreement at all) to 5 (strong agreement). ns denotes correlations that are not significant;∗p <0.05,∗∗∗p <0.005.
Table 3. Differences in subjective heat stress at home by sociodemographic variables.
Variable Category n Median Test statistics
Gender female 156 5 Z=2.679∗∗
male 155 6
Age groups up to 24 years 72 7 χ2=35.731∗∗∗
25–34 years 65 6
35–49 years 58 6
50–64 years 59 5
65 years and older 61 4
Living conditions with partner and children 44 4 χ2=20.818∗∗∗
with partner 108 5
single parent 10 7
alone 86 6
flat share 62 7
assisted living communities 3 3
Occupational status not economically active 4 7 χ2=41.987∗∗∗
student/trainee 77 7
retired 61 4
unemployed 1 7
part-time employed (< 70 %) 30 4
full-time employed (> 70 %) 143 6
Heat stress measured on a scale from 1 (not at all) to 9 (very strong). Test statistics: chi-square values obtained in Kruskal–Wallis tests for three or more independent samples;Zvalues obtained in Mann–WhitneyUtest for two independent samples.∗∗p< 0.01.∗∗∗p< 0.005.
no uniform effect for the SHS. At the same time, the im-plementation rate of coping behavior among the respondents was remarkably high.
Like other German social science studies, the results of our study underpin that SHS is an issue not solely preva-lent at home or at work but throughout everyday life. Sim-ilar to the explorative survey conducted during a heat wave in Leipzig in 2010 (Großmann et al., 2012), the average SHS of the Karlsruhe respondents was rather high, in particular compared to the studies by Pfaffenbach and Siuda (2010) in Aachen and by Wittenberg et al. (2012) in Nuremberg. As Pfaffenbach and Siuda (2010) carried out their study in late spring 2010 and Wittenberg et al. (2012) in summer 2011 without particularly hot temperatures, the higher
aver-age value of SHS in the Karlsruhe survey can be explained by the immediate heat experience prior to the survey.
Table 4. Differences in subjective heat stress by implemented measures.
Measure Heat stress in general Heat stress at home Heat stress at work
n M Z n M Z n M Z
Avoid sun −3.865∗∗∗ −2.082∗ 2.274∗
not implemented 46 4 46 5 41 6
implemented 272 7 269 6 214 7
Seek cooler places −1.845, ns −1.910, ns −4.494∗
not implemented 160 7 159 6 147 7
implemented 150 6 149 5 107 6
Slow down, allow oneself rest −0.591, ns −1.435, ns 2.042∗
not implemented 148 7 148 6 143 7
implemented 170 7 167 5 112 6
Air conditioning −2.092∗ −2.773∗∗ −2.388∗
not implemented 274 6 272 6 225 7
implemented 30 7 29 7 28 5
Use of fan −1.730, ns −2.470* −1.556, ns
not implemented 169 7 168 5 129 7
implemented 141 7 140 6 126 7
Mdenotes median;Zvalues obtained in Mann–WhitneyUtest for two independent samples; ns denotes test results that are not significant. ∗p< 0.05.∗∗p< 0.01.∗∗∗p< 0.005.
et al., 2014; Vandentorren et al., 2006). Furthermore, because of the everyday life approach of our study, the specific health symptoms experienced during heat listed in the questionnaire and consequently included in our health impairments score did not follow the terminology of the International Statisti-cal Classification of Diseases (ICD) as used in epidemiolog-ical studies. Like in previous social science research (Groß-mann et al., 2012) the presented results underline how even less serious health impairments that may not represent the beginning of a lethal chain during heat, such as sweating, feeling tired, sleep disorders, and concentration problems de-termine SHS of citizens with a predominantly good or very good subjective health status. In this respect, the results of our experience-based study of SHS in daily life measured with subjective judgements complement the evidence from epidemiologic mortality and morbidity studies.
The attitude towards heat as a problem one is helplessly subject to turned out to be the second major determinant of SHS at home, in general, and at work; hereby, the neg-ative coping attitude among the Karlsruhe respondents is in the same range as observed by Wittenberg et al. (2012) in Nuremberg. Nevertheless, they actually implemented more measures to cope with the heat than found in other studies in Germany and the US (Pfaffenbach and Siuda, 2010; Samp-son et al., 2013; Sheridan, 2007). The feeling of being help-lessly exposed to the heat is reflected also in the reported coping behavior, as many respondents did not have the pos-sibility to implement the measures they would actually have liked to implement: air conditioning, seeking cooler places, shifting activities to other times of the day, slowing down, and avoiding exertion; all these represent ways to either es-cape from the heat or to change or reduce activities to better sustain the heat.
The residential building and the urban environment only turned out to be determinants for SHS at home. The elements influencing SHS, namely the location of the level within a building, heat protection elements, thermal insulation, and outdoor recreation possibilities, and the residential district’s heat loading category, confirm results of previous surveys in German cities (Großmann et al., 2012; Pfaffenbach and Siuda, 2010). Moreover, they are in line with results obtained in temperature-related indoor and outdoor heat discomfort studies regarding the location of the level within the build-ing (Langner et al., 2014; White-Newsome et al., 2012). The decreasing effect elements of heat protection, outdoor recre-ation, and thermal insulation have on the SHS at home clearly illustrates at the same time that such structural measures are felt by building inhabitants during heat waves. Unlike studies that demonstrate the proportion of green space in the residen-tial area (Lafortezza et al., 2009; Xu et al., 2013), in the Karl-sruhe survey no difference was observed in the SHS stress for the walking distance to the next public garden. Empirical research in Leipzig similarly showed only a slight relation-ship of perceived heat at home with green space (Franck et al., 2013) and indicated that green space contributed rather to the general SHS than to the SHS at home (Großmann et al., 2012). In our study, having a garden was one element of the score of the outdoor recreation elements that has a signif-icant decreasing effect on subjective heat stress. Therefore, our findings underpin implicitly the role of green space as a decreasing factor for SHS at home that – in contrast to public gardens within walking distance – is directly accessible from home.
Table 5. Subjective heat stress at home by structural building elements and urban environment.
Element Category n Median Test statistics
Heat loading of residential district category 1 (lowest) 44 4 χ2=26.248∗∗∗
category 2 130 5
category 3 116 7
category 4 (highest) 27 7
House type one or two-family home 50 4 χ2=25.095∗∗∗
multiple dwelling unit 239 6
apartment tower 24 7
Multiple levels lives on one level 286 6 Z= −4.689∗∗∗
lives on multiple levels 31 3
Levela ground level 61 5 χ2=28.603∗∗∗
lower levels 54 6
middle levels 48 4
upper levels 57 7
attic 66 8
Heat-protective elements on building (score) 0 elements 28 8 χ2=23.265∗∗∗
1 element 185 6
2 elements 84 5
3 elements 6 4
Possibilities at home to be outside (score) 0 elements 53 7 χ2=35.571∗∗∗
1 element 104 7
2 elements 99 5
3 elements 45 4
Known insulation elements (score) 0 elements 78 7 χ2=36.165∗∗∗
1 element 67 6
2 elements 49 6
3 elements 46 6
4 elements 31 4
5 elements 27 5
6 elements 19 4
Walking distance to next public garden 1 to 5 min 164 6 Z= −1.547, ns
> 5 min 130 6
Test statistics: chi-square values obtained in Kruskal–Wallis tests for three or more independent samples;Zvalues obtained in Mann–WhitneyUtest for two independent samples.aWithout respondents living on multiple levels. ns denotes test results that are not significant.∗∗∗p< 0.005.
urban structures, and characteristics in the urban environ-ment that contribute to the small-scale variability also known from studies of indoor temperature distribution (Franck et al., 2013, Langner et al., 2014; White-Newsome et al., 2012). To control and isolate all influencing factors and to achieve gen-eralizable results from case studies, studies of SHS as well as studies that compare temperature measurements with sub-jective perceived temperature (Franck et al., 2013, Maras et al., 2014) would require very large samples, uniform study concepts, and similar weather conditions to achieve compa-rable and statistically significant results. Given the size of our sample, our approach to capture the effects of single build-ing elements and characteristics in scores for heat protection, thermal insulation, and outdoor recreation elements yielded reasonable results.
Table 6. Determinants of subjective heat stress (multiple regression).
Dependent variable Subjective heat stress in general Subjective heat stress at home Subjective heat stress at work
Model summary R2=0.769,Rcorr2 =0.568, R2=0.699,R2corr=0.459, R2=0.651,Rcorr2 =0.383,
F(16.279)=5.262,p<0.000 F(16.279)=16.641,p<0.000 F(16.230)=10.560,p<0.000
Independent variablesa β β β
(Constant) – – –
Health impairments from heat 0.408∗∗∗ 0.241∗∗∗ 0.295∗∗∗
Health status ns ns ns
Belief: “feel helplessly subjected to heat” 0.412∗∗∗ 0.244∗∗∗ 0.354∗∗∗
Avoid direct sun 0.128∗∗∗ ns ns
Seek cooler places ns ns −0.151∗∗
Allow oneself to rest ns ns ns
Use air conditioning ns ns −0.138∗
Use a fan ns 0.104∗ ns
Heat loading category of residential district (1–4) ns 0.122∗∗ ns
Resides on more than one level ns −0.097* ns
Level category ns 0.155∗∗∗ ns
Heat protection elements score ns −0.098∗ ns
Possibilities sitting outside score ns −0.141∗∗∗ ns
Thermal insulation elements score ns −0.135∗∗∗ ns
Age (classes) ns ns ns
Gender (male) ns ns ns
aRegression method: enter.βdenotes standardized regression coefficient. ns denotes coefficients that are not significant.∗p< 0.05.∗∗p< 0.01.∗∗∗p< 0.005.
often lived in districts with a lower heat loading and in single family homes which were also associated with lower SHS levels. These findings can therefore be attributed to a socio-spatial effect in the sample. In their socio-spatial analysis of heat-related hospital admissions due to respiratory diseases in the city of Berlin, Scherber et al. (2014) similarly observed that the elderly more often lived in areas outside the city center with lower population density and with lower heat loadings. Second, the elderly in the sample were either involved in the survey through the distribution of the paper and pencil ques-tionnaire among the network of senior groups of the senior citizens’ office of the city of Karlsruhe or they participated in the online survey. They therefore represent elderly persons who are active, take part in social activities, and are in reach of social services. The frail, bedridden elderly persons who are most susceptible to heat were not reached. This is, admit-tedly, a general problem of questionnaire studies (Bassil and Cole, 2010; Klinenberg, 2002). Furthermore, studies have shown that the elderly’s perception of their own vulnerability to heat due to age often does not correspond to their higher health risk during heat (Abrahamson et al., 2009; Wolf et al., 2010). In physiological terms, ageing is associated with intrinsic changes in the thermoregulation and with impaired homeostasis with the result that elderly persons may not be aware of getting ill from high temperatures; additionally, the use of medicines may interfere with the thermoregulation of the body (Basu and Samet, 2002; Gronlund, 2014; Koppe et al., 2004). In this regard, the result of lower SHS reported by the elderly in the sample is no contradiction. In addition to the socio-spatial and the self-selection effects in the sam-ple, the lower SHS of elderly as found in the Karlsruhe study therefore could be attributed to a combination of changes in
the effects of thermoregulation, and active coping behavior with changing daily routines more often than economically active persons.
par-ticular the case as the results of the study also show that cop-ing behavior durcop-ing heat is performed within the daily (work-ing) life, which poses constraints, limits, or opportunities – as can be seen in the case of the retired respondents – to imple-ment certain measures.
The above has already indicated limitations of the study due to the composition and effects in the sample. As already mentioned in Sect. 3.3, the analysis of further variables for SHS at work e.g., type of work and work environment, was limited and could not be included in the further investiga-tion. Therefore, in particular the results on SHS at work have only limited statistical power and need further exploration and confirmation from future studies. This is particularly im-portant as SHS at work was higher than SHS at home.
Additionally, the survey was only in the German language, which limited the participation of non-German-speaking res-idents in Karlsruhe. Regarding particular social groups to reach with the random sample of the survey, the priority of our survey immediately after the heat waves was to reach elderly people with the additional paper version of the ques-tionnaire; hereby, the differences in subjective heat stress of elderly citizens as presented in the paper cannot be related to the form of the questionnaire. Nonparametric statistic tests carried out before had shown no differences in SHS for the online/printed version of the questionnaire among the survey participants older than 65 years.
As a case study from Karlsruhe the generalizability to sub-jective heat stress in other heat wave events is limited. How-ever, while the level of heat stress surveyed in the other sur-veys in Germany differs with or without immediate experi-ence of a heat wave, the factors that make a differexperi-ence to the self-reported heat stress are very similar. In future studies that transfer our study concept to other German cities and heat waves, we therefore would expect similar results on the ma-jor or minor factors determining subjective heat stress during a heat wave, in particular for health impairments as a major determinant in several contexts of daily life and for the fac-tors that help reduce exposure to high temperatures at home or at work.
Although the survey focused on SHS and coping behavior of the respondents in their everyday life, the results still sug-gest a number of recommendations for adaptation strategies to future heat waves. Given the results that health impair-ments from heat and the negative coping attitude are the ubiq-uitous factors of SHS, the results underline the need for pre-vention of health impairments to reduce the health impacts of heat waves. While high temperatures and heat in summer are normal in common sense, it is particularly important to challenge the belief that nothing can be done to respond to and cope with the heat. Thus, in addition to heat warning systems, accompanying communication of measures to pre-vent (subjective) heat stress and health impairments is im-portant for learning and for building coping capacities to-wards future heat waves. Finally, measures to cope with heat are performed by the respondents within the constraints and
structures of daily life while they maintain the basic struc-ture of daily routine. Therefore, more research on the social processes and arrangements in current societies that limit or enable long-term adaptation to heat is necessary. This also includes more research on preventing heat stress at work.
6 Conclusion
The results of our survey on subjective heat stress (SHS) experienced by urban citizens during heat waves in August 2013 in the city of Karlsruhe, Germany, extend the current understanding of the determining factors of SHS in the con-text of everyday life. Health impairments experienced during the heat and the feeling of being helplessly exposed to the heat contributed to explaining SHS in general, at home, and at work. Elements of the urban spatial environment and the residential building were factors of SHS at home only. Given the variation of significant determinants of SHS stress in gen-eral, at home, and at work, it can be concluded that the indi-vidual SHS is context-dependent and that the determinants of SHS differ upon context regarding relevance and type. The results presented confirm and complement results of other social science studies of SHS with an expressed-preferences approach to measuring SHS. In general, they also agree with the main findings of heat stress factors obtained in studies based on measurements of meteorological parameters com-bined with morbidity and mortality data or with thermoregu-lation models.
For long-term strategies to reduce heat stress for urban cit-izens, the results illustrate, on the one hand, how structural measures for heat protection of buildings, energy-efficient re-furbishment of buildings, and urban planning measures that focus on green space and well-being in the city can help reduce subjective heat stress in residential buildings during heat waves. To develop socially appropriate adaptations that help reduce heat stress, the results, on the other hand, show that responses to heat are performed within the scope and constraints of action in daily private and professional life. Therefore, further research is needed to understand how var-ious processes of daily social (working) life enable or limit individual coping and how this may be fed into adaptation strategies.
Author contributions. Tina Kunz-Plapp is the main author of the study. Julia Hackenbruch and Janus Willem Schipper helped with the data collection and contributed to the writing of the manuscript, in particular with regards to the meteorological and climate context of the study.
anonymous reviewers for their constructive comments and sugges-tions that helped us to improve the quality of the paper. Furthermore we would like to thank the editorial team, in particular Kai Schröter, for their fast and supportive handling of the review process.
We acknowledge support by the Deutsche Forschungsgemein-schaft and Open Access Publishing Fund of Karlsruhe Institute of Technology.
The article processing charges for this open-access publication were covered by a Research
Centre of the Helmholtz Association.
Edited by: K. Schröter
Reviewed by: two anonymous referees
References
Abrahamson, V., Wolf, J., Lorenzoni, I., Fenn, B., Kovats, S., Wilkinson, P., Adger, W. N., and Raine, R.: Perceptions of heat-wave risks to health: interview-based study of older people in London and Norwich, UK, J. Public Health (Oxf.), 31, 119–126, doi:10.1093/pubmed/fdn102, 2009.
Bach, C., Birkmann, J., Kropp, J., Olonschek, M., Setiadi, N., Vollmer, M., and Walter, C.: Abschätzung der Verwund-barkeit gegenüber Hitzewellen und Starkregen, Praxis im Bevölkerungsschutz, Band 11, Auflage 09/2013, Bundesamt für Bevölkerungsschutz und Katastrophenhilfe (BBK), Bonn,
Germany, http://www.bbk.bund.de/SharedDocs/Downloads/
BBK/DE/Publikationen/Praxis_Bevoelkerungsschutz/ Band_11_PraxisBS_Hitzewellen-Starkregen.pdf;jsessionid= 199B822A577456D2630E993DAF4770CE.1_cid345?__blob= _publicationFile (last access: 31 March 2016), 172 pp., 2013. Bassil, K. L. and Cole, D. C.: Effectiveness of public health
in-terventions in reducing morbidity and mortality during heat episodes: a structured review, Int. J. Env. Res. Public Health, 7, 991–1001, doi:10.3390/ijerph7030991, 2010.
Basu, R. and Samet, J. M.: An exposure assessment study of ambi-ent heat exposure in an elderly population in Baltimore, Mary-land, Environ. Health. Persp., 110, 1219–1224, 2002.
Beniston, M., Stephenson, D. B., Christensen, O. B., Ferro, C. A., Frei, C., Goyette, S., Halsnaes, K., Holt, T., Jylhä, K., Koffi, B., Palutikof, J., Schöll, R., Semmler, T., and Woth, K.: Fu-ture extreme events in European climate: an exploration of re-gional climate model projections, Climatic Change, 81, 71–95, doi:10.1007/s10584-006-9226-z, 2007.
Birkmann, J., Cardona, O. D., Carreño, M. L., Barbat, A. H., Pelling, M., Schneiderbauer, S., Kienberger, S., Keiler, M., Alexander, D., Zeil, P., and Welle, T.: Framing vulnerability, risk and societal responses: the MOVE framework, Nat. Hazards, 67, 193–211, doi:10.1007/s11069-013-0558-5, 2013.
Blazejczyk, K., Epstein, Y., Jendritzky, G., Staiger, H., and Tinz, B.: Comparison of UTCI to selected thermal indices, Int. J. Biome-teorol., 56, 515–535, doi:10.1007/s00484-011-0453-2, 2012. Borell, C., Marí-Dell’Olmo, M., Rodíguez-Sanz, M., Garcia-Olalla,
P., Caylá, J. A., Benach, J., and Muntaner, C.: Socioeco-nomic position and excess mortality during the heat wave of 2003 in Barcelona, European J. Epidemiol., 21, 633–640, doi:10.1007/s10654-006-9047-4, 2006.
Burke, M., Hsiang, S. M., and Miguel, E: Global Non-Linear Effect of Temperature on Economic Production, Nature, 527, 235–239, doi:10.1038/nature15725, 2015.
Conti, S., Masocco, M., Meli, P., Minelli, G., Palummeri, E., Soli-mini, R., Toccaceli, V., and Vichi, M.: General and specific mor-tality among the elderly during the heat wave in Genova (Italy), Environ. Res., 103, 267–274, doi:10.1016/j.envres.2006.06.003, 2007.
D’Ippoliti, D., Michelozzi, P., Marino, C., de’Donato, F., Menne, B., Katsouyanni, K., Kirchmayer, U., Analitis, A., Medina-Ramón, M., Paldy, A., Atkinson, A., Kovats, S., Bisanti, L., Schneider, A., Lefranc, A., Iñiguez, C., and Perucci, C. A.: The impact of heat waves on mortality in 9 European cities: results from the EuroHEAT project, Environ. Health, 9, 37, doi:10.1186/1476-069X-9-37, 2010.
Dunne, J. P., Stouffer, R. J., and John, J. G.: Reductions in labour capacity from heat stress under climate warming, Nature Climate Change, 3, 563–566, doi:10.1038/nclimate1827, 2013.
EEA (European Environment Agency): Urban adaptation to climate change in Europe. Challenges and opportunities for cities to-gether with supportive national and European policies, European Environment Agency Report No. 2/2012, European Environment Agency, Copenhagen, 148 pp., doi:10.2800/41895, 2012. Fernandez Milan, B. and Creutzig, F.: Reducing urban heat wave
risk in the 21st century, Current Opinion in Environmental Sustainability, 14, 221–231, doi:10.1016/j.cosust.2015.08.002, 2015.
Fischer, E. M. and Schär, C.: Consistent geographical patterns of changes in high-impact European heat waves, Nat. Geosci., 3, 398–403, doi:10.1038/NGEO866, 2010.
Fouillet, A. Rey, G., Laurent, F., Pavillon, G., Bellec, S., Guihenneuc-Jouyaux, C., Clavel, J., Jougla, E., and Hémon, D.: Excess mortality related to the August 2003 heat wave in France, Int. Arch. Occ. Env. Hea., 80, 16–24, doi:10.1007/s00420-006-0089-4, 2006.
Franck, U., Krüger, M., Schwarz, N., Grossmann, K., Röder, S., and Schlink, U.: Heat stress in urban areas: Indoor and outdoor temperatures in different urban structure types and subjectively reported well-being during a heat wave in the city of Leipzig, Meteorol. Z., 22, 167–177, doi:10.1127/0941-2948/2013/0384, 2013.
Gabriel, K. M. and Endlicher, W. R.: Urban and rural mortality rates during heat waves in Berlin and Brandenburg, Germany, Envi-ron. Pollut., 159, 2044–2050, doi:10.1016/j.envpol.2011.01.016, 2011.
German Weather Service: Climate Data for Germany, ftp://ftp-cdc. dwd.de/pub/CDC/observations_germany/climate/ (last access: 31 March 2016), 2014.
Ginski, S., Klemme, M., Pfaffenbach, C., and Siuda, A.: An-passung durch Akzeptanz – Der Umgang lokaler Akteure mit sommerlicher Hitze, english Title: Adjustment through Acceptance – The Approach of Local Actors to Summer Heat Waves, disP – The Planning Review, 49, 86–100, doi:10.1080/02513625.2013.827514, 2013.
Grize, L., Huss, A., Thommen, O., Schindler, C., and Braun-Fahrländer, C.: Heat wave 2003 and mortality in Switzerland, Swiss Med. Wkly., 135, 200–205, 2005.
Cur-rent Epidemiology Reports, 1, 165–73, doi:10.1007/s40471-014-0014-4, 2014.
Großmann, K., Franck, U., Krüger, M., Schlink, U., Schwarz, N., and Stark, K.: Soziale Dimensionen von Hitzebelastung in Grossstädten (english title: Social dimensions of heat-stress in cities), disP – The Planning Review, 48, 56–68, doi:10.1080/02513625.2012.776818, 2012.
Hansen, A., Bi, P., Nitschke, M., Pisaniello, D., Newbury, J., and Kitson, A.: Perceptions of heat-susceptibility in older persons: Barriers to adaptation, Int. J. Env. Res. Public Health, 8, 4714– 4728, doi:10.3390/ijerph8124714, 2011.
Harlan, S. L., Brazel, A. J., Prashad, L., Stefanov, W. L., and Larsen, L.: Neighborhood microclimates and vulner-ability to heat stress, Soc. Sci. Med., 63, 2847–2863, doi:10.1016/j.socscimed.2006.07.030, 2006.
IPCC (Intergovernmental Panel on Climate Change): Climate Change 2013: The Physical Science Basis. Contribution of Working Group I to the Fifth Assessment Report of the Inter-governmental Panel on Climate Change, edited by: Stocker, T. F., Qin, D., Plattner, G.-K., Tignor, M., Allen, S. K., Boschung, J., Nauels, A., Xia, Y., Bex, V., and Midgley, P. M., Cambridge University Press, Cambridge, United Kingdom and New York, NY, USA, 1535 pp., doi:10.1017/CBO9781107415324, 2013. Jendritzky, G., de Dear, R., and Havenith, G.: UTCI – Why
another thermal index?, Int. J. Biometeorol., 56, 421–428, doi:10.1007/s00484-011-0513-7, 2012.
Kalkstein, A. J. and Sheridan, S. C.: The social impacts of the heat-health watch/warning system in Phoenix, Arizona: assessing the perceived risk and response of the public, Int. J. Biometeorol., 52, 43–55, doi:10.1007/s00484-006-0073-4, 2007.
Klinenberg, E.: Heat Wave. A social autopsy of disaster in Chicago, The University of Chigago Press, Chicago, 305 pp., 2002. Koppe, C., Kovats, S. R., Menne, B., and Jendritzky, G.:
Heat-waves: risks and responses, Health and Global Environmen-tal Change Series No. 2, WHO Regional Office for Eu-rope, Copenhagen, http://www.euro.who.int/__data/assets/pdf_ file/0008/96965/E82629.pdf (last access: 31 March 2016), 124 pp., 2004.
Laaidi, K., Zeghnoun, A., Dousset, B., Bretin, P., Vandentorren, S., Giraudet, E., and Beaudeau, P.: The impact of heat islands on mortality in Paris during the August 2003 heat wave, Environ. Health Persp., 120, 254–259, doi:10.1289/ehp.1103532, 2012. Lafortezza, R., Carrus, G., Sanesi, G., and Davies, C.:
Bene-fits and well-being perceived by people visiting green spaces in periods of heat stress, Urban For. Urban Gree., 8, 97–108, doi:10.1016/j.ufug.2009.02.003, 2009.
Langner, M., Scherber, K., and Endlicher, W. R.: Indoor heat stress: An assessment of human bioclimate using the UTCI in different buildings in Berlin, Erde, 144, 260–273, doi:10.12854/erde-144-18, 2014.
Laschewski, G. and Jendritzky, G.: Effects of the thermal environ-ment on human health: an investigation of 30 years of daily mor-tality from SW Germany, Clim. Res., 21, 91–103, 2002. Lissner, T. K., Holsten, A., Walther, C., and Kropp, J. P.: Towards
sectoral and standardised vulnerability assessments: the example of heatwave impacts on human health, Climatic Change, 112, 687–708, doi:10.1007/s10584-011-0231-5, 2012.
Madrigano, J., Mittleman, M. A., Baccarelli, A., Goldberg, R., Melly, S., von Klot, S., and Schwartz, J.: Temperature,
Myocar-dial Infarction, and Mortality: Effect Modification by Individ-ual and Area-Level Characteristics, Epidemiology, 24, 439–446, doi:10.1097/EDE.0b013e3182878397, 2013.
Maras, I., Buttstädt, M., Hahmann, J., Hofmeister, H., and Schneider, C.: Investigating public places and impacts of heat stress in the city of Aachen, Germany, Erde, 144, 290–303, doi:10.12854/erde-144-20, 2014
Mühr, B.: Klimadiagramme weltweit, www.klimadiagramme.de (last access: 31 March 2016), 2014.
Nachbarschaftsverband Karlsruhe: ExWoSt-Modellvorhaben
Innenentwicklung versus Klimakomfort Nachbarschaftsverband
Karlsruhe, http://www.nachbarschaftsverband-karlsruhe.
de/b4/exwost/HF_sections/content/ZZkHSr5tGIMDWn/
ZZkNvxspnzilQZ/ExWoSt_NVK_A4_Web.pdf (last access:
31 March 2016), 39 pp., 2013.
Oke, T. R.: City size and the urban heat island, Atmos. Environ., 7, 769–779, 1973.
Patz, J. A., Campbell-Lendrum, D., Holloway, T., and Foley, J. A.: Impact of regional climate change on human health, Nature, 438, 310–317, doi:10.1038/nature04188, 2005.
Pfaffenbach, C. and Siuda, A.: Hitzebelastung und Hitze-wahrnehmung im Wohn- und Arbeitsumfeld der Generation 50plus in Aachen, Europa Regional, http://nbn-resolving.de/urn: nbn:de:0168-ssoar-314920 (last access: 31 March 2016), 18, 192–206, 2010.
Revi, A., Satterthwaite, D. E., Aragón-Durand, F., Corfee-Morlot, J., Kiunsi, R. B. R., Pelling, M., Roberts, D. C., and Solecki, W.: Urban areas, in: Climate Change 2014: Impacts, Adaptation, and Vulnerability. Part A: Global and Sectoral Aspects, Contribution of Working Group II to the Fifth Assessment Report of the In-tergovernmental Panel on Climate Change, edited by: Field, C. B., Barros, V. R., Dokken, D. J., Mach, K. J., Mastrandrea, M. D., Bilir, T. E., Chatterjee, M., Ebi, K. L., Estrada, Y. O., Gen-ova, R. C., Girma, B., Kissel, E. S., Levy, A. N., MacCracken, S., Mastrandrea, P. R., and White, L. L., Cambridge University Press, Cambridge, United Kingdom and New York, NY, USA, 535–612, 2014.
Revich, B. A. and Shaposhnikov, D. A.: Climate change, heat waves, and cold spells as risk factors for increased mortality in some regions of Russia, Studies on Russian Economic Develop-ment, 23, 195–207, doi:10.1134/S1075700712020116, 2012. Robine, J.-M., Cheung, S. L. K., Le Roya, S., van Oyen, H.,
Grif-fiths, C., Michel, J.-P., and Herrmann, F. R.: Death toll exceeded 70,000 in Europe during the summer of 2003, C. R. Biol., 331, 171–178, doi:10.1016/j.crvi.2007.12.001, 2008.
Robinson, P. J.: On the definition of a Heat Wave,
J. Appl. Meteorol., 40, 762–775,
doi:10.1175/1520-0450(2001)040<0762:OTDOAH>2.0.CO;2, 2001.
Sampson, N. R., Gronlund, C. J., Buxton, M. A., Catalano, L., White-Newsome, J. L., Conlon, K. C., O’Neill, M. A., McCormick, S., and Parker, E. A.: Staying cool in a changing climate: Reaching vulnerable populations dur-ing heat events, Global Environ. Chang., 23, 475–484, doi:10.1016/j.gloenvcha.2012.12.011, 2013.