EFFECTS OF AGE, HEIGHT AD WEIGHT VARIATIOS O ASCORBIC ACID, BLOOD PRESSURE AD HDL-CHOLESTEROL LEVELS I ORMAL AD
HYPERTESIVE MALES
M. Zahoor-ul-Hassan Dogar1, Muhammad Shoaib Akhtar1 Shazia Tabbasum2 and Shafqat Siddique Ansir3
1
Faculty of Pharmacy, University of Sargodha, Sargodha; 2G. C. University, Faisalabad and
3
University of Agriculture, Faisalabad-Pakistan.
Address for Correspondence: Prof Dr Muhammad Shoaib Akhtar, Department of Pharmacology, Faculty of Pharmacy, University of Sargodha, Sargodha-40100, Pakistan.
Summary
The plasma ascorbic acid (PAA), HDL-C, weight, height and levels of blood pressure were
evaluated in different age groups in normal, mild and moderate hypertensive subjects. The
results also showed that 24 hrs urinary excretion of ascorbic acid is indirectly related with its
plasma level, age and blood pressure while no relationship was found with weight and height of
subjects. However, HDL-cholesterol and 24 hrs urinary ascorbic acid were positively correlated
with each other but negatively correlated with age in normotensive individuals. The weight in
hypertensive and control groups has no direct relation with the age. Regarding age of subjects,
results are interesting as it was highest in 41-45 years age-group in control and in 51-55 years
age-group in both mild and moderate hypertensives. The systolic and diastolic BP correlated
directly with age in control as well as in hypertensive groups and was increased to the highest
level in moderate hypertensives. The PAA levels in hypertensive group were significantly
higher but in comparison to mild and moderate hypertensives, levels were lower significantly in
both hypertensives than normal toll (?) group. It may be concluded that PAA status in those
having risk of cardiovascular mortality secondary to hypertension should definitely be evaluated
as its lower values can give rise to rise in blood pressure, as PAA deficiency is completely
treatable and curable while hypertension is only treatable but not curable.
Introduction
Determination of vitamin C is of great clinical importance for evaluating its deficiency in
various diseases (1) while blood and urine examinations are usually taken as an index for
checking adequacy of this vitamin in the body (2). Various acids are used for extraction of
ascorbic acid, including acetic, trichloracetic, meta-phosphoric and oxalic acids. The later two
acids not only stabilize vitamin C by reducing the pH of medium but also form complexes with
metal ions e.g. copper; preventing the catalytic oxidation of this vitamin.
Ascorbic acid is an example of the ene-diol functional compounds. Such compounds oxidize
smoothly to dehydro compounds by variety of oxidizing agents. This gives the basis of their
determination by oxidation method (5, 6). Numerous methods have been reported (7,8) for
determination of vitamin C but most of the methods are tedious, lengthy, time consuming and
not free from interferences (9). Correlation between vitamin C and heart disease risk factors
including plasma cholesterol and blood pressure levels, are the primary evidences relating
vitamin C to heart disease (8). Positive correlation was reported between plasma ascorbic acid
and HDL-cholesterol in young and elderly Welish residents by Bur et al (2) and proved by
Jacques (10). Some studies showed decrease in BP with an increase in PAA levels. This was
6-7% in young Japanese males (11), 4 -5% in middle aged Finnish males (12) and 6-11% in men
and women from United States (13). The present study was conducted with the aim to find any
correlation between plasma and/or urinary ascorbic acid with HDL-C, age, weight, levels of
blood pressure in human subjects.
Materials And Methods
Experimental Procedure
The normotensive and hypertensive subjects were selected randomly from local
population following the criterion of Andreoli et al (14). The 24 hours urinary samples were
collected from 100 subjects; 20 healthy controls and 80 hypertensive adults which were
subdivided into mild and moderate hypertensive subjects (40 in each group). Samples were
stored immediately at -4° C for determination of ascorbic acid. Fresh blood samples were also
collected from the same subjects and were immediately stored at -4° C in bottles, containing 3%
refrigerator for future record. Vitamin C contents of blood and urine samples from 10 normal
subjects were estimated first as a pilot study to evaluate the best possible method. Three
different methods applied were Iqbal and Yaqub (9), Barakat et al (15) and modified Roe and
Keuther method cited by Nino and Shah (16). HDL-Cholesterol was isolated by Lopes-Virella
et al (17) and its cholesterol contents were estimated by Richmond (18) while systolic and
diastolic BP (SBP and DBP) were determined by a standard sphygmomanometer. Similarly,
height and weight were measured by measuring scales. The results were evaluated by applying
appropriate statistical tests (19).
Results and Discussion
The results obtained have been summarized in Tables 1-VII and were compared in both normal
and hypertensive subjects. The 24 hour urinary excretion in controls were 450.26, 420.16 and
350.16 mg/day in 41-45, 46-50 and 51-55 years age groups, respectively and in hypertensive the
values were 323.5, 285.2 and 220.1 mg/day, respectively. In mild hypertensive subgroup, these
were 330.0, 300.0 and 240.0 mg/day and in moderate hypertensive the values were 315.4, 270.2
and 200.2 mg/day, respectively. These data indicated that in normal subjects values were within
range as also reported by Haris and Ray (20) while these values were below normal in
hyper-tensive subjects. The PAA levels found in normohyper-tensive controls of 41-45, 46-50 and 51-55
years old male adults were 0.659, 0.470 and 0.368 mg/dl, respectively. These values are similar
and consistent with the values of Evans et al (21) i.e., 0.37 ± 0.19mg/dl, Greco and La Rocca
(22) i.e., 0.588 ± 0.034 mg/dl and Chio et al (23) i.e., 42.3 ± 21.2 mg/dl and Yoshioka et al (11)
i.e., 0.48 mg/dl) in normotensive subjects. It was further observed that the values were 0.420,
0.376 and 0.174 mg/dl in hypertensives which decreased with the severity of hypertension.
Similarly, HDL-Cholesterol in control was 50.34, 43.23 and 39.95 mg/dl while in hypertensives
these values were 43.49, 41.44 and 37.24 mg/dl, respectively. It is clear that the values were
decreased with the age in both the groups. On the other hand, SBP increased with the age in
both the groups and similar was the case with DBP.
The data showed that 24 hour urinary excretion is indirectly related with PAA, age and blood
pressure levels, while no relationship could be found with weight and height of the subjects.
The correlation co-efficients of PAA with height, age and weight showed that PAA levels had
with the weight of the subjects (r = -0.213). From the r values it was clear that age has stronger
correlation with PAA level than the weight of the subjects.
PAA and HDL cholesterol were positively correlated with each other and have negative
correlation with age in normotensive individuals. It may be suggested that similar patterns were
seen in both the groups of hypertensive subjects too. The r-value for HDL-C with age was
0.482, with weight, it was -0.103 and with DBP, it was -0.658. Similarly, PAA with SBP has
negative correlation with r = -0.891 and with DBP r = -0.826 while with HDL cholesterol, the r
value was positive i.e. 0.869.
No direct relation was also seen with the age in both groups. However, compared to other
groups the weight was highest in second (46-50 year) age group. The finding seems difficult to
explain; probably that it was due to relative inactivity in all the groups with passage of age. In
male hypertensives the weight was highest in 46-50 years and in moderate hypertensives of
51-55 years age groups which cannot be explained theoretically. Similarly, the weight patterns in
control and hypertensive groups were almost similar (Tables I – VI). Regarding height, our
results were interesting as it is highest in 41-45 years age in control group, while the highest
height was found in 51-55 years age group in both the mild and moderate hypertensive subjects.
Again probably the 41-45 years control group appears to be more active and utilizing better
nutrients due to active life style. The relative comparison showed no significant difference
between control and mild hypertensive subjects, while in moderate hypertensive subjects the
height had definite correlation with the levels of blood pressure. The height may be co-related
with built of body and the taller people had higher blood pressure as shown in Table V.
Comparison of plasma ascorbic acid in control and hypertensive subjects showed that levels
were higher in control than hypertensive patients. Variation in different age groups decreased in
control and hypertensive subjects. It showed higher decrease with age in hypertensive subjects
and especially the highest decrease was noted in moderate hypertensive subjects (Table I).
Regarding HDL cholesterol, it was found that results are almost similar to ascorbic acid as
HDL-C also decreased with age in both groups. It appears that the rise of blood pressure with
age was inversely related with HDL-C in blood. However, in our data the HDL-C in moderate
hypertensive did not decrease directly with the age as it was highest in second (46-50 year) age
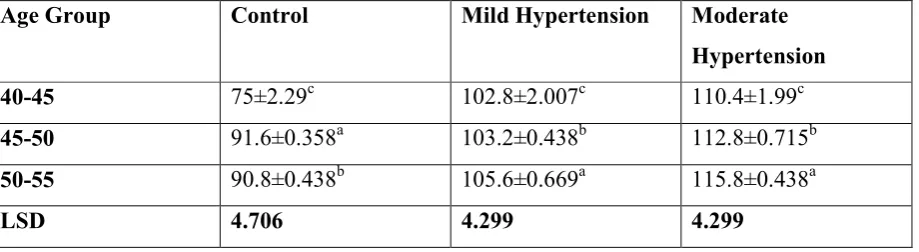
group (Table III). Comparison of blood pressure levels, SBP correlated directly with age in
subjects. These results are similar to others studies (22, 23, 24). The DBP also increased directly
with age and were highest in 3rd (51-55 years) age group in both the control and hypertensive
subjects. In addition, they were highest in mild hypertensive and not in moderate hypertensive
subjects as shown in Table VI.
The levels of PAA were with in normal range in normotensive male adults. The levels in the
hypertensive group were significantly lower than the normal control group. When the mild and
moderate hypertensive groups were compared with normotensive controls it was found that the
levels were lower significantly in both the hypertensive groups. There was a strong negative
correlation between PAA and blood pressure. Plasma ascorbic acid deficiency and subsequently
its reduced utilization by the tissue due to one reason or the other may be responsible for the
development of hypertension or vice versa. The ascorbic acid may regulate blood pressure
through its check over the normal lipid metabolism.
The PAA values in hypertensive group were 0.295± 0.10 mg/dl while in mild and moderate
hypertensives the values were 0.374 ± 0.068 mg/dl and 0.218 ± 0.0077 mg/dl, respectively as
already reported (2, 22, and 24). There was a continuous rising trend of BP and fall in PAA with
age. Similar results were also observed by Jacques et al (10). The values decreased with age,
probably the reason is that the elderly appears to be some what less likely than young adults to
consume fresh fruits and vegetables and adequate amount of vitamin C. The levels are even less
in aged hypertensive subjects. This factual evidence suggests a need of extra ascorbic acid,
especially in four population groups, hypertensive, elderly, smokers and diabetics (25).
Yoshioka et al (11) showed significant association of PAA with SBP and DBP. The study has
reported an inverse association between PAA and blood pressure (r = -0.264). Similarly,
negative association between blood pressure and PAA had been demonstrated by Choi et al (23)
in elderly Chinese Americans. They showed that PAA is correlated positively with HDL-C (r =
0.09). In the present study, HDL-C has been observed to significantly decrease with the rise in
blood pressure. These findings are similar to Bates et al (24) and PAA values of Greco and La
Roca (22) were are quite close to our values.
The possible explanation to above findings is that protective factors such as superoxide
dismutase, glutathione peroxidase and catalase are normally present in cells to prevent damage
by free radicals which exert dilatatory effect on blood vessels and imbalance of nitric oxide free
be protected by antioxidants like vitamin C which maintains adequate level of sulphated
glycosa-aminoglycans and thus help to regulate the process of atherosclerosis. Similarly,
vitamin C concentration associated with reduced 6-ketoprostaglandin F1 alpha, a possible
protective agent for blood pressure rise. Ascorbic acid can also exert a chelating effect on intra
and extra cellular calcium (27). Our data have showed that plasma ascorbic acid had a direct
positive correlation with HDL cholesterol, as ascorbic acid supplementation increases the
HDL-C in blood. In a study, 500 mg/day ascorbic acid to volunteer had led to increase in HDL-HDL-C. The
mechanism is still not clear. Triau (28) has reported that oxidation modifies Apolipoprotein A1
structure which alters the ability of apoprotein to associate the lipids and thus HDL particle
oxidative modification may be prevented by antioxidants like vitamin C. Therefore, it may be
suggested that ascorbic acid deficiency might be responsible for development of hypertension.
It would be important to access the plasma ascorbic acid status along with other factors. It will
not only be beneficial for prevention and treatment of the disease but also to propose ascorbic
acid reduction in plasma as independent causative agent in development of primary
hypertension. Thus PAA status in those having risk of cardiovascular mortality secondary to
hypertension should definitely be benefited, as PAA deficiency is completely treatable and
curable while hypertension is only treatable but not curable.
Table I: Comparison of Plasma Ascorbic acid (mg/dl) between different age groups
Age Group Control Mild Hypertension Moderate
Hypertension
40-45 0.659±0.014a 0.418±0.019a 0.421±0.007a
45-50 0.47±0.027b 0.38±0.029b 0.372±0.038a
50-55 0.368±0.025c 0.205±0.020c 0.142±0.020b
Table II: Comparison of 24 hours Urinary Ascorbic acid (mg) between different age groups
Age Group Control Mild Hypertension Moderate
Hypertension
40-45 450.26±0.545a 330.00±0.489a 315.40±0.920a
45-50 420.16±0. 715b 300.02±0.748b 270.2±0.593b
50-55 350.4±0.606c 240.00±0.748c 200.2±0.769c
LSD 2.15 3.71 2.66
Table III: Comparison of HDL-C (mg/dl) between different age groups
Age Group Control Mild Hypertension Moderate
Hypertension
40-45 50.34±0.921a 46.19±0.444a 40.75±1.26ab
45-50 43.23±0.822b 41.77±0.814b 41.98±1.36a
50-55 39.95±1.42b 37.43±0.935c 37.09±1.38b
LSD 3.748 3.849 4.603
Table IV: Comparison of SBP (mm of Hg) between different age groups
Age Group Control Mild Hypertension Moderate
Hypertension
40-45 112.6±2.49c 122.4±2.49c 130±0.979c
45-50 123±1.131b 171.2±3.46b 170.6±3.14b
50-55 137.2±5.47a 190.2±2.90a 195±2a
LSD 12.157 10.256 7.664
Table V Comparison of DBP (mm of Hg) between different age groups
Age Group Control Mild Hypertension Moderate
Hypertension
40-45 75±2.29c 102.8±2.007c 110.4±1.99c
45-50 91.6±0.358a 103.2±0.438b 112.8±0.715b
50-55 90.8±0.438b 105.6±0.669a 115.8±0.438a
Table VI Comparison of Height (meters) between different age groups
Age Group Control Mild Hypertension Moderate
Hypertension
40-45 168±1.876a 164.6±1.31b 164.2±0.912c
45-50 165.6±4.12a 165.2±1.145ab 165.2±2.124b
50-55 163±1.74a 169.6±1.458a 167.4±0.963a
LSD 9.655 4.521 4.981
Table VII Comparison of Weight (Kg) between different age groups
Age Group Control Mild Hypertension Moderate
Hypertension
40-45 67±3.2a 66.2±2.456b 63.2±1.906a
45-50 69.4±2.128a 76±1.743a 74.8±2.644a
50-55 64.4±1.219a 69.8±2.198ab 77.4±3.377a
LSD 8.019 7.416 9.335
References
1. Simon, J. A. Vitamin c And Cardiovascular Disease: A Review. J. Am. Coll. Nuti. 11: 107-125 (1992).
2. Burr, M. L. Bates, C. J. Milbank, J. E. and Varnell, J. W. G. The relationship between Plasma ascorbic acid and lipid concentration in fasting men. Hum. Nutr. 36: 135-139 (1982).
3. Bender A and Mayes PA. Vitamins and Minerals. In: Harper’s Illustrated Biochemistry Murray RK,Granner DK,Mayes PA and Rodwell VW(editors).26th edition. McGraw Hills. New York. (2003), pp 481-97.
4. Zilva JF and Pannal PR. Clinical Chemistry in Diagnosis and Treatment. 4th Edition. Singapore PG Publishing. (1985), pp 232-250.
5. Dietary Reference in take of Vitamin C, Vitamin E, Selenium, Beta- Carotenes and other Carotenoids. Washington DC. Nat. Acad. Press. (2000).
6. McCornick DB,Suttie JW,Wagner C(editors). Vitamin and Coenzyme In: Methods in Enzymology. Vol. 280 Port. J.San. Diego. Academic. Press.(1997).
7. Basu TK and Dikerson JW (editors)Vitamins in Human Health and Disease. Oxford. Oxford Uni. Press.(1996).
8. McCornick DB.Vitamins Structure and Functions. In: Meyers RA(editor). Encyclopedia of Mol. Biology and Mol. Medicine. Philadelphia. WB Saunders. 6: 999-1026. (1999).
10.Jacques, P. F. Hartz, S. C. McGandy, R. B. Jacob, R. A. and Russel, R. M. Ascorbic acid, HDl and total plasma cholesterol in the elderly. J. Am. Coll. Nutr. 6: 169-177. (1987). 11.Yoshioka, M. Matsushita, T and Chuman, Y. In\verse association of serum ascorbic acid
level and blood pressure or rate of hypertension in male adult aged 30-39 years. Int. J. Vit. Nutr. Res. 54: 343-347 (1984).
12.Salonen, J. T. Salonen, R. and Ihanainen. Blood pressure dietry fats and antioxidants. Am. J. Clin. Nutr. 48: 1226-32 (1988)
13.Cohen, L., E. Feldman, B., Feldman, D. H. and Hames, C. G. Dietary antioxidants and blood pressure. Am. J. Clin. Nutr. 51: 512-515. (1990).
14.Andreoli, T. E., Bennet, J. C., Carpenter, C. J., Plum, F,. Smith, L. H. jr. and Cecil. Essential of medicine. 3rd Edition. Philadelphia: W. B. Saunders, (1993). pp. 230-237
15.Barakat MZ, El-Wahab MFA and El-Sadr MN. New titrimetric method for the Determination of Ascorbic Acid. Anal Chem. 1955; 27:536,cited by Mathur NK and
Narang CK. Determination of Organic Compounds with N-Bromo succinamide and related Compounds. Academic Press. London. (1975) pp 41-45.
16.Nino HV, Shah W.Vitamins In:Fundamentals of Clinical Chemistry Tietz NW(editor). 2nd edition. WB Saunders. Philadelphia.(1986) pp 547-50.17
17.Lopes-Virella, M. F., Stone, P., Ellis, S., Colwell, J. A. Cholestrol determination in high density lipoprotein separated by three different methods. Clin. Chem. 23: 882-884 (1977). 18.Richmond, W., Total Cholestrol estimation by CHAD-POP enzymatic methods. Clin.
Chem. 19: 1350 (1973). 19.Steel Tone
20.Mohammad F. Statistical Methods and Data Analysis. 1st Edition.Faisalabad. Kitab Markiz. (1991) pp 188-254.
21.Haris, L. J. and Ray S. N. cited by Milner. G. Ascorbic acid in chronic psychiatric patients; a controlled trial. Br. J. Psy. 109: 294-295 (1963). (HTML revised 09-08-2005).
22.Evan, R. M. Crrie, L. and Cambell, A. The distribution of ascorbic acid between various cellular components of blood, in normal individuals and its relation to the plasma concentration. Br. J. Nutr.. 47: 473-482 (1982).
23.Greco, C. and LaRocca, L. Correlation between chronic hypovitaminosis in old age and plasma levels of cholesterol and triglycerides. Int. J. Vit. Nutr. Res. 23: 129-136.(1982) 24.Choi, E. S. K., Paul, F. Jacques, S. D. Gerard, E. D. Jacob, R. A. Correlation of blood
pressure with plasma ascorbic acid. Nutr. Res. 11: 1377-1382 (1991).
25.Bates, C. J., Burr, M. K. and Leger, A. S. Sr. Vitamin C, high density lipoproteins and heart diseases in elderly subjects. Age and Ageing. 8: 177-182 (1979).
26.Bulpitt, C. J. Vitamin C and blood pressure. Editorial Review. J. Hypertension. 8: 1071-1075 (1990).
27.Ceriello, A., Gingliano, D., Quatrato, A. adn Lefebvse, P. J. Antioxidants shows an antihypertensive effects in diabetes and hypertensive subject. Clin. Sci. 81: 739-742 (1991).
28.Sharma, S. G. and Wilson, W. M. Role of ascorbicx acid in cellular calcium control. Int. J. Vit. Nutr. Res. 50: 164-172. (1980)