by Data Source
WHAT’S KNOWN ON THIS SUBJECT: Administrative health insurance claims have limitations when measuring care quality.
WHAT THIS STUDY ADDS: Children’s care quality measures assessed using administrative claims alone may not accurately reflect care quality. Use of electronic health record data in combination with administrative claims data provides an opportunity for more complete measurement.
abstract
OBJECTIVE:To evaluate selected Children’s Health Insurance Program Reauthorization Act claims-based quality measures using claims data alone, electronic health record (EHR) data alone, and both data sources combined.
METHODS:Our population included pediatric patients from 46 clinics in the OCHIN network of community health centers, who were continu-ously enrolled in Oregon’s public health insurance program during 2010. Within this population, we calculated selected pediatric care quality measures according to the Children’s Health Insurance Pro-gram Reauthorization Act technical specifications within administra-tive claims. We then calculated these measures in the same cohort, by using EHR data, by using the technical specifications plus clinical data previously shown to enhance capture of a given measure. We used the
kstatistic to determine agreement in measurement when using claims versus EHR data. Finally, we measured quality of care delivered to the study population, when using a combined dataset of linked, patient-level administrative claims and EHR data.
RESULTS: When using administrative claims data, 1.0% of children (aged 3–17) had a BMI percentile recorded, compared with 71.9% based on the EHR data (kagreement [k] #0.01), and 72.0% in the combined dataset. Among children turning 2 in 2010, 20.2% received all recommended immunizations according to the administrative claims data, 17.2% according to the EHR data (k =0.82), and 21.4% according to the combined dataset.
CONCLUSIONS:Children’s care quality measures may not be accurate when assessed using only administrative claims. Adding EHR data to administrative claims data may yield more complete measurement. Pediatrics2014;133:e1676–e1682
AUTHORS:Heather Angier, MPH,aRachel Gold, PhD, MPH,b,c Charles Gallia, PhD,dAllison Casciato, BA (MSIV),a Carrie J. Tillotson, MPH,aMiguel Marino, PhD,aRita Mangione-Smith, MD, MPH,eand Jennifer E. DeVoe, MD, DPhila,c
aOregon Health & Science University, Portland, Oregon;bKaiser
Permanente Northwest, Center for Health Research, Portland, Oregon;cResearch, OCHIN, Inc., Portland, Oregon;dOffice of Health
Analytics, Oregon Health Authority, State of Oregon, Salem, Oregon; andeSeattle Children’s Research Institute, Seattle,
Washington
KEY WORDS
pediatrics, quality of care, electronic health records, Medicaid
ABBREVIATIONS
CHIP—Children’s Health Insurance Program
CHIPRA—Children’s Health Insurance Program Reauthorization Act
EHR—electronic health record
ICD-9—International Classification of Diseases, Ninth Revision ICD-10-CM—International Classification of Diseases, Tenth Revision, Clinical Modification
OHP—Oregon Health Plan
Ms Angier helped conceptualize and design the study, and drafted the initial manuscript; Drs Gold, Gallia, and DeVoe conceptualized and designed the study, and critically reviewed the manuscript; Ms Casciato helped design the study, and critically reviewed the manuscript; Ms Tillotson and Dr Marino carried out analyses, and reviewed and revised the manuscript; Dr Mangione-Smith critically reviewed the manuscript; and all authors approved thefinal manuscript as submitted. www.pediatrics.org/cgi/doi/10.1542/peds.2013-4277 doi:10.1542/peds.2013-4277
Accepted for publication Feb 21, 2014
Address correspondence to Heather Angier, MPH, Oregon Health & Science University, Department of Family Medicine, 3181 Sam Jackson Rd, mailcode FM, Portland, OR 97239. E-mail: [email protected]
PEDIATRICS (ISSN Numbers: Print, 0031-4005; Online, 1098-4275). Copyright © 2014 by the American Academy of Pediatrics
FINANCIAL DISCLOSURE:The authors have indicated they have nofinancial relationships relevant to this article to disclose.
FUNDING:This work wasfinancially supported by the Agency for Healthcare Research and Quality, grant 1 R01 HS018569, and the Oregon Health & Science University, Department of Family Medicine. The funding agencies had no involvement in the preparation, review, or approval of the manuscript.
The Children’s Health Insurance Pro-gram Reauthorization Act of 2009 (CHIPRA), intended to increase the number of children with health in-surance, also mandated that a set of pediatric care quality measures be selected.1,2An initial set of 24 CHIPRA core measures, chosen for their val-idity, importance to health outcomes, and ability to be evaluated by using states’Medicaid administrative claims data, were identified by experts to meet this mandate.1,3–7
States are encouraged to report on the CHIPRA measures to assess the quality of care provided to children in their Medicaid program and Children’s Health Insurance Program (CHIP).4 Methods for operationalizing each mea-sure are given in the CHIPRA Technical Specifications and Resource Manual.8 In most cases, these methods contain parameters for defining the population of children to include in the rate de-nominator, and a set of diagnostic and procedure codes from administrative claims data to identify provided care (the numerator). A “hybrid” method using manual chart review on a sample of children is also given for defining some of the measures; however, such reviews are rarely feasible for states to conduct, as obtaining medical record data can be difficult, costly, and time-consuming.8,9
The CHIPRA measures are an important step toward standardizing pediatric care quality assessments. However, limitations to using administrative claims data for such purposes have been shown in previous research assessing care quality.10–13Although adding data from discreet electronic health record (EHR) datafields shows promise in improving the accuracy of claims-based quality measurement,11,14,15 assessments us-ing EHR data alone may have limi-tations.16–18For example, in a study of the quality of care provided to adults with diabetes, neither Medicaid
ad-ministrative claims nor EHR data alone yielded a complete capture of provided services: 12% of cholesterol screen-ings received were documented in Medicaid claims but not the EHR, 49% were documented in the EHR but not in Medicaid claims, and only 39% were documented in both data sources.10
After the CHIPRA measures were ini-tially developed, Gold et al12determined which of these claims-based measures could feasibly be calculated by using electronically abstracted EHR data, and what modifications to the claims-based technical specifications were needed, if any, to enable such EHR-based mea-surement. Building directly on that landmark study, the present analysis sought to evaluate the accuracy of se-lected CHIPRA claims-based measures, when based on administrative claims data alone, EHR data alone, or both data sources combined. We also built on this previous work by assessing the quality of care delivered to a single cohort of continuously insured chil-dren who were established patients within the OCHIN network of community health centers.
METHODS
Data Sources
Oregon Health Plan Administrative Data
Oregon’s Medicaid and CHIP insurance programs are both operated by the Oregon Health Plan (OHP). The OHP pays clinics for provided health care, and thus receives claims (ie, diagnosis and procedure codes) for all OHP-insured children in Oregon.
EHR Data
“OCHIN, Inc.,” originally the Oregon Community Health Information Net-work, provides and maintains a com-prehensive Epic EHR infrastructure for member clinics. All sites share a single, linked EHR and patients have 1 unique
record; data are stored in a central repository that can be searched elec-tronically.19All of the EHR data used in this study were pulled by using auto-mated extraction from 46 OCHIN clinics in Oregon that had the full EHR imple-mented before July 1, 2009 (6 months before the study year).
Study Population
We selected a study cohort of children and adolescents (aged#21 years) who were continuously insured by OHP and had at least 1 outpatient visit at a study clinic in 2010 (n= 22 925 children). We deterministically linked records for these children who appeared in both the OHP claims and the OCHIN EHR datasets by using the child’s unique OHP client identification number. For all of the measures calculated here, we used the CHIPRA technical specifications’ definition of continuously insured: briefly, a child or adolescent must have 12 months of coverage with no more than one 45-day gap. Depending on the measure, different time periods apply for when the child/adolescent had to have continuous insurance; for ex-ample, the BMI percentile measure requires continuous insurance during the measurement year, whereas the childhood immunization measure re-quires continuous insurance during the year before the child’s second birthday.8
Measures
prescribed attention-deficit/hyperactivity disorder medication had a small de-nominator (n ∼ 151). The prenatal measures were beyond the scope of this project.
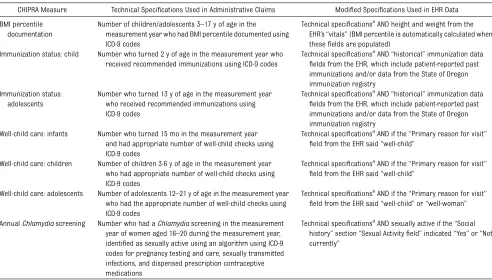
In analyses within administrative claims data, we used the exact measure spec-ifications from the Initial Core Set of Children’s Health Care Quality Mea-sures: Technical Specifications and Resource Manual for Federal Fiscal Year 2011.8Optional exclusions for the measures were not used. In the as-sessments using electronically pulled EHR data, we calculated the measures by using the technical specifications (ie, CPT codes, and so forth) plus rele-vant clinical data (ie, historical immu-nizations, primary reason for the visit, and so forth) as outlined by Gold et al.12 See Table 1.
graphic characteristics of the study population. Second, we assessed rates of receipt for each of the selected quality measures among the measure-specific subgroup of children in the study population, by using the admin-istrative claims data, and again by using the EHR data (which included the additional fields unique to the EHR dataset described previously). Third, we tested for agreement in quality measurement using the administrative claims dataset versus the EHR dataset, by using the k statistic. Fourth, we assessed care quality by using a linked dataset that combined the adminis-trative claims and EHR data. Finally, among all services documented in the combined dataset, we determined the percentage found in claims alone, the EHR alone, or in both data sources. All
Cary, NC). This study was approved by the institutional review board at Oregon Health & Science University.
RESULTS
Demographics
The mean age of the children in our study population was 8.5 years. More than half were white (52.4%) and nearly half were Hispanic (47.3%). The main languages spoken were English (45.5%) and Spanish (41.0%) (Table 2).
Measures Assessed by Using Claims Data Alone, EHR Data Alone, or a Combined Claims/EHR Dataset
BMI
In the administrative claims data, 1.0% of children (aged 3–17) in our study pop-ulation had a BMI percentile recorded in
TABLE 1 Specifications Used to Assess Selected CHIPRA Measures by Using Administrative Claims and EHR Data
CHIPRA Measure Technical Specifications Used in Administrative Claims Modified Specifications Used in EHR Data BMI percentile
documentation
Number of children/adolescents 3–17 y of age in the measurement year who had BMI percentile documented using ICD-9 codes
Technical specificationsaAND height and weight from the EHR’s“vitals”(BMI percentile is automatically calculated when thesefields are populated)
Immunization status: child Number who turned 2 y of age in the measurement year who received recommended immunizations using ICD-9 codes
Technical specificationsaAND“historical”immunization data
fields from the EHR, which include patient-reported past immunizations and/or data from the State of Oregon immunization registry
Immunization status: adolescents
Number who turned 13 y of age in the measurement year who received recommended immunizations using ICD-9 codes
Technical specificationsa
AND“historical”immunization data
fields from the EHR, which include patient-reported past immunizations and/or data from the State of Oregon immunization registry
Well-child care: infants Number who turned 15 mo in the measurement year and had appropriate number of well-child checks using ICD-9 codes
Technical specificationsa
AND if the“Primary reason for visit”
field from the EHR said“well-child”
Well-child care: children Number of children 3-6 y of age in the measurement year who had appropriate number of well-child checks using ICD-9 codes
Technical specificationsa
AND if the“Primary reason for visit”
field from the EHR said“well-child”
Well-child care: adolescents Number of adolescents 12–21 y of age in the measurement year who had the appropriate number of well-child checks using ICD-9 codes
Technical specificationsaAND if the“Primary reason for visit”
field from the EHR said“well-child”or“well-woman”
AnnualChlamydiascreening Number who had aChlamydiascreening in the measurement year of women aged 16–20 during the measurement year, identified as sexually active using an algorithm using ICD-9 codes for pregnancy testing and care, sexually transmitted infections, and dispensed prescription contraceptive medications
Technical specificationsaAND sexually active if the“Social history”section“Sexual Activityfield”indicated“Yes”or“Not currently”
All measures calculated from the same cohort of children: those continually insured by the OHP, which administers both Oregon’s Medicaid Program and CHIP, with‡1 outpatient visit in 2010 at 1 of the 46 Oregon clinics that had fully implemented OCHIN’s EHR system before July 9, 2009.
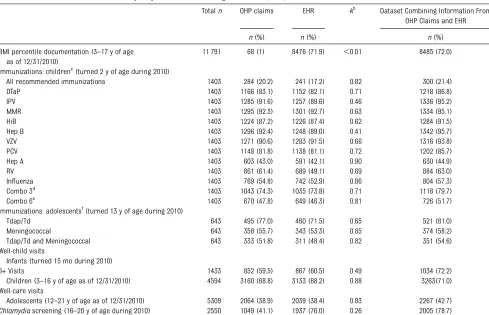
the measurement year, compared with 71.9% in the EHR data (kagreement [k]
# 0.01), and 72.0% in the combined claims/EHR dataset.
Childhood and Adolescent Immunization Status
Among children who turned 2 in 2010, 20.2% had received all their recom-mended immunizations, when mea-sured by administrative claims data; 17.2% met the measure according to the EHR data (k=0.82). In the combined dataset, 21.4% had received all
rec-ommended immunizations. Among
adolescents who turned 13 in 2010, 51.8% had received both a tetanus, diphtheria, acellular pertussis/tetanus, diphtheria and meningococcal immuni-zation according to the administrative claims data, and 48.4% when assessed in the EHR data (k =0.82). In the com-bined dataset, 54.6% of adolescents were up-to-date.
Well-Child Visits
Among children who turned 15 months of age in 2010, 59.5% had received at least 6 well-child visits when measured
by OHP administrative claims data. When measured in the EHR data, 60.5% were up-to-date on this measure (k = 0.49). In the combined dataset, 72.2% of children were up-to-date. The same pattern held true for well-child visits for 3- to 6-year-olds and for adoles-cents: similar results were found in each data source when assessed sep-arately, and the rate was higher when the data sources were combined.
Chlamydia screening
In the assessments using OHP admin-istrative claims data, 41.1% of sexually active adolescent girls and young women aged 16 to 20 had aChlamydia test; 76.0% of eligible adolescent girls
and young women had a Chlamydia
test according to the OCHIN EHR data (k = 0.26). In the combined dataset, 78.6% of the eligible population had been screened (Table 3).
DISCUSSION
Increasingly, care quality assessed by using standardized methods, such as the CHIPRA core measures, will be used
to calculate incentives or reimbursements. For example, in Oregon, coordinated care organizations will receive incentive payments based on the quality of care provided to Medicaid patients enrolled in their programs.20Thus, it is increas-ingly important to understand the limitations inherent to measuring care quality by using different data sources, to ensure that these data provide an accurate reflection of the care pro-vided.
This study found significant differences between claims and EHR data sources depending on the measure assessed: BMI was recorded in the EHR far more often than in claims, and immunizations were often recorded in claims data but not found in the EHR data. There are logical explanations for the lack of agreement between these 2 data sources. For example, the lack of in-formation in claims about BMI assess-ment highlights a limitation of claims data: these data represent billed ser-vices only. Conversely, immunizations may be received at multiple care sites and billed to patients’insurance plans, but not reported back to or reflected in their primary care medical home’s EHR.
Ourfindings suggest that most current methods for assessing care quality are limited because they are usually based on information obtained from 1 data source. If quality measurements use only administrative claims data, which doc-ument billed services and associated di-agnoses, they are not capturing all of the care received or services provided.21–24 Similarly, quality measurements that use EHR data alone may not obtain a complete picture of all care patients receive, as EHR data often only include data from 1 clinic system, and patients may seek care at different locations. In this study population, combining admin-istrative claims and EHR data yielded the most complete capture of data on the quality of care provided to children. These findings illustrate that different
TABLE 2 Demographics of Study Population of Children Continuously Enrolled in the OHP With at Least 1 Visit to an Oregon OCHIN Clinic in 2010
Child Characteristics Children Continuously Enrolled in OHPa
With$1 Outpatient Visitb
(n= 22 925)
n(%)
Age in years, mean (SD) 8.5 (6.0)
Race
Black 1775 (7.7)
Asian/Pacific Islander/Native Hawaiian 1220 (5.3) American Indian/Alaskan Native 182 (0.8)
White 12 023 (52.4)
Unknown/Refused 7725 (33.7)
Ethnicity
Hispanic 10 834 (47.3)
Non-Hispanic 5442 (23.7)
Not Collected/Unknown 6649 (29.0)
Language
English 10 426 (45.5)
Spanish 9397 (41.0)
Other 3102 (13.5)
Gender
Boys 10 954 (47.8)
Girls 11 971 (52.2)
aThe OHP administers both Oregon’s Medicaid Program and CHIP.
bChild had an outpatient visit in 2010 at 1 of the 46 Oregon clinics that had fully implemented OCHIN’s EHR before July 1, 2009.
information can be found in claims and EHR data; thus, accurate assessment of care quality may require combining these data sources. The“hybrid”method recommended for assessing CHIPRA quality measures, which includes medi-cal record review, is likely more com-prehensive than analyses that use administrative claims data alone. How-ever, this method, as currently de-scribed, is difficult to execute because of time and financial constraints.9 We demonstrate an alternative data-collection method for those systems able to electronically abstract clinically relevant EHR data; this method may
im-prove the ability to use medical record data for quality assessment.
Impact on Policy
The Medicaid Statistical Information System data, a national eligibility and claims database maintained by the Centers for Medicare and Medicaid Services, has been identified as a po-tential way to further standardize the CHIPRA core measures as states expand coverage by enacting provisions au-thorized under the Affordable Care Act.25,26 Using Medicaid Statistical In-formation System data will allow for state-to-state comparison, as
mea-sures will be calculated the same way from a national dataset. However, our results suggest that these data alone may yield an inaccurate measure of pediatric care quality.
Policy makers should consider com-bining claims and EHR data to more accurately assess the quality of care provided to children insured by Med-icaid and CHIP. As reimbursements are increasingly based on the quality of delivered care, it will be essential to access and use the most complete data available.27 As more and more health care providers have EHRs,28health re-cord data will be increasingly available
OHP Claims and EHR
n(%) n(%) n(%)
BMI percentile documentation (3–17 y of age as of 12/31/2010)
11 791 68 (1) 8476 (71.9) ,0.01 8485 (72.0)
Immunizations: childrenc
(turned 2 y of age during 2010)
All recommended immunizations 1403 284 (20.2) 241 (17.2) 0.82 300 (21.4)
DTaP 1403 1166 (83.1) 1152 (82.1) 0.71 1218 (86.8)
IPV 1403 1285 (91.6) 1257 (89.6) 0.46 1336 (95.2)
MMR 1403 1295 (92.3) 1301 (92.7) 0.63 1334 (95.1)
HiB 1403 1224 (87.2) 1226 (87.4) 0.62 1284 (91.5)
Hep B 1403 1296 (92.4) 1248 (89.0) 0.41 1342 (95.7)
VZV 1403 1271 (90.6) 1283 (91.5) 0.66 1316 (93.8)
PCV 1403 1148 (81.8) 1138 (81.1) 0.72 1202 (85.7)
Hep A 1403 603 (43.0) 591 (42.1) 0.90 630 (44.9)
RV 1403 861 (61.4) 689 (49.1) 0.69 884 (63.0)
Influenza 1403 769 (54.8) 742 (52.9) 0.86 804 (57.3)
Combo 3d
1403 1043 (74.3) 1035 (73.8) 0.71 1118 (79.7) Combo 6e
1403 670 (47.8) 649 (46.3) 0.81 726 (51.7) Immunizations: adolescentsf
(turned 13 y of age during 2010)
Tdap/Td 643 495 (77.0) 460 (71.5) 0.65 521 (81.0)
Meningococcal 643 358 (55.7) 343 (53.3) 0.85 374 (58.2)
Tdap/Td and Meningococcal 643 333 (51.8) 311 (48.4) 0.82 351 (54.6) Well-child visits
Infants (turned 15 mo during 2010)
6+ Visits 1433 852 (59.5) 867 (60.5) 0.49 1034 (72.2)
Children (3–16 y of age as of 12/31/2010) 4594 3160 (68.8) 3133 (68.2) 0.88 3263(71.0) Well-care visits
Adolescents (12–21 y of age as of 12/31/2010) 5309 2064 (38.9) 2039 (38.4) 0.83 2267 (42.7) Chlamydiascreening (16–20 y of age during 2010) 2550 1049 (41.1) 1937 (76.0) 0.26 2005 (78.7)
All measures calculated from the same cohort of children: those continually insured by the OHP (administers both Oregon’s Medicaid Program and CHIP) with$1 outpatient visit in 2010 at 1 of the 46 Oregon clinics that had fully implemented OCHIN’s EHR before July 1, 2009.
Note: Combo 3 and 6 were assessed because national recommendations were changing regarding Hep A and influenza, and RV was taken off the market for a period of time; these were thought to be possible explanations for why these rates might be lower.
aThe OHP administers both Oregon’s Medicaid Program and CHIP.
bkstatistic comparing agreement between quality measurement when using administrative data only versus EHR data only.
cRequired immunizations for children: 4 diphtheria, tetanus, and acellular pertussis (DTaP); 3 polio (IPV); 1 measles, mumps, and rubella (MMR); 3 H influenza type B (HiB); 3 hepatitis B (Hep B),
1 chicken pox (VZV); 4 pneumococcal conjugate (PCV); 2 hepatitis A (Hep A); 2 or 3 rotavirus (RV); and 2 influenza vaccines by their second birthday.
dCombo 3: All required immunizations except Hep A, influenza, and RV. eCombo 6: All required immunizations except Hep A and RV.
to supplement claims data. With ex-panded availability comes the need for improved methods for accessing and using EHR data. The data must be organized, synthesized, and easily aggregated and obtained from the EHR’s “back end,” and standardized data entry processes are needed on the“front end”to ensure that EHR in-formation is as systematic and com-plete as possible. The end user also needs to be considered when making future EHR improvements. For exam-ple, there are differences in pediatric patient care that should be reflected in the front end to ensure the appropriate data are recorded. Additionally, the in-creasing use and development of EHR data also suggest the need to change the pediatric quality measurement technical specifications to include au-tomated extraction of data from dis-crete EHR datafields, in addition to (or in place of) a manual chart review hy-brid method. Extracting EHR data au-tomatically has been shown to perform reasonably well, compared with man-ual chart review.11,18
The transition fromInternational Clas-sification of Diseases, Ninth Revision (ICD-9) diagnosis codes to Interna-tional Classification of Diseases, Tenth
Revision, Clinical Modification (ICD-10-CM) codes may help improve the ac-curacy and completeness of claims data, as ICD-10-CM is a more robust coding system with up to 7 characters to accommodate new treatments and technologies and performance-based payment systems.29The use of ICD-10-CM codes coupled with billing practi-ces that align closely with the technical specifications of quality metrics may improve the accuracy of claims data for quality reporting. However, as pay-ment moves away from fee-for-service toward capitation and outcome-based global reimbursement, claims-based quality measurement may become ob-solete, and quality measurement that uses clinical data from EHRs may be-come even more essential.
This study demonstrates how EHRs are poised to transform the way health care is delivered, as well as how health services and health care delivery can be studied. Significant future investments will be required to further develop and most effectively use EHRs to fully max-imize potential gains.
Limitations
The examples presented in this article illustrate how measuring health care
quality can vary depending on the data source(s) used. The collection and storage of EHR data differs between care provider organizations30; thus, including additional EHR fields or assessing EHR data from other sys-tems could yield different results. Ad-ditionally, OCHIN’s centrally hosted EHR
data are regularly checked and
cleaned; these practices are not stan-dard across all health care organi-zations. We limited these analyses to children continuously insured by the Oregon Health Plan who were estab-lished patients in 1 of the 46 Oregon clinics that had implemented a full EHR before July 1, 2009. Similar anal-yses may yield different results if conducted in other states or clinics; our purpose in studying this specific cohort of children was to assess the same measures in the same popula-tion calculated by using different data sources.
CONCLUSIONS
Children’s care quality measures as-sessed by using administrative claims alone may not be accurate. Adding EHR data to administrative claims data may yield more complete measurement.
REFERENCES
1. Kaiser Commission on Medicaid and the Uninsured. Children’s Health Insurance Pro-gram Reauthorization Act of 2009 (CHIPRA). 2009. Available at: www.kff.org/medicaid/up-load/7863.pdf. Accessed January 14, 2011 2. Dougherty D, Schiff J, Mangione-Smith R. The
Children’s Health Insurance Program Reau-thorization Act quality measures initiatives: moving forward to improve measurement, care, and child and adolescent outcomes.
Acad Pediatr. 2011;11(suppl 3):S1–S10 3. Mangione-Smith R, Schiff J, Dougherty D.
Identifying children’s health care quality measures for Medicaid and CHIP: an evidence-informed, publicly transparent expert pro-cess.Acad Pediatr. 2011;11(suppl 3):S11–S21
4. Centers for Medicare and Medicaid Ser-vices. CHIPRA initial core set of children’s health care quality measures. 2013. Avail-able at: www.medicaid.gov/Medicaid-CHIP-Program-Information/By-Topics/Quality-of-Care/ CHIPRA-Initial-Core-Set-of-Childrens-Health-Care-Quality-Measures.html. Accessed March 13, 2013
5. Fairbrother G, Simpson LA. Measuring and reporting quality of health care for chil-dren: CHIPRA and beyond. Acad Pediatr. 2011;11(suppl 3):S77–S84
6. Sternberg SB, Co JP, Homer CJ. Review of quality measures of the most integrated health care settings for children and the need for improved measures: recommendations
for initial core measurement set for CHIPRA.
Acad Pediatr. 2011;11(suppl 3):S49–S58.e3 7. Agency for Healthcare Research and
Qual-ity. Initial core set of children’s healthcare quality measures. 2009. Available at: http// www.ahrq.gov/chip/listtable.htm. Accessed October 9, 2009
8. Centers for Medicare & Medicaid Services. Initial core set of children’s health care quality measures: technical specifications and resource manual for federalfiscal year 2011 reporting. Baltimore, MD: Centers for Medicare & Medicaid Services; 2011 9. Knapp C, Wang H, Baker K. Measuring quality
in pediatrics: Florida’s early experiences with the CHIPRA core measure set [published
013-1379-6
10. Devoe JE, Gold R, McIntire P, Puro J, Chauvie S, Gallia CA. Electronic health records vs Medicaid claims: completeness of diabetes preventive care data in community health centers.Ann Fam Med. 2011;9(4):351–358 11. Tang PC, Ralston M, Arrigotti MF, Qureshi L,
Graham J. Comparison of methodologies for calculating quality measures based on administrative data versus clinical data from an electronic health record system: implications for performance measures.
J Am Med Inform Assoc. 2007;14(1):10–15 12. Gold R, Angier H, Mangione-Smith R, et al.
Feasibility of evaluating the CHIPRA care quality measures in electronic health re-cord data.Pediatrics. 2012;130(1):139–149 13. Tjia J, Field TS, Fischer SH, et al. Quality
measurement of medication monitoring in the “meaningful use” era. Am J Manag Care. 2011;17(9):633–637
14. Blumenthal D, Tavenner M. The“meaningful use”regulation for electronic health records.
N Engl J Med. 2010;363(6):501–504 15. Casciato A, Angier H, Milano C, Gideonse N,
Gold R, DeVoe J. Are pediatric quality care measures too stringent?J Am Board Fam Med. 2012;25(5):686–693
16. Kahn MG, Ranade D. The impact of elec-tronic medical records data sources on an adverse drug event quality measure.J Am Med Inform Assoc. 2010;17(2):185–191
quality measurement for performance mon-itoring.J Am Med Inform Assoc. 2012;19(4): 604–609
18. Baker DW, Persell SD, Thompson JA, et al. Automated review of electronic health records to assess quality of care for out-patients with heart failure.Ann Intern Med. 2007;146(4):270–277
19. Devoe JE, Sears A. The OCHIN community information network: bringing together community health centers, information technology, and data to support a patient-centered medical village.J Am Board Fam Med. 2013;26(3):271–278
20. Authority OH. Baseline data and technical specifications for CCO incentive measures. 2013. Available at: www.oregon.gov/oha/Pages/ CCO-Baseline-Data.aspx. Accessed July 8, 2013 21. Iezzoni LI. Assessing quality using admin-istrative data.Ann Intern Med. 1997;127(8 pt 2):666–674
22. Jollis JG, Ancukiewicz M, DeLong ER, Pryor DB, Muhlbaier LH, Mark DB. Discordance of databases designed for claims payment versus clinical information systems. Impli-cations for outcomes research.Ann Intern Med. 1993;119(8):844–850
23. Mangione-Smith R, Elliott MN, Wong L, McDonald L, Roski J. Measuring the quality of care for group A streptococcal pharyn-gitis in 5 US health plans. Arch Pediatr Adolesc Med. 2005;159(5):491–497
hospital complications from claims data. Is it valid?Med Care. 2000;38(8):785–795 25. MacTaggart P, Foster A, Markus A. Medicaid
Statistical Information System (MSIS): a data source for quality reporting for Medicaid and the Children’s Health Insurance Program (CHIP).Perspect Health Inf Manag.2011;8:1d 26. 111th Congress. Compilation of Patient Pro-tection and Affordable Care Act. 2010. Available at: http://docs.house.gov/energycommerce/ ppacacon.pdf. Accessed December 16, 2011 27. Frakt AB, Mayes R. Beyond capitation: how
new payment experiments seek tofind the
’sweet spot’ in amount of risk providers and payers bear. Health Aff (Millwood). 2012;31(9):1951–1958
28. Hsiao C-J, Hing E. Use and Characteristics of Electronic Health Record Systems Among Office-based Physician Practices: United States, 2001–2012. Hyattsville, MD: National Center for Health Statistics; 2012 29. Centers for Medicare & Medicaid Services.
FAQs: ICD-10 Transition Basics. 2013. Avail-able at: www.cms.gov/Medicare/Coding/ICD10/ Downloads/ICD10FAQs2013.pdf. Accessed December 9, 2013
DOI: 10.1542/peds.2013-4277 originally published online May 26, 2014;
2014;133;e1676
Pediatrics
Miguel Marino, Rita Mangione-Smith and Jennifer E. DeVoe
Heather Angier, Rachel Gold, Charles Gallia, Allison Casciato, Carrie J. Tillotson,
Variation in Outcomes of Quality Measurement by Data Source
Services
Updated Information &
http://pediatrics.aappublications.org/content/133/6/e1676 including high resolution figures, can be found at:
References
http://pediatrics.aappublications.org/content/133/6/e1676#BIBL This article cites 18 articles, 6 of which you can access for free at:
Subspecialty Collections
http://www.aappublications.org/cgi/collection/federal_policy_sub
Federal Policy
http://www.aappublications.org/cgi/collection/advocacy_sub
Advocacy
rds_sub
http://www.aappublications.org/cgi/collection/electronic_health_reco
Electronic Health Records
chnology_sub
http://www.aappublications.org/cgi/collection/health_information_te
Health Information Technology
following collection(s):
This article, along with others on similar topics, appears in the
Permissions & Licensing
http://www.aappublications.org/site/misc/Permissions.xhtml in its entirety can be found online at:
Information about reproducing this article in parts (figures, tables) or
Reprints
DOI: 10.1542/peds.2013-4277 originally published online May 26, 2014;
2014;133;e1676
Pediatrics
Miguel Marino, Rita Mangione-Smith and Jennifer E. DeVoe
http://pediatrics.aappublications.org/content/133/6/e1676
located on the World Wide Web at:
The online version of this article, along with updated information and services, is
by the American Academy of Pediatrics. All rights reserved. Print ISSN: 1073-0397.