IJEDR1804016
International Journal of Engineering Development and Research (
www.ijedr.org
)
86
Reactive Power Compensation Technique in
Transmission Lines Using Grenade Explosion
Algorithm
S.Tamizhvanan1, K.Elango2
1PG Scholar, Department of Electrical and Electronics Engineering, Valliammai Engineering College
Kattankulathur,Kancheepuram,Chennai,India
2Professor and Head, Electrical and Electronics Engineering, Valliammai Engineering College
Kattankulathur,Kancheepuram,Chennai,India
____________________________________________________________________________________________
Abstract- In order to improve the stability of the system and reduce the power system losses, this paper proposes a grenade explosion algorithm for the reactive power compensation by FACTS devices. The grenade explosion algorithm formulated by assuming that the decision maker which have a fuzzy goal for each of the objective functions. Its main objective functions are to improve the voltage profile, and to minimize reactive power transmission losses in transmission lines. This algorithm finds the optimal location of FACTS devices thereby real and reactive power losses and the voltage profile can be improved. The proposed method has been tested on a IEEE 14 bus system in MATLAB-Simulink. The results shows the good performance for the proposed approach
Keywords-Real Power Loss, Reactive Power Loss, UPFC (Unified Power Flow Converter), GEA (Grenade Explosion Algorithm)
____________________________________________________________________________________________
1. INTRODUCTION
Due to development of industrialization, urbanization the need of electrical energy is increased. which has resulted in rapid growth of power systems. Due to which causes an adverse effects on power system network such as voltage deviation ,power losses ,stability of system Electrical power systems consists of large interconnected network which requires a flexible control to maintain the system with continuous power flow operation without any violations. Flexible Alternating Current Transmission System (FACTS) is an evolving technology used for simultaneous control of power system parameters.The UPFC can provide simultaneous control of all basic power system parameters ( transmission voltage, impedance and phase angle). The controller can fulfill functions of reactive shunt compensation, series compensation .UPFC is combination of static synchronous series compensator (SSSC) and static synchronous compensator Location of FACTS devices is consider as an important aspect for the improvement overall parameter of the power system requirements Various methods has been used for finding the optimal placement of FACTS devices to enhance the performance of transmission system. many techniques were used for the optimal placement of FACTS devices can be mainly divided into index based methods and optimization based methods. Earlier, a Fuzzy logic and Real Coded Genetic Algorithm based strategy is proposed for placement FACTS controller. Currently ,improved Particle Swarm Optimization (PSO)[1], Non-dominated Sorting Particle Swarm Optimization (NSPSO) and Genetic Algorithm based optimization techniques are also introduced to identify the optimal location FACTS devices to improve voltage stability of the system
*DingPing LI, GuoLiang SHEN, WenDong GUO, ZHi ZHANG, BaoNing HU, Wei GAO[2] proposed a paper on Power system reactive power optimization based on MIPSO which explains about the enhancement of power quality and reduce network losses, this theory explains a modified immune particle swarm algorithm for power system reactive power optimization problem. To overcome the drawbacks in the traditional PSO algorithm about low accuracy and easy to fall into local optimal MIPSO adopts sinusoidal change in inertia weight strategy to make particles explore the global optimization more efficient. Introducing convergence acceleration factor for the improvement convergence rate. Modified immune principle incorporate the search capability to avoid premature convergence. The results show that the MIPSO algorithm is an efficient and feasible approach for reactive power optimization.
IJEDR1804016
International Journal of Engineering Development and Research (
www.ijedr.org
)
87
2. PROBLEM FORMULATION
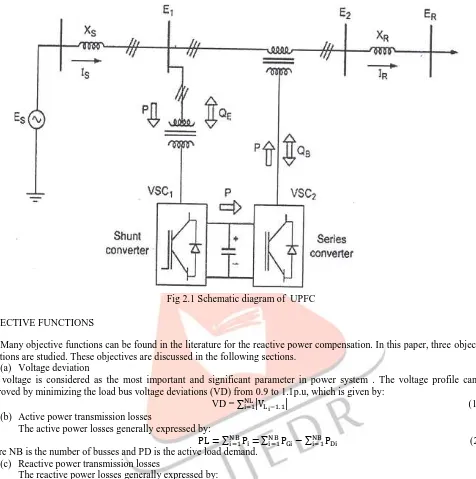
The UPFC is a enactment of the last generation of FACTS devices which can control concurrently all three parameters of line power flow (line impedance, voltage and phase angle).The UPFC bunch up together the trait of Static Synchronous Compensator (STATCOM) and the Static Synchronous Series Compensator (SSSC) . The DC terminals of the two underlying voltage source converters (VSCs) are now coupled, and this creates a way for active power exchange between the converters. Hence, the active power supplied to the line by the series converter, can now be supplied by the shunt converter, This topology offers three degrees of operation or four degrees of operation (two associated with each VSC) with one constraint (active powers of the VSCs must match). Therefore, a wide range of control options is available compared to STATCOM or SSSC. UPFC can be used to regulate the flow of active and reactive power through the line and to control the amount of reactive power supplied to the line at the point of installation. While operating both inverters as a UPFC, the exchanged power at the terminals of each inverter can be real as well as reactive. The power circuit topology of UPFC consists of shunt converter functioning as a STATCOM and series converter functioning as a SSSC
In practice, these two devices(STATCOM & SSSC) are two Voltage Source Inverters (VSI's)connected across in shunt with the transmission line through a shunt transformer and in series with the transmission line through a series transformer, connected at both side by a common dc link including a storage capacitor. The shunt inverter is used for voltage regulation at the point of connection injecting an appropriate reactive power flow into the line and to balance the real power flow exchanged between the series inverter and the transmission line.
The series inverter can be used to control the real and reactive line power flow inserting an appropriate voltage with controllable magnitude and phase angle in series with the transmission line. So this component will transfer active and reactive power within the line. The reactive power is provided by the series inverter, and the active power is transmitted to the dc terminals. The shunt inverter is utilized in such a way as to demand this dc terminal power (positive or negative) from the line keeping the voltage at the storage capacitor constant. So, the overall real power absorbed from the line by the UPFC is equal to the losses of the two inverters only and their transformers. The remaining capacity of the shunt inverter can be used to interchange reactive power with the line so to provide a voltage regulation at the intersecting point. Applying the Pulse Width Modulation (PWM) technique to the two VSCs the following equations for magnitudes of shunt and series injected voltages are obtained
The series converter injects an AC voltage in series with the transmission line. Series voltage magnitude and its phase angle with respect to the sending bus are controllable in the range of and The shunt converter injects controllable shunt voltage such that the real component of the current in the shunt branch balance the real power demanded by the series converter. The real power can flow freely in either direction between the AC terminals. On the other hand the reactive power cannot flow through the DC link. It is absorbed or generated locally by each converter.
Thereby, the UPFC can fulfill functions of reactive shunt compensation, active and reactive series compensation and phase shifting[4]. Besides, the UPFC allows a secondary but important function such as stability control to suppress power system oscillations improving the transient stability of power system.
The two VSI's can work independently of each other by separating the dc side. So in that case, the shunt inverter is operating as a STATCOM that generates or absorbs reactive power to regulate the voltage magnitude at the connection point. Instead, the series inverter is operating as SSSC that generates or absorbs reactive power to regulate the current flow, and hence the power flows on the transmission line
The UPFC has many possible operating modes. In particular, the shunt inverter is operating in such a way to inject a controllable current into the transmission line. This current consists of two components with respect to the line voltage: the real or direct component, which is in phase or in opposite phase with the line voltage, and the reactive or quadrature component, which is in quadrature. The quadrature component, instead, can be independently set to any desired reference level (inductive or capacitive) within the capability of the inverter, to absorb or generate respectively reactive power from the line. So, two control modes are possible:
Automatic Voltage Control: The goal is to maintain the transmission line voltage at the connection point to a reference value. Instead, the series inverter injecting the voltage controllable in amplitude and phase angle in series with the transmission line influences the power flow on the transmission line. This series voltage can be determined in different ways:
Direct Voltage Injection: The reference inputs are directly the magnitude and phase angle of the series voltage
Phase Angle regulation: The reference input is phase displacement between the sending end voltage and the receiving end voltage
Line impedance compensation: The reference input is an impedance value to insert in series with the line impedance
IJEDR1804016
International Journal of Engineering Development and Research (
www.ijedr.org
)
88
Fig 2.1 Schematic diagram of UPFCOBJECTIVE FUNCTIONS
Many objective functions can be found in the literature for the reactive power compensation. In this paper, three objective functions are studied. These objectives are discussed in the following sections.
(a) Voltage deviation
Bus voltage is considered as the most important and significant parameter in power system . The voltage profile can be improved by minimizing the load bus voltage deviations (VD) from 0.9 to 1.1p.u, which is given by:
VD = ∑NLi=1|VLi−1.1| (1)
(b) Active power transmission losses
The active power losses generally expressed by:
PL = ∑NBi=1Pi=∑NBi=1PGi− ∑NBi=1PDi (2)
where NB is the number of busses and PD is the active load demand. (c) Reactive power transmission losses
The reactive power losses generally expressed by:
QL = ∑NBi=1Qi=∑NBi=1QGi− ∑NBi=1QDi (3)
where QD is the reactive load demand. CONSTRAINTS
Load flow constraints can be classified into equality and inequality constraints, which explained in the following sections.
Equality constraints: (a) Real power constraints
𝑃𝐺𝑖− 𝑃𝐷𝑖− 𝑉𝑖= ∑𝑁𝐵𝑗=1𝑉𝑗[𝐺𝑖𝑗cos (𝜃𝑖𝑗)] = 0 (4)
(b) Reactive power constraints:
𝑄𝐺𝑖− 𝑄𝐷𝑖− 𝑉𝑖= ∑𝑁𝐵𝑗=1𝑉𝑗[𝐺𝑖𝑗sin (𝜃𝑖𝑗)] = 0 (5)
where𝜃𝑖𝑗= 𝜃𝑖− 𝜃𝑖− 𝐺𝑖𝑗and 𝐵𝑖𝑗 are the admittance matrix. (𝑌𝑖𝑗 = 𝐺𝑖𝑗+ 𝑗 𝐵𝑖𝑗)representing the conductance and susceptance
between bus i and bus j, respectively. Inequality constraints:
(a) Generator constraints
VGmini ≤ VGi ≤ VGmaxi , i=1, ……, NG (6)
PGmini ≤ PGi ≤ PGmaxi , i=1, ……, NG (7)
QGi
min ≤ Q
Gi ≤ QGi
IJEDR1804016
International Journal of Engineering Development and Research (
www.ijedr.org
)
89
(b) Transformer contraintsTimin ≤ Ti ≤ Timax, i=1, ……, NT (9)
(c) Shunt VAR compensator constraints
Qminci ≤ Qci ≤ Qmaxci , i=1, ……, NC (10) 2.1 OVERVIEW
The GEA is a novel metaheuristic inspired by the mechanism of grenade exposition [5]. In the GEA, when are grenades explode, which results at shrapnel to hit objects that are located within a neighborhood radius called Le. The damages caused by shrapnel on objects to be calculated. The damage-per-shrapnel value indicates the value of objects in that particular area. In order to cause more damage or losses, the next grenade is thrown in the location which causes more damage. The overall damage caused by the hit is considered as the fitness of the solution at the location of object
Moreover, the GEA has a unique feature, which of defining agent's territory radius (Rt) . Each agent (a grenade here), does
not allow other agents to come behind it than a certain distance that is Rt. Therefore, when more grenades explored in the
search space, a high value of Rt guarantees that grenades are spared quit same in the search space while a small value of Rt
allows the grenades to search local regions together.
2.2 ALGORITHM
The GEA begins by measuring all independent variables of the interval [-1,1]. Then, the problem definition like the number of grenades (Ng) and the maximum number of iterations (Max iterations) are considered and Le and, Rt are initialized. After
initialization, Ng grenades, distant by Rt from each other, are randomly generated in the n-dimensional space. These grenades
will arranged in a descending order based on their fitness. For each grenade Nq pieces of shrapnel are generated using the
following expression:
Xj′= {Xm+ sign(rm)x|rm|pXLe}, j=1. Nq (11)
Where Xm is the location of the grenade, rm is a uniformly distributed random number in [-1,1] and p is a constant used to tune
the intensity of the exploration. The value of p is updated using the probability of territory search (Tm) as follows:
p = max {1, n x log( Rt Le)
log(Tw)} (12) While generating the Nq pieces of shrapnel, some shrapnel would collide to objects outside the scaled space and they have to
be moved to the [-1,1]n interval. From that the damage caused by every piece of shrapnel around a grenade must be computed.
If the fitness of the best generated point is better convergence than the fitness of the current location of the grenade, then the position of the grenade is gets updated and then the grenade moves to the location of the next best point.
To increase the global ability of problem, Le and Rt are adjusted during the every iterations[7]. High values of these
parameters are necessary to cover the whole search space in initial iterations, however, it must be reduced over iterations by considering fitness value into account. The territory radius is expressed and updated as follows:
Rt=
Rt−intial
(Rrd)iteration Number/Max _iterations) (13) Where Rrd represents the ratio of the value of Rt in the first iteration to its value in the last iteration and it has to be set before
the algorithm starts. Likewise, Le is decreased over iterations as follows:
Le= (Le− inital)m(Rt)1−m, 0 ≤ m ≤ 1
where m is calculated using the following expression: m = mmax− (
Iteration_number
max − iterations)) (𝑚𝑚𝑎𝑥− 𝑚𝑚𝑖𝑛) (14)
Table 2.1 Parameters of GEA
Neighborhood radius 10
Maximum no. of
iterations 150
Exploitation ratio 0.2
No. of grenades 4
No. of shrapnel 40
Territory radius 5
3. METHODOLOGY
IJEDR1804016
International Journal of Engineering Development and Research (
www.ijedr.org
)
90
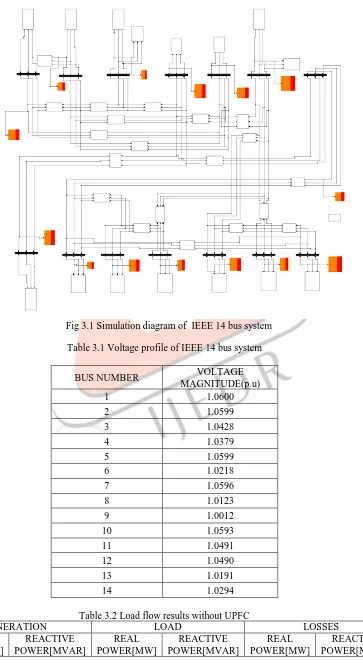
results of IEEE 14 bus system show the total generation, load and losses. From the table 3.2 it has been observed that the total generation of real power is 332.799 MW and reactive power generation is 97.2130 MVAR with real power loss of about 5.74% and reactive power loss of about16.75 %.Fig 3.1 Simulation diagram of IEEE 14 bus system Table 3.1 Voltage profile of IEEE 14 bus system
BUS NUMBER VOLTAGE
MAGNITUDE(p.u)
1 1.0600
2 1.0599
3 1.0428
4 1.0379
5 1.0599
6 1.0218
7 1.0596
8 1.0123
9 1.0012
10 1.0593
11 1.0491
12 1.0490
13 1.0191
14 1.0294
Table 3.2 Load flow results without UPFC S.NO
GENERATION LOAD LOSSES
REAL POWER[MW]
REACTIVE POWER[MVAR]
REAL POWER[MW]
REACTIVE POWER[MVAR]
REAL POWER[MW]
IJEDR1804016
International Journal of Engineering Development and Research (
www.ijedr.org
)
91
1 332.799 97.21303 314.55277 80.922499 19.05261 16.29071
3.2 IMPLEMENTATION OF GRENADE EXPLOSION ALGORITHM
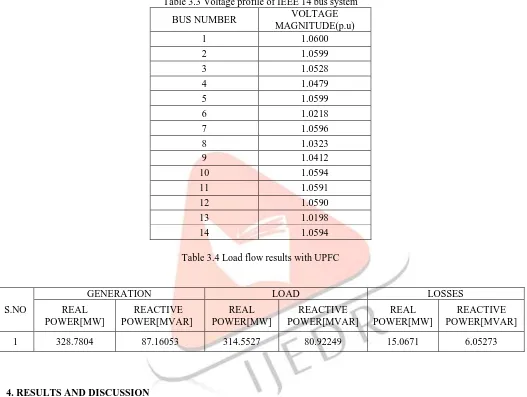
Grenade explosion algorithm has been implemented in this IEEE 14 bus system as explained in section 2.The objective functions of the proposed algorithm helps UPFC to find its optimal location based on reactive power loss. Based on reactive power losses and its location priority, UPFC is located in between buses 9 and 14.This makes the reactive power loss to reduce from 16.2907 MVAR to 6.0527 MVAR and voltage profile gets improved at buses 6,8,11,13 and 14.Tabulation 3.4 shows the total generation, load losses and Tabulation 3.3 shows the improved voltage profile of 14 bus system with UPFC.
Table 3.3 Voltage profile of IEEE 14 bus system
BUS NUMBER VOLTAGE
MAGNITUDE(p.u)
1 1.0600
2 1.0599
3 1.0528
4 1.0479
5 1.0599
6 1.0218
7 1.0596
8 1.0323
9 1.0412
10 1.0594
11 1.0591
12 1.0590
13 1.0198
14 1.0594
Table 3.4 Load flow results with UPFC
4. RESULTS AND DISCUSSION
The load flow results of IEEE 14 bus system from the table 3.2 and 3.4 shows that reactive power losses reduced from 16.290 MVAR to 6.052 MVAR, and real power loss reduced from 19.052 MW to 15.067 MW. On comparing table 4.1 and table 4.3 it can be seen that voltage profile of the system improves to a certain extent at buses 6,8,11,13 and 14.
Table 4.1 Comparative results S.NO
GENERATION LOAD LOSSES
REAL POWER[MW]
REACTIVE POWER[MVAR]
REAL POWER[MW]
REACTIVE POWER[MVAR]
REAL POWER[MW]
REACTIVE POWER[MVAR]
1 328.7804 87.16053 314.5527 80.92249 15.0671 6.05273
Title IEEE 14 bus system without UPFC
IEEE 14 bus with UPFC using GEA Total Real Power
Generation [MW]
332.799 328.7804
Total Reactive Power Generation
[MVAR]
97.21303 87.16053
Total Real Power
Load [MW] 314.55277 314.5527
Total reactive power Load
[MVAR] 80.922499
IJEDR1804016
International Journal of Engineering Development and Research (
www.ijedr.org
)
92
5. CONCLUSION
From the above discussion it can be concluded that grenade explosion algorithm reduces the global search ability for optimal location of UPFC to compensate the reactive power losses that occurs in a 14 bus system. On comparing the base case and the proposed methodology, a total percentage reduction of 62.84% (16.29 MVAR to 6.052 MVAR) can be achieved. Future scope can be done on multi objective optimization techniques that further increase the accuracy of search results to a greater extent.
6. REFERENCES
[1] K. Ravi, M. Rajaram, Optimal location of FACTS devices using improved particle swarm optimization, Electr. Power Energy Syst. 49 (2013) 333– 338.
[2] Power system reactive power optimization based on MIPSO. *DingPing LI, GuoLiang SHEN, WenDong GUO, ZHi ZHANG, BaoNing HU, Wei GAO, Energy Procedia 14 (2012) 788 – 793
[3] Optimal placement of TCSC and SVC for reactive power planning using Whale optimization algorithm.Saurav Raj, Biplab Bhattacharyya*, Swarm and Evolutionary Computation 40 (2018) 131143.
[4] Kumar P.P., Poornachandrarao N., Improvement of Power Flow in the Power System Network by using UPFC Device, International Journal of Engineering Research and Applications, 2012, 2(3), p. 1194-1199.
[5] Ahrari, A., Atai, A.A.: Grenade explosion method–a novel tool for optimization of multimodal functions. Appl. Soft. Comput. J. 10, 1132–1140 (2010)
[6] K. Ravi, M. Rajaram, Optimal location of FACTS devices using improved particle swarm optimization, Electr. Power Energy Syst. 49 (2013) 333– 338
[7]N. G. Hingorani and L. Gyugyi, Understanding FACTS: Concepts and Technology of Flexible AC Transmission Systems. New York: IEEE Press, 2000.
[8] S.H. Lee, J.H. Liu, C.C. Chu, Modelling and locating unified power-flow controllers for static voltage stability enhancements, Int. Trans. Electr. Energy Syst. 24 (11) (2014) 15241540.
[9]M.C. Ramachandran, Dr K.Elango “Improvement of power quality in power system using contingency analsysis”International Journal of Engineering & Technology, 7 (2.21) (18) 237-241
[10] Mathusoothanan.T ,Dr. R. Karthik “Reactive Power Compensation of Doubly Fed Induction Generator using STATCOM in Grid Side” - International Journal for Scientific Research & Development| Vol. 4, Issue 03, 2016
Total Real Power
Losses(%) 5.74% 4.32%
Total Reactive