© Author(s) 2016. CC Attribution 3.0 License.
Development of fragility curves for railway embankment and ballast
scour due to overtopping flood flow
Ryota Tsubaki1, Jeremy David Bricker2, Koji Ichii3, and Yoshihisa Kawahara3
1Department of Civil Engineering, Nagoya University, Furo-cho, Chikusa-ku, Nagoya 464-8603, Aichi, Japan 2Delft University of Technology, Civil Engineering and Geosciences, P.O. Box 5048, 2600 GA Delft, the Netherlands 3Department of Civil and Environmental Engineering, Hiroshima University, Kagamiyama 1-4-1,
Higashi-hiroshima 739-8527, Hiroshima, Japan
Correspondence to:Ryota Tsubaki (rtsubaki@civil.nagoya-u.ac.jp)
Received: 13 May 2016 – Published in Nat. Hazards Earth Syst. Sci. Discuss.: 31 May 2016 Revised: 26 September 2016 – Accepted: 30 October 2016 – Published: 29 November 2016
Abstract. Fragility curves evaluating a risk of railway em-bankment fill and track ballast scour were developed. To de-velop fragility curves, two well-documented events of single-track railway washout during floods in Japan were investi-gated. Type of damage to the railway was categorized into no damage, ballast scour, and embankment scour, in or-der of damage severity. Railway overtopping water depth for each event was estimated based on well-documented hydrologic and hydraulic analyses. Normal and log-normal fragility curves were developed based on damage probability derived from field records and the estimated overtopping wa-ter depth. A combined ballast and embankment scour model was validated by comparing the results of previous studies and the spatial distribution of railway damage type records.
1 Introduction
1.1 Vulnerability of railways to floods
Railway lines consist of components including tracks, power supply, and signaling infrastructure (Railway Technical Re-search Institute, 2007), all of which can suffer damage during river floods, hurricane storm surge, and tsunamis (e.g., Japan Railway Civil Engineering Association, 2000–2011), lead-ing to interruption of transportation service (see Fig. 1 for two examples of damage due to surge in the USA). The most common mechanism of track damage occurs when tracks are overtopped by floodwaters, leading to scouring of the ballast and/or the embankment fill upon which the rail tracks are
built (e.g., Brammer, 1990; Dawson et al., 2005). Even when only a short section of track is washed out, the entire railway system can experience serious delays or malfunction due to a ripple effect on the dispatch of engines and cars until the damaged section is repaired (Hong et al., 2015).
Since railcars (except those specialized for steep slopes like cable cars or rack railways) cannot handle steep gra-dients in topography, railways are often built in areas of mild slopes, such as rivers, floodplains, and coasts. Due to this, railway damage is a common occurrence during flood (e.g., Changnon, 2009; Kaneko, 2010; Polemio and Lollino, 2011; Tsubaki et al., 2012a) and storm surge (e.g., Steers et al., 1979; Bunya et al., 2010) events. Furthermore, rail-ways utilize many bridges, which are often built with low clearance over waterways in order to minimize construc-tion time, cost, and track slope. Many examples exist of such bridges collapsing during large river flood and tsunami events (e.g., Wardhana and Hadipriono, 2003; Reed, 2004; Kaneko, 2010).
As such, railways are seen to exhibit significant vulnerabil-ity when tracks are inundated or overtopped. Climate change projections show that in some locations, the frequency and intensity of river flood and storm surge events will increase (IPCC, 2014), further exacerbating risk to railway damage due to overtopping and inundation (Dawson et al., 2016). Predictive evaluation of railway damage due to flood is es-sential for concrete assessment of socioeconomic impact of large flood events.
ex-Figure 1. Railway ballast scour failures: (a) New Jersey Transit tracks in New Jersey, USA, after Hurricane Sandy in 2012; (b) CSX railroad tracks in Mississippi, USA, after Hurricane Katrina in 2005 (photo credits: New Jersey Transit,a).
acerbating risk to railways in many regions, as the amount of money available for maintenance and upgrade of these railways is shrinking together with the amount of customers and goods they serve to transport (Ministry of Land, Infras-tructure, Transport and Tourism, 2015). Therefore, in order to prevent the need for expensive repairs after damage dur-ing future events, it is essential to evaluate which sections of railways are most vulnerable to washout during floods and to strengthen these sections before damage occurs.
1.2 Current technological state of estimation of railway vulnerability and research need
As discussed above, estimating the risk of railway damage due to flood is important subject to clearly understand the impact of large flood events but our knowledge about quanti-tative risk of railway damage is quite limited. As an example of this lack of knowledge, we would like to review the
treat-ment of railway damage due to flood in a software package HAZUS (Federal Emergency Management Agency, 2010a). This software package is developed for estimating poten-tial losses caused by earthquakes, floods and hurricanes and widely used in the USA. Within the framework of HAZUS, a railway system consists of railway track/embankments, bridges, tunnels, stations, and other facilities (Federal Emer-gency Management AEmer-gency, 2010b, c). Table 1 summa-rizes the items accounted for in the flood sub-model in HAZUS-MH and corresponding valuation of these items (Scawthorn et al., 2006; Federal Emergency Management Agency, 2010c). In HAZUS, damage to railway tracks due to earthquakes is evaluated based on permanent ground defor-mation (Federal Emergency Management Agency, 2010a, 7– 25), and the damage functions developed for major roads are adopted for damage estimation for railway tracks/roadbeds due to earthquake (Federal Emergency Management Agency, 2010a, 7–32). However, there is no guideline to estimate damage to railway tracks due to floods or hurricanes in the HAZUS framework. There have been several attempts to establish seismic failure prediction of railway compo-nents (e.g., Argyroudis and Kaynia, 2014) and river embank-ments (e.g., Hata et al., 2015), and river embankment failure due to overtopping (e.g., Dawson et al., 2005; Apel et al., 2009); however, railway track/embankment fragility due to flood overtopping is not yet implemented in practice (Fed-eral Emergency Management Agency, 2010b). Hong et al. (2015) pointed out that development of the fragility model for railway embankment scour using detailed data collected from the field is a key challenge. Fundamental research on the processes responsible for railway embankment failure during floods has recently begun. For example, Polemio and Lollino (2011) reported a case of seepage failure of a railway embankment. Tsubaki et al. (2012b) experimentally investi-gated the onset and evolution of ballast scour.
Floods interact with and are controlled by the presence of embankments. There are even many locations in which trans-portation embankments serve as de facto river and coastal levees (e.g., Brammer, 1990; Dawson et al., 2005; Ueda and Nakatsuka, 2014). In such a location, if a flood causes an embankment scour, the flood will spread to previously pro-tected areas. Therefore, in evaluating the risk of damage due to a railway embankment scour, it is important to evaluate the effect of that breach on the spread of the flood itself. Predict-ing the location of the railway embankment havPredict-ing signifi-cant potential to scour is essential to precisely evaluate the effect of the embankment scouring on the flood propagation during catastrophic flood events.
ge-ometrically similar to roadway embankments and levees, the structures atop railway embankments are very different from those atop these other embankments, as are the mech-anisms by which overtopping can cause damage. As Fig. 2 shows, floods can cause damage to railway embankments via three processes: (a) scour of ballast induced by overtop-ping, (b) scour of both ballast and embankment fill by over-topping, and (c) piping/seepage failure of embankment fill. Though piping/seepage failure of fill is more likely to oc-cur in high (and wide) embankments, most railway ments are relatively low, and most observed railway embank-ment failures appear to have been the result of overtopping-induced scour of embankment fill and/or ballast (Kaneko, 2010; Tsubaki et al., 2012a; Onoda and Hayano, 2015). Bal-last scour is a damage mode unique to railway embankments. In the cases of ballast scour only, repair of the ballast layer is relatively straightforward, but in cases of embankment fill scour, repairs can be costly and take a long time. Repair of damage to an embankment is less expensive than repair of damage to bridges and other facilities (see Table 1), but bal-last and embankment damage occurs much more frequently than bridge damage. Furthermore, river floods or tsunamis large enough to damage bridges usually also cause extensive flooding which leads very long sections of an embankment to wash out (e.g., Shimozono and Sato, 2016). Therefore, the development of fragility curves for scour of railway ballast and embankments is crucial for the assessment of railway vulnerability and resilience.
1.4 Fragility curve concept and its application to railway failure due to flooding
In this study, the fragility curve concept (e.g., Shinozuka et al., 2000) is used to estimate the damage occurrence on railway ballast and embankment due to flood. Fragility curves are widely used to evaluate the vulnerability of struc-tures in terms of probability. This approach was initially ap-plied for seismic damage to bridges and other structures (Shi-nozuka et al., 2000; Ichii, 2002; Hata et al., 2015), and appli-cation to water-related hazards has followed (e.g., Hall et al., 2003 for national-scale flood risk assessment; Vorogushyn et al., 2009 for embankment piping failure; Suppasri et al., 2011 for building damage due to tsunami). Dawson et al. (2005) and Apel et al. (2009) utilized the fragility curve con-cept to estimate expected damage on river embankments due to overtopping. The damage probability of an embankment is dependent on the soil properties; these properties are highly variable in space and have large uncertainty (e.g., Apel et al., 2004; Dawson et al., 2005) though this uncertainty was ac-counted for in the shape of fragility curves in those studies. Railway embankment failures are also dependent on the soil properties. Ballast scour is, however, expected to have less variability in failure probability because the ballast material, embankment fill material, shape of embankment, rails, and sleepers are highly standardized in the industry, and their
(b) Embankment scour
(a) Ballast scour
(c) Embankment seepage
Flow→Figure 2.Railway embankment damage types.
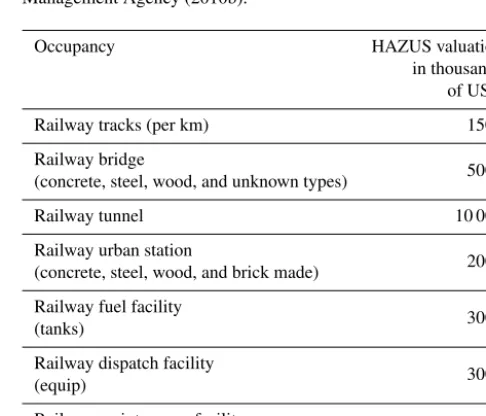
Table 1.Railway system classifications of the Federal Emergency Management Agency (2010b).
Occupancy HAZUS valuation
in thousands of USD
Railway tracks (per km) 1500
Railway bridge
5000 (concrete, steel, wood, and unknown types)
Railway tunnel 10 000
Railway urban station
2000 (concrete, steel, wood, and brick made)
Railway fuel facility
3000 (tanks)
Railway dispatch facility
3000 (equip)
Railway maintenance facility
Figure 3.Relationship between processes and data within the structure of this paper.
condition is subject to frequent inspection and maintenance (e.g., Railway Technical Research Institute, 2007). So we can expect that the spatial variation in ballast failure criteria is substantially uniform compared with failure of non-railway embankments.
1.5 Focus of this study: the first development of fragility curves for railway embankment and ballast scour
This paper investigates the conditions responsible for scour of embankment fill and track ballast for single-track, unelec-trified railways; these types of damage are quite common in rural areas where the level of flood protection is relatively limited. The fragility curves for this kind of railway embank-ment are developed based on two well-docuembank-mented rail track washout events during recent floods in Japan.
Figure 3 shows the relationship between the processes and data used in this study. The two flood events for which damage records exist, as well as the estimated flow rates in the river networks during these events, are described in Sect. 2. Section 3 is devoted to the methods used in this study. Fragility curves are introduced in Sect. 3.1. Railway damage recorded for the two flood events is described in Sect. 3.2. The method of hydraulic analysis and uncertainty in the esti-mated water depth are both described in Sect. 3.3. Based on the results of Sects. 3.2 and 3.3, the fragility curves are de-veloped in Sect. 4. Discussions including the comparison be-tween the estimated damage probability and recorded dam-age types are reported in Sect. 5. Section 6 highlights the conclusions of this study.
2 Target events
In this section, two flood events and their accompanying rail-way scour damage are described. These two events were se-lected because of ready availability of existing information about meteorological conditions, hydrological and hydraulic analyses of the precipitation–run-off–flood process, and doc-umentation of the railway damages. The two railway lines damaged during these events were both single-track, unelec-trified railways.
2.1 Asa River flood of July 2010
-91 600 -91 400 -91 200 -91 000 11 4 00 -2 11 2 00 -2 11 0 00 -2 10 8 00 -2 10 6 00 -2 10 4 00 -2 10 2 0 0 -2 10 0 00 -2 09 8 00 200 m ←Outflow boundary Section of railway → embankment breach →
M in e ra il-l ine
6 3 0 6km
Ro ute 31 6 Inflow boundary Zuiko River ↓
Watershed of Asa River Watershed upstream of M
1000 0 Legend River network Elevation (m) ↓Zuiko River Asa River→ Boundary of calculation mesh →
←Inflow boundary (Asa River)
Asa Bridge gauge station→
Figure 4.Watershed of the Asa River (left) and aerial photo taken in 2011 of section M (right). (Source: National Land Numerical Information download service, Ministry of Land, Infrastructure, Transport and Tourism, Japan, for digital elevation model, watersheds, and river network.)
967 m3s−1. This flow rate closely matches the peak flow rate of 957 m3s−1which was estimated from high water marks measured in the field. This implies the estimated flow rate is reasonable and the maximum flow rates of the Asa River and the Zuiko River converged almost simultaneously since no major tributaries exist between the confluence of the two rivers and this measurement point. Accordingly, flow rates of 811 m3s−1for the Asa River and 110 m3s−1 for the Zuiko River are adopted as steady inflow boundary conditions for the hydraulic model of section M.
2.2 Sayo River flood of August 2009
On 8–11 August 2009, Typhoon Etau generated record rain-fall over the mid-west region of Japan including Sayo Town, Hyogo Prefecture. The previous 24 h record rainfall in Sayo Town had been 187 mm, but Typhoon Etau set a new record at 327 mm. This caused record flooding in the Chikusa River, the watershed of which includes Sayo Town and much of western Hyogo Prefecture, resulting in a large number of ca-sualties, as well as extensive damage to river and slope pro-tection works (Tsubaki et al., 2012a).
Figure 5 (left panel) illustrates the watershed upstream of section S of the Sayo River, together with that of its primary river, the Chikusa River. Figure 5 (right panel) depicts the domain in which the hydraulic flood model was evaluated. A rainfall–runoff simulation was conducted for the Sayo River basin upstream of the Enkouji gauge station (location indi-cated in the left panel of Fig. 5) (Tsubaki et al., 2012a; Fujita et al., 2014). A 50 m resolution distributed model that simu-lates both rainfall–runoff processes from mountainous slopes
and flood routing in river channels based on the kinematic wave equations (Tachikawa et al., 2006; Sayama et al., 2010) was used to estimate the runoff during the event. The equa-tions applied to the mountainous slopes were the lateral com-ponents of unsaturated and saturated subsurface and surface flows and the water mass balance equation (Tachikawa et al., 2006; Sayama et al., 2010). The Enkouji gauging station is located 1 km downstream of section S and the observed peak runoff was 1360 m3s−1. The peak discharge estimated by the model was 1320 m3s−1. The highest flow rate that passed through here during the August 2009 storm at the upstream boundary in the subdomain depicted in the right panel of Fig. 5 was calculated to be 750 m3s−1 (Fujita et al., 2014; Tsubaki et al., 2012a).
3 Methods 3.1 Fragility curve
em-0 10
5 km
-2000 -1000 0 1000 2000 3000 4000 5000
-1
1
3
5
0
0
-1
1
2
5
0
0
-1
1
1
5
0
0
-1
1
0
5
0
0
-1
0
9
5
0
0
-1
0
8
5
0
0
1,100 550 0 1100m
10
Watershed of Chikusa River Watershed upstream of S
1000
0
Legend
River network
Elevation (m)
Enkouji gauge station→
Figure 5.Watershed of Chikusa River (left) and hydraulic flood model domain in section S of Sayo River (right). (Source: National Land Numerical Information download service, Ministry of Land, Infrastructure, Transport and Tourism, Japan, for digital elevation model, wa-tersheds, and river network and Kinki Regional Development Bureau, Ministry of Land, Infrastructure, Transport and Tourism Japan for the aerial photo taken in 2010.)
Flow→
C.S. (Fr=1)
↓
Sub-critical stagnated
flow because of
backwater from C.S.
↓
↑
Super-critical drawdown
flow regulated by C.S.
↑
Super-critical drawdown
flow regulated by C.S.
Hydraulic jump
↓
Figure 6. Schematic diagram of one-dimensional flow over em-bankment. C.S. in figure corresponds to the critical section where the flow is critical.
bankment crest. The flow on the lee side of embankment is supercritical and the water level is regulated by the C.S. The local flow rate over the embankment crest estimated by the embankment-resolving fine-resolution inundation simu-lation (e.g., Tsubaki and Kawahara, 2013) has non-negligible uncertainty because of high sensitivity to the embankment shape and height represented by the undulation of the cal-culation grid based on the digital elevation model and land cover data. This is because exchange between kinetic and potential energies is actively occurring in this area (Chow, 1959), leading to a two-dimensionally undulating water sur-face profile and inhomogeneous velocity distribution (Tsub-aki and Kawahara, 2013). For these reasons we use the up-stream water level as a hazard level to explain the probability of railway failure.
Accounting for other variables in the design of fragility curves remains a matter of debate. In fact, the time
dura-tion of overtopping and turf quality was accounted for to ob-tain fragility curves for a well-managed river embankment in Apel et al. (2004). Their model parameters were determin-istically fitted to the experiment conducted in Hewlett et al. (1987) and the damage probability was not validated to the levee breach records.
Properties of ballast, embankment fill, and surface cover of the embankment are regulated in the construction code and regularly inspected and maintained. The two railway lines fo-cused on in this paper are single-track, unelectrified railways running through mountainous regions, which started opera-tion about 90 years ago. In this regard, the material prop-erties of the railways are relatively homogeneous. However, the remaining uncertainties in properties of the embankment are not negligible when deterministically evaluating failure occurrence. This is true for river embankment overtopping as well, so a probabilistic approach has been used for this problem (e.g., Dawson et al., 2005; Apel et al., 2009).
In the fragility curve approach, a probabilistic damage function can be expressed by a two-parameter normal distri-bution function (Shinozuka et al., 2000; Suppasri et al., 2012; Mas et al., 2012),
P (a)=8
a−µ
σ
, (1)
or log-normal distribution function, P (a)=8
ln(a/c)
ζ
, (2)
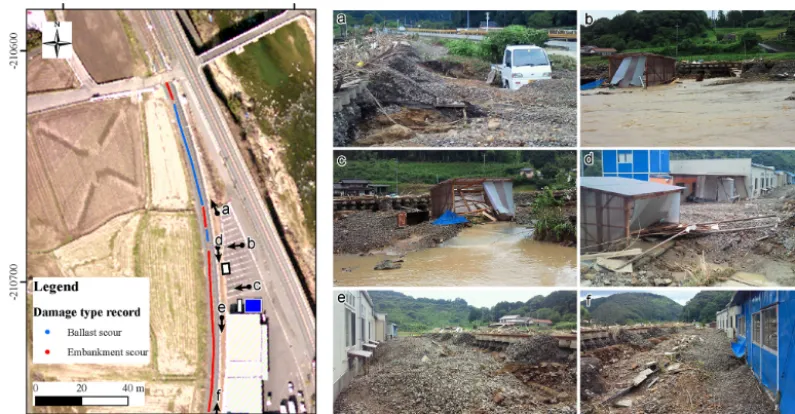
Figure 7.Example of the photos showing the status of the railway ballast–embankment scour just after the flood. Shooting location and direction of each photo are both plotted in the left orthorectified aerial photo taken in February 2012 (photo source: M. Kikunaga).
deviation of hazard level; and candζ are the median and log-standard deviation, respectively (refer to the list of math-ematical notation used in this paper at the end of the Ap-pendix). The deviation parametersσ orζ represent both un-certainty in hazard levela and variation in fragility among data points (Mander, 1999). The estimation of the two model parameters (median and deviation) is carried out by maxi-mizing the likelihood function. The likelihood function for binary damage (damage/no damage) is
L= N Y
i=1
h
P (ai)
ixih
1−P (ai)
i1−xi
, (3)
whereai is the hazard level (overtopping water depth in this
study) of sample number i; xi =1 or 0 indicates
embank-ment scour or no breach, respectively, under the correspond-ing damage type; andN is the total number of samples. 3.2 Railway damage record
3.2.1 Asa River flood of 2010
Locations of ballast and embankment fill scour are deter-mined by investigating photos showing the status of the rail-way ballast–embankment scour just after the flood (see Fig. 7 as an example) and the status after the recovery works (per-sonal communication with the factory and downloaded from the internet) as well as aerial photos of the area obtained in February 2012 and orthorectified to 0.5 m resolution. The ballast and embankment just after reconstruction differed in color compared with the section not scoured because weath-ering, iron dust due to railway passage, and vegetation cover alter the surface color.
3.2.2 Sayo River flood of 2009
Kaneko (2010) reported ballast and embankment scour dam-age to the railway as a function of kilometer post along the track and our damage map was mainly based on this report. Additionally, site survey data (I. Ario, personal communica-tion, 2009), photos from the internet, and aerial photos, taken in October 2009 (immediately after the flood) and orthorecti-fied in 0.2 m resolution, were utilized to detail damage along the length of the section of railway.
3.3 Estimation of overtopping water stage 3.3.1 Hydraulic model for flood flow simulation
(Tsubaki et al., 2012a)
The river and floodplain flows were calculated by solving the shallow water equations. The basic equations solved here are as follows:
∂U
∂t + ∂E
∂x + ∂F
∂y =S, (4)
U= h hu hvT,
E= hu hu2+0.5gh2 huvT,
F= hv huv hv2+0.5gh2T
,
S= qs gh(S0x−Sfx−SHx) gh(S0y−Sfy−SHy)T,
are the bed slopes in thexandy directions calculated using the ground elevationzas
S0x= −
∂z
∂x, S0y= − ∂z
∂y. (6)
Sfx andSfy are the friction slopes evaluated by using the
Manning’s roughness coefficientnas follows:
Sfx=
n2u
√
u2+v2 h4/3 , Sfy=
n2v
√
u2+v2
h4/3 . (7)
SHxandSHyare the energy slope due to the bridge with piers.
These terms are effective only at the cell interface located in the bridge cross section.
SHx=
∂Hb
∂x , SHy= ∂Hb
∂y , (8)
where Hb is the energy head relative to loss due to the bridge. The amount of head loss was calculated by using D’Aubuisson’s empirical formula (Chow, 1959; Sakano, 2003; Tsubaki et al., 2012a). The equations were solved by means of the finite volume method on an unstructured triangular grid. The flux difference scheme was used to evaluate fluxes through the boundaries of each triangular cell.
(a) Asa River model
Due to the short length of the river reach (2 km) focused on in this study, and the relatively steep riverbed slope (1/240), the flood was evaluated using a steady peak flow simula-tion. The inflow rates, based on the hydrologic analysis de-scribed in Sect. 2.1 and validated in Ube Construction Office (2012), were used as constant inflow boundary conditions for a two-dimensional unsteady flow model. Resolution of the triangular mesh was 2 m in the area of railway embankment fill and 5 m elsewhere. Manning’snwas set to 0.03 m−1/3s in the river channel and floodplain (Ube Construction Of-fice, 2012), and 0.1 m−1/3s in vegetated and built-up areas (Chow, 1959). This river channel roughness equals that used by Yamaguchi Prefecture in historical analyses (Ube Con-struction Office, 2012). The downstream boundary condition was water level as determined by Yamaguchi Prefecture’s calculation (Ube Construction Office, 2012).
Note that the two-dimensional shallow water model with fine calculation grid was reported to be substantially less sensitive to the roughness coefficient (Horritt, 2000; Hor-ritt and Bates, 2002; Tsubaki and Kawahara, 2013) and the roughness coefficient reflects more physical basis (Horritt and Bates, 2002) compared with the simplified models like the 1-D inundation model (e.g., HEC-RAS) or 1-D river model coupled with a simplified 2-D inundation model (e.g., LISFLOOD-FP).
(b) Sayo River model (Tsubaki et al., 2012a)
The domain represented in the inundation simulation (Fig. 5, right panel) was about 15 km2in area. The Sayo River flows through this section, and no major tributaries are present here. Elevation data for the calculation grid were configured using aerial lidar (light detection and ranging) for the river-side region, and a 50 m grid DEM (digital elevation model) was utilized for the intermountain area. A comparatively small grid size (3 m for the length of a side of a triangle) was used around the river and the railway to represent the details of the topography (Bates et al., 2003; Cobby et al., 2003; Rath and Bajat, 2004). In the mountain area, a larger grid size (40 m in length) was used to reduce computational load. Manning’s roughness parameter n was set to 0.02 m−1/3s for the riverbed and the floodplain, 0.1 m−1/3s for vegetated ar-eas of the river course and floodplain as well as for residential areas (Chow, 1959), and 0.3 m−1/3s for mountainous areas. The river channel roughness was determined based on the bed material size (Chow, 1959, p. 206) and the surface cover status. The area covered by trees in the channel was consid-ered vegetated.
The discharge estimated by using a hydrological model based on ground rain gauge data (Fujita et al., 2014) was used as the inflow boundary condition (Sect. 2.2). The rating curve at the outflow cross section was estimated and the flow rate at the outflow cross section calculated by the hydrolog-ical model was converted to water stage. The source term in the mass conservation equation (qs in Eq. 5) represents the direct runoff in this area; the observed gross precipitation is multiplied by a runoff ratio of 0.85 to account for the amount of net surface runoff in this area.
3.3.2 Validation of inundation flow models
To validate the inundation flow models, calculated results are compared with inundation records.
(a) Asa River model
Legend River Recorded Calculated Calculation domain
}
Inundatedarea
0 5001000m
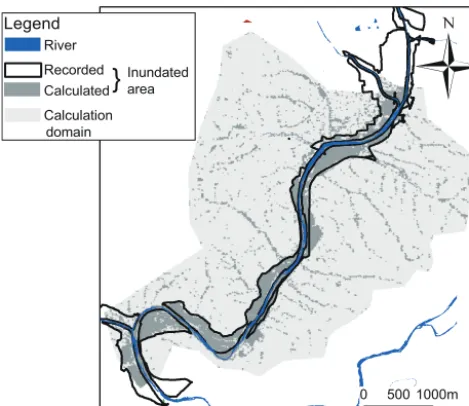
Figure 8.Comparison of calculated and recorded inundation areas (Tsubaki et al., 2012a).
the recorded trace elevation was 25.81 m, model average elevation was 25.61 m, and model maximum elevation was 25.67 m. Modeled average elevation is about 19 cm too low, and maximum elevation is about 11 cm too low, compared to measured trace elevations.
(b) Sayo River model
As shown in Fig. 8, the calculated inundation area corre-sponds closely to the recorded inundation area based on the field survey conducted by Hyogo Prefecture. In Fig. 9, cal-culated and recorded inundation water stages are compared. The calculated water stage is represented byh+z. The mean absolute error is 0.28 m, and the magnitude of the error is smaller than, but comparable to, the magnitude of inundation water depth, 1 m.
3.3.3 Uncertainty in flood water stage
According to the benchmarking of a two-dimensional high-resolution (∼2 m grid spacing, lidar topography based) ur-ban flood model reported by Hunter et al. (2008), the uncer-tainty in predicted water level among six hydraulic models was assessed as 0.05 m. This is the same order of RMSE in the terrain data they used and a similar result was reported in Tsubaki and Kawahara (2013), too.
The difference between calculated and recorded water stages in our simulation was 0.1∼0.3 m, and this is larger than the water level uncertainty estimated by numerical mod-els reported by Hunter et al. (2008). This discrepancy may be related to larger inaccuracy in the lidar data we used due to very uneven terrain and quite a complex surface cover, including rails on the railway embankment and vegetation
80 85 90 95 100 105
80 85 90 95 100 105
C
al
cu
la
te
d
w
at
er
s
ta
g
e
(m
)
Recorded water stage (m)
Figure 9.Comparison of calculated and recorded flood stages in Tokyo datum. The straight line shows the perfect-agreement line, i.e., recorded water stage = calculated water stage (Tsubaki et al., 2012a).
cover on the embankment slope. Moreover, there is a dif-ference in the definitions of calculated and recorded water depths, namely the calculated water depth is a cell-averaged quantity but the recorded water depth denotes the local wa-ter depth around obstacles; this caused an underestimation of the calculated water depth as reported in Sect. 3.3.2a for the Asa River and shown in Fig. 9 for the Sayo River.
In summary, the magnitude of uncertainty in flood water stage in this study was non-negligible but inevitable in prac-tice because of the complexity of the topography and uncer-tainty in the topographic data available. The fragility curve concept can account for the uncertainty in the explanatory variable, overtopping water depth in this study. The effect of uncertainty in water level prediction on the fragility curve will be discussed in Sect. 5.3.
4 Results
The difference betweenHand the elevationzof the railway track is overtopping water depth1h, namelyH=z+1h, and1hwas correlated with the recorded types of damage categorized into “no damage”, “ballast scour”, and “embank-ment scour” in Sect. 3.2, and listed in Tables A2 and A3. Then, fragility curves were developed based on this corre-lation. Both upstream water levelH and rail track elevation zare derived from the cell-averaged quantities used in the model described in Sect. 3.3.
con-0 0.1 0.2 0.3 0.4 0.5 0.6 0.7 0.8 0.9 1
0 0.2 0.4 0.6 0.8 1
P
ro
b
ab
il
it
y
Overtopping water depth, Δh(m) Fragility curve (normal) Fragility curve (log) No damage Emb. damage Running average
Figure 10. Fragility curves for embankment scour damage de-scribed by normal and log-normal distributions.
tribute to determining the coefficients in Eqs. (1) or (2) so the point where neither overtopping was observed nor track dam-age was recorded was excluded. The locations were selected where the model result showed that the tracks were indeed overtopped and the damage types were confidently observed in Sect. 3.2. As such, 10 data points were selected for the Asa River, and 21 data points for the Sayo River. These 31 data points, at which damage type was described in Sect. 3.2 and the overtopping water depth was estimated in Sect. 3.3, were used as samples to fix parameters in the fragility curves (Eqs. 1, 2).
Figure 10 displays the fragility curves for the embankment scour using the normal distribution (depicted by the dashed line with log-likelihood ln(L)= −7.3) and the log-normal distribution (the solid line with log-likelihood = −7.9) re-sulting from data points at which either no damage (the num-ber of samples was n=8) or embankment scour (n=16) was observed at two flood events. In Fig. 10, open symbols represent individual data points, while filled figures repre-sent overtopping water depth and damage data which have been put through a five-point running average after ordering by overtopping water depth. Though both normal and log-normal distribution models (solid and dashed lines, respec-tively) represent well the trend of damage probability based on the field record (filled circles), the normal distribution has a slightly better fit.
Figure 11 shows the fragility curves for the ballast scour using the normal distribution (depicted by the dashed line with log-likelihood= −2.6) and the log-normal distribution (the solid line with log-likelihood= −2.6) resulting from data points at which either no damage (the number of sam-ples wasn=8) or ballast scour (n=7) were observed during the two flood events. The normal and log-normal curves were almost identical.
0 0.1 0.2 0.3 0.4 0.5 0.6 0.7 0.8 0.9 1
0 0.2 0.4 0.6 0.8 1
P
ro
b
ab
il
it
y
Overtopping water stage, Δh(m) Bal. only (log) Bal. only (normal) No damage Bal. damage Running average
Figure 11.Fragility curves for ballast scour damage described by normal and log-normal distributions.
0 0.1 0.2 0.3 0.4 0.5 0.6 0.7 0.8 0.9 1
0 0.2 0.4 0.6 0.8 1
P
ro
b
ab
il
it
y
Overtopping water depth, Δh(m) Emb. (log)
Bal. only (normal) Bal. and Emb. (log)
Figure 12.Fragility curves for ballast scour (Bal. only), embank-ment scour (Emb.), and ballast and embankembank-ment scour (Bal. and Emb.)
5.1 Consistency in lower limit of damage probability with experimental result
Ballast damage is a transitional type of damage, falling be-tween “no damage” and embankment fill scour in its sever-ity. The number of samples with ballast damage available in this study is limited (n=7) because this type of damage oc-curred in between sections with embankment fill scour and “no damage”. During a full-scale experiment of ballast scour (Tsubaki et al., 2012b), steady scour was observed begin-ning at a flow rate per unit length ofqc=0.045 m2s−1. Fig-ures 10–12 show overtopping water depth on thexaxis, but there is a relation between surcharge water depth and over-topping flow rate as described previously. By adopting the broad-crested weir concept, the overtopping discharge per unit length can be estimated as
q=α1h3/2, (9)
where α=2.46 to 3.47 and 1h is the overtopping water depth (Chow, 1959). Using Eq. (9) andα=2.46, the over-topping water depth is converted to the overover-topping flow rate per unit length in Fig. 13. In this figure, the critical flow rate for ballast scour is depicted as a vertical dashed line. This critical flow rate corresponds well to the initial rise of the log-normal fragility curve for embankment and ballast scour. The agreement of the initial rise of the fragility curve of embankment–ballast scour and critical flow rate to initiate ballast scour indicates that railway overtopping damage be-gins with ballast scour and progresses to embankment scour. This also implies that the critical flow rate for initiation of ballast scour based on the full-scale experiment of ballast scouring conducted by Tsubaki et al. (2012b) can be used as a critical condition for initiation of railway ballast damage in the field. The initial rise of the fragility curve of ballast scour had substantially large flow rate compared with the critical flow rate based on the ballast scour experiment. This implies the fragility curves of ballast scour underestimate the damage probability.
5.2 Profile of upper side of fragility curves
The largest overtopping flow rate at which no damage was observed at the point s1 (Table A2, 1h=0.31 m andq=
0.43 m2s−1) and damage probability for this hazard level was 0.6–0.8 for all developed fragility curves (Figs. 13, 9, 10, 11, 12). The damage probabilities converge to unity for larger hazard level and convergent rate with increase of haz-ard level differs depending on the types of fragility curve. The fastest convergence of the damage probability to unity was observed in the ballast scour model and followed by the ballast and embankment scour model. The embankment scour model showed the slowest convergence to unity. The log-normal models also showed relatively slow convergence
0 0.1 0.2 0.3 0.4 0.5 0.6 0.7 0.8 0.9 1
0 0.2 0.4 0.6 0.8 1
P
rob
ab
il
it
y
Overtopping flow rate,q(m2s−1)
Bal. and Emb. (log) Bal. only (log) Exp. ballast failure
Upper limit of no damage record
Figure 13.Fragility curve for ballast failure using overtopping flow rate per unit length. The dashed line indicates the experimental bound at which the onset of ballast scour occurs (Tsubaki et al., 2012b). The double line corresponds to the upper limit of the flow condition where no damage was observed.
to unity compared with the corresponding normal models. An overtopping flow rate of 0.5 m2s−1 (corresponding to an overtopping water depth of 0.4 m) is quite an intense flow from the viewpoint of earthen embankment overtop-ping (Apel et al., 2004) and it is very unlikely that no scour will occur during such an intense flow. The damage prob-ability of the ballast scour model was almost unity but the damage probability of the embankment scour model and em-bankment and ballast scour model was about 0.9 and 0.95 for this range (q=0.5 m2s−1 and1h=0.4 m). Thus, the log-normal models and the embankment scour models may underestimate the damage probability for large hazard level. 5.3 On the deviation of probabilities
In Fig. 11, the fragility curve for ballast scour has a median overtopping water depth of 1h=0.30 m, and its variance σ=0.035 m is smaller than those of the fragility curves for the embankment scour and combined ballast and embank-ment scour. It must be kept in mind that the lidar topography used in the flood model has an RMSE on the order of 0.1 m, and the uncertainty in hindcast flood levels was on the or-der of 0.2 m, so the standard deviationσ=0.035 m of the ballast scour model is very small compared with expected uncertainty in the estimated overtopping water level. The ex-periment of Tsubaki et al. (2012b) showed ballast scour to begin atqc=0.045 m2s−1, which is an order of magnitude smaller than the median (q=0.4 m2s−1) or lower limit (q=
Figure 14.Estimated damage probability (left) and damage type record (right) at Asa River section M. The yellow symbols in the right map depict data points listed in Table A1.
may partially be explained by the fact that the ballast em-bankment in the field had been consolidated due to periodi-cal loading by railcars so the actual ballast may have greater resiliency than in the experiment conducted by Tsubaki et al. (2012b). Even so, ballast should be more vulnerable to over-topping scour than embankment fill is, but the fragility curves shown in Fig. 13 did not correspond to such a relation. It is also possible that, in the field cases studied, ballast scour at smaller overtopping flow rates always coincided with com-bined ballast and embankment scour, not ballast scour alone. The fragility curve for ballast and embankment scour is the most feasible among the fragility curves developed in this study. Future work is needed to improve the fragility curve for ballast scour by acquiring more sample data points in the field and running further hydraulic experiments.
5.4 Validation of railway fragility curve
A validation of the combined damage fragility curve, of which feasibility was discussed above, was conducted by comparing its calculated probabilities to the actual damage record. The normal distribution for combined ballast and embankment scour was determined to be the most feasible model based on the discussion in Sects. 5.1–5.3. Via the model, the damage probability along the rail track in the Asa River floodplain at 10 m intervals was calculated and plotted in Fig. 14 (left). Thirty-one of the data points, used in Sect. 4 and listed in Tables A1 and A2 to obtain the fragility curves, were selected where the damage type record was confident (e.g., not marginally at the border of two damage types), but a point array at 10 m intervals was used for the validation here. Damage probability in Fig. 14 (left) is calculated without re-gard to the types of failure (ballast or embankment scour), but it is calculated with the fragility curve for ballast and em-bankment scour; however, the actual damage record of the right figure distinguishes the type of damage. In Fig. 14, there is variability in the calculated result, but the area where the
ballast and embankment scours were observed is predicted as a high damage probability area. The points at which no damage was calculated are points at which the flood model calculated either a very shallow overtopping water depth, or no overtopping at all. The railway crest in this section is al-most horizontal. Since the crest of the railway embankment consists of both rail and railway ties (sleepers), the 1 m2 res-olution lidar data cannot resolve this, and the 1.7 m2 trian-gular mesh carries forward this variation, leading to an un-avoidable difference between modeled and actual topogra-phy. Since actual railway crest elevation does not experience spurious variations at 10 m intervals, topography based on lidar data of limited resolution and accuracy might be im-proved by application of a spatial filter along the railway.
Figure 15.Estimated damage probability (top) and damage type record (bottom) at Sayo River section S. The yellow symbols in the bottom figure depict data points listed in Table A2. (Source: Kinki Regional Development Bureau, Ministry of Land, Infrastructure, Transport and Tourism Japan for the aerial photo taken in 2010.)
crest elevation (Fig. 16). Therefore, the entire segment was overtopped with shallow surcharge. However, small errors in topography at the size of each model grid cell caused large difference in the overtopping water depth, resulting in erro-neous damage probabilities at the 10 m intervals at which damage was assessed. The fragility curve concept can also account for uncertainty in hazard level (overtopping water depth in this paper) by adjusting the deviation parametersσ or ζ in Eq. (1) or (2) (Mander, 1999); in segments within which sporadic damage is predicted, the level of damage can be estimated by averaging the damage predicted for points within the segment. However, the reason damage in Seg-ment B of Fig. 15 was not evaluated as such an average is that the error in grid-scale model topography was too large to just cause variations in overtopping water depth; rather, the error caused many points within the segment to not expe-rience any overtopping at all. Therefore, the model predicted scattered damage for Segment B.
A B
Bridge Bridge Confluence with
Bridge
I=1/250
80 85 90 95 100 105
47 48 49 50 51
E
le
va
ti
on (m
)
Distance (km)
Ballast loss Embankment breach River bank elev. Rail embankment elev.
6 Conclusions
This paper shows the significance of evaluating the likeli-hood of damage to railway embankments due to overtopping. Fragility curves were developed to relate damage probability to overtopping water depth, itself calculated via the use of a hydraulic flood model. Fragility curves were generated based on recorded observations of railway damage types, simulated overtopping water depth and two types of curves (normal and log-normal distributions). Each fragility curve was val-idated by comparison between modeled damage probability and records of observed damage. The fragility curve for bal-last scour, the damage type expected to be the initial phase to lead the embankment scour, did not match the criteria re-vealed through laboratory experiments of ballast scour and may underestimate actual damage probability. However, the fragility curve for combined ballast and embankment scour represents well the laboratory experiment result for the onset of scour. Field validation of the combined damage fragility curve was carried out by comparing modeled damage prob-ability with recorded damage at two different river sections. At one location, where recorded damage indicated continu-ous railway washout over stretches, fragility curve damage probability agreed with observed damage quite well. In con-trast, the model did not represent well-observed damage in locations of relatively flat and level railway crest, where vari-ations in the simulated overtopping water depth were affected by small errors in the topographic data, resulting in sporadic flood overtopping where no damage existed in reality.
Though the fragility curves developed here are useful for estimation of damage probability for single-track non-electrified railway embankments, the limited number of data points used to generate these curves could prevent them from being applicable to a variety of situations. To make these curves more robust, more field records in different types of environments are needed. Furthermore, the fit of modeled ballast scour probability to observed ballast damage was un-satisfactory, indicating the necessity for further laboratory experiments and field data collection. Whether the developed fragility curves is applicable to railway embankments outside Japan will depend on how closely construction/maintenance standards in the country of application matches the construc-tion standards in Japan. In addiconstruc-tion, the role of small errors in the hydraulic flood model result on predicted damage proba-bility has become clear, and the application of spatial filter-ing to improve model accuracy needs to be investigated in the future.
7 Data availability
curves
Table A1.Point-wise estimated overtopping water depth1hand damage types for the Asa River flood. In damage types row, emb. is embankment scour, bal. is ballast scour, and no is no damage. Location of each point is indicated in Fig. 14.
Point Calcz(m) CalcH(m) 1h(m) Damage types
a1 26.89 27.36 0.47 emb.
a2 26.94 27.35 0.41 bal. a3 26.94 27.35 0.41 bal.
a4 26.90 27.35 0.45 emb.
a5 26.99 27.34 0.35 bal.
a6 27.00 27.35 0.35 emb.
a7 26.94 27.35 0.41 emb.
a8 26.90 27.35 0.45 emb.
a9 26.91 27.35 0.44 emb.
a10 26.93 27.34 0.41 bal.
Table A2.Point-wise estimated overtopping water depth1hand damage types for the Sayo River flood. Location of each point is indicated in Fig. 15.
Point Calcz(m) CalcH(m) 1h(m) Damage types
s1 95.56 95.88 0.31 no
s2 94.96 95.30 0.34 bal.
s3 91.55 91.83 0.28 emb.
s4 91.12 91.36 0.24 emb.
s5 90.85 90.98 0.13 no
s6 89.88 90.37 0.49 bal.
s7 89.85 90.10 0.25 no
s8 87.65 87.93 0.28 bal.
s9 87.37 87.94 0.57 emb.
a hazard level and overtopping water depth1hin this study (m) c median of hazard levela(m)
g gravity acceleration (m s−2)
h water depth (m)
H water level (m)
Hb energy head relative to bridge energy loss (m)
i slope (–)
L likelihood function (–)
n Manning’s roughness coefficient (m−1/3s)
P (a) probability of occurrence for the specific state of damage under the condition ofa(–) r rainfall intensity (mm h−1)
Rsa saturation criterion to start run (mm) q discharge per unit width (m2s−1)
qs source in water mass representing precipitation (m s−1) S0x,S0y bed slopes inxandydirections (–)
Sfx,Sfy friction slopes inxandydirections (–)
SHx,SHy energy slopes inxandy directions due to the head loss by the bridge pier (–)
t time (s)
u,v depth-averaged velocity components correspond toxandycoordinates (m s−1) x,y horizontal coordinates (m)
1h overtopping water depth (m)
α coefficient used to correlate overtopping water depth and flow rate (m1/2s−1) µ median of hazard levela(m)
σ standard deviation of hazard levela(m) 8 normal error function
Acknowledgements. The authors thank Martin Judd at New Jersey Transit for providing us information about railway system damage due to storm surge, Seth Guikema at the University of Michigan for providing us information about HAZUS, Koji Asai at Yamaguchi University, Akihiko Nakamura and Kentaro Tomura at Asia Air Survey Co., Ltd., and Hiroyuki Nagano at National Institute of Technology, Gunma College, for their corporation in the Asa River flood study. Ube construction office, Yamaguchi Prefecture, provided essential data regarding the Asa River flood. Our study was partially funded by the JSPS-NSF Cooperative Program for Interdisciplinary Joint Research Projects in Hazards and Disasters project entitled “Evolution of Urban Regions in Response to Recurring Disasters”, a grant from the Chugoku Civil Engineering Foundation for Mutual Aid, Japan, and a grant from the Foundation for River and Watershed Environment Management, Japan.
Edited by: B. D. Malamud
Reviewed by: two anonymous referees
References
Apel, H., Thieken, A. H., Merz, B., and Blöschl, G.: Flood risk assessment and associated uncertainty, Nat. Hazards Earth Syst. Sci., 4, 295–308, doi:10.5194/nhess-4-295-2004, 2004. Apel, H., Merz, B., and Thieken, A.: Influence of dike breaches
on flood frequency estimation, Comput. Geosci., 35, 907–923, doi:10.1016/j.cageo.2007.11.003, 2009.
Argyroudis, S. and Kaynia, A. M.: Fragility Functions of Highway and Railway Infrastructure, Springer Netherlands, Dordrecht, 299–326, doi:10.1007/978-94-007-7872-6_10, 2014.
Bates, P. D., Marks, K. J., and Horritt, M. S.: Optimal use of high-resolution topographic data in flood inundation models, Hydrol. Process., 17, 537–557, doi:10.1002/hyp.1113, 2003.
Brammer, H.: Floods in Bangladesh: II. Flood Mitigation and Envi-ronmental Aspects, Geogr. J., 156, 158–165, 1990.
Bunya, S., Dietrich, J. C., Westerink, J. J., Ebersole, B. A., Smith, J. M., Atkinson, J. H., Jensen, R., Resio, D. T., Luettich, R. A., Dawson, C., Cardone, V. J., Cox, A. T., Powell, M. D., Wes-terink, H. J., and Roberts, H. J.: A High-Resolution Coupled Riverine Flow, Tide, Wind, Wind Wave, and Storm Surge Model for Southern Louisiana and Mississippi. Part I: Model De-velopment and Validation, Mon. Weather Rev., 138, 345–377, doi:10.1175/2009MWR2906.1, 2010.
Cabinet Office, Government of Japan: White paper on elderly soci-ety, Cabinet Office, Government of Japan, 2016 (in Japanese). Changnon, S. A.: Impacts of the 2008 floods on railroads in Illinois
and adjacent states, Transactions of the Illinois State Academy of Science, 102, 181–191, 2009.
Chow, V. T.: Open channel hydraulics, McGraw-Hill Book Com-pany, Inc; New York, reprinted by Blackburn Press, 1959. Cobby, D. M., Mason, D. C., Horritt, M. S., and Bates, P. D.:
Two-dimensional hydraulic flood modelling using a finite-element mesh decomposed according to vegetation and topographic fea-tures derived from airborne scanning laser altimetry, Hydrol. Pro-cess., 17, 1979–2000, doi:10.1002/hyp.1201, 2003.
Dawson, D., Shaw, J., and Gehrels, W. R.: Sea-level rise impacts on transport infrastructure: The notorious case of the coastal rail-way line at Dawlish, England, J. Transp. Geogr., 51, 97–109, doi:10.1016/j.jtrangeo.2015.11.009, 2016.
Dawson, R., Hall, J., Sayers, P., Bates, P., and Rosu, C.: Sampling-based flood risk analysis for fluvial dike systems, Stoch. Env. Res. Risk A., 19, 388–402, 2005.
Federal Emergency Management Agency: Earthquake model, Hazus(R)-MH MR5 technical manual, Federal Emergency Man-agement Agency, Washington, D.C., USA, 2010a.
Federal Emergency Management Agency: Flood model, Hazus(R)-MH MR5 technical manual, Federal Emergency Management Agency, Washington, D.C., USA, 2010b.
Federal Emergency Management Agency: Hurricane model, Hazus(R)-MH MR5 technical manual, Federal Emergency Man-agement Agency, Washington, D.C., USA, 2010c.
Fujita, I., Ito, T., and Sayama, T.: Inundation analysis of the 2009 Chikusa River flood and comparison of evacua-tion criteria, Journal of Flood Risk Management, 7, 54–64, doi:10.1111/jfr3.12020, 2014.
Hall, J. W., Dawson, R. J., Sayers, P. B., Rosu, C., Chatter-ton, J. B., and Deakin, R.: A methodology for national-scale flood risk assessment, P. I. Civil Eng.-Water, 156, 235–247, doi:10.1680/wame.2003.156.3.235, 2003.
Hata, Y., Sakai, H., Shizuma, T., Nozu, A., Ichii, K., and Maruyama, Y.: Evaluation of fragility curve on traffic function of river dike based on strong motion estimation considering empiri-cal site amplification and phase effects – The case of the Na-tuse River dike for the past large scale earthquakes –, Journal of Japan Society of Civil Engineers, Ser. A1 (Structural Engi-neering & Earthquake EngiEngi-neering (SE/EE)), 71, I_894–I_914, doi:10.2208/jscejseee.71.I_894, 2015 (in Japanese).
Hewlett, H., Boorman, L. A., and Bramley, L.: Design of reinforced grass waterways, Construction Industry Research and Informa-tion AssociaInforma-tion, London, UK, 1987.
Hong, L., Ouyang, M., Peeta, S., He, X., and Yan, Y.: Vul-nerability assessment and mitigation for the Chinese railway system under floods, Reliab. Eng. Syst. Safe., 137, 58–68, doi:10.1016/j.ress.2014.12.013, 2015.
Horritt, M. S.: Calibration of a two-dimensional finite element flood flow model using satellite radar imagery, Water Resour. Res., 36, 3279–3291, doi:10.1029/2000WR900206, 2000.
Horritt, M. S. and Bates, P. D.: Evaluation of 1D and 2D numerical models for predicting river flood inundation, J. Hydrol., 268, 87– 99, doi:10.1016/S0022-1694(02)00121-X, 2002.
Hunter, N. M., Bates, P. D., Neelz, S., Pender, G., Villanueva, I., Wright, N. G., Liang, D., Falconer, R. A., Lin, B., Waller, S., Crossley, A. J., and Mason, D. C.: Benchmarking 2D hydraulic models for urban flooding, P. I. Civil Eng.-Wat. M., 161, 13–30, 2008.
Ichii, K.: A seismic risk assessment procedure for gravity type quay walls, Structural engineering/Earthquake engineering, 19, 131s– 140s, doi:10.2208/jsceseee.19.131s, 2002.
IPCC: Climate Change 2014: Synthesis Report, Contribution of Working Groups I, II and III to the Fifth Assessment Report of the Intergovernmental Panel on Climate Change, edited by: Core Writing Team, Pachauri, R. K., and Meyer, L. A., IPCC, Geneva, Switzerland, 151 pp., 2014.
Japan Railway Civil Engineering Association: Yearly summary of railway damages, Journal of Japan Railway Civil Engineering Association, 6, 2000–2011 (in Japanese).
Journal of Japan Railway Civil Engineering Association, 6, 450– 451, 2010 (in Japanese).
Mander, J. B.: Fragility curve development for assessing the seis-mic vulnerability of highway bridges, Multidisciplinary Center for Earthquake Engineering Research (MCEER), University at Buffalo, State University of New York, New York, USA, 1999. Mas, E., Koshimura, S., Suppasri, A., Matsuoka, M., Matsuyama,
M., Yoshii, T., Jimenez, C., Yamazaki, F., and Imamura, F.: De-veloping Tsunami fragility curves using remote sensing and sur-vey data of the 2010 Chilean Tsunami in Dichato, Nat. Hazards Earth Syst. Sci., 12, 2689–2697, doi:10.5194/nhess-12-2689-2012, 2012.
Matanle, P.: Ageing and Depopulation in Japan: Understanding the Consequences for East and Southeast Asia in the 21st Century, in: East Asia in 2013: A Region in Transition, White Rose East Asia Centre and Foreign and Commonwealth Office Briefing Pa-pers, edited by: Dobson, H., Sheffield, UK, 30–35, 2014. Ministry of Land, Infrastructure, Transport and Tourism: White
pa-per on transport policy, Ministry of land, infrastructure, transport and tourism, Tokyo, Japan, 2015.
Onoda, H. and Hayano, K.: SPH simulation of railroad ballast bed slope collapse under inundation flow, Journal of Japan Society of Civil Engineers, Ser. E1 (Pavement Engineering), 71, 97–107, doi:10.2208/jscejpe.71.97, 2015 (in Japanese).
Polemio, M. and Lollino, P.: Failure of infrastructure embank-ments induced by flooding and seepage: a neglected source of hazard, Nat. Hazards Earth Syst. Sci., 11, 3383–3396, doi:10.5194/nhess-11-3383-2011, 2011.
Railway Technical Research Institute: Standards for railway infras-tructure, earthen structures, Maruzen Co. Ltd., Tokyo, Japan, 2007 (in Japanese).
Rath, S. and Bajat, B.: Between sensing, forecasting and risk as-sessment: An integrated method to model high resolution data for floodplain representations in hydrodynamic simulations, in: Proceedings of the 1st Goettingen Remote Sensing Days, edited by: Erasmi, S., Cyffka, B., and Kappas, M., Goettingen, 7–8 Oc-tober 2004.
Reed, D. W.: A review of British railway bridge flood failures, Hy-drology: Science & Practice for the 21st Century, 1, 210–216, 2004.
Sakano, A.: Hydraulic study on accumulation of drifting wood at a bridge during a flood, Technical note of National Institute for Land and Infrastructure Management, Ibaraki, Japan, 2003. Sayama, K., Kobayashi, K., and Takara, K.: The hydrological
anal-ysis of the flood due to the typhoon Etau, Technical report on the damage due to the typhoon Etau, Japan Society of Civil Engi-neers, 2010.
Scawthorn, C., Flores, P., Blais, N., Seligson, H., Tate, E., Chang, S., Mifflin, E., Thomas, W., Murphy, J., Jones, C., and Lawrence, M.: HAZUS-MH Flood Loss Estimation Methodology. II. Dam-age and Loss Assessment, Natural Hazards Review, 7, 72–81, doi:10.1061/(ASCE)1527-6988(2006)7:2(72), 2006.
Shimozono, T. and Sato, S.: Coastal vulnerability analysis during tsunami-induced levee overflow and breaching by a high-resolution flood model, Coast. Eng., 107, 116–126, doi:10.1016/j.coastaleng.2015.10.007, 2016.
Shinozuka, M., Feng, M. Q., Lee, J., and Naganuma, T.: Statistical Analysis of Fragility Curves, J. Eng. Mech.-ASCE, 126, 1224– 1231, 2000.
Steers, J. A., Stoddart, D. R., Bayliss-Smith, T. P., Spencer, T., and Durbidge, P. M.: The Storm Surge of 11 January 1978 on the East Coast of England, Geogr. J., 145, 192–205, 1979.
Suppasri, A., Koshimura, S., and Imamura, F.: Developing tsunami fragility curves based on the satellite remote sensing and the nu-merical modeling of the 2004 Indian Ocean tsunami in Thailand, Nat. Hazards Earth Syst. Sci., 11, 173–189, doi:10.5194/nhess-11-173-2011, 2011.
Suppasri, A., Mas, E., Koshimura, S., Imai, K., Harada, K., and Imamura, F.: Dveloping tsunami fragility curves from the surveyed data of the 2011 great east Japan tsunami in Sendai and Ishinomaki plains, Coast. Eng. J., 54, 1250008, doi:10.1142/S0578563412500088, 2012.
Tachikawa, Y., Shrestha, R., and Sayama, T.: Flood prediction in Japan and the need for guidelines for flood runoff modelling in predictions in ungauged basins, in: International perspectives on the state of the art and pathways forward, IAHS Publ. 301, 78– 86, 2006.
Tsubaki, R. and Kawahara, Y.: The uncertainty of local flow parameters during inundation flow over complex to-pographies with elevation errors, J. Hydrol., 486, 71–87, doi:10.1016/j.jhydrol.2013.01.042, 2013.
Tsubaki, R., Kawahara, Y., Sayama, T., and Fujita, I.: Anal-ysis of geomorphic and hydraulic conditions causing railway embankment breach due to inundation flow, Jour-nal of Hydroscience and Hydraulic Engineering, 30, 87–99, https://ir.lib.hiroshima-u.ac.jp/files/public/3/39096/ 20160212131039699174/JHHE_30-1_87.pdf, 2012a.
Tsubaki, R., Kawahara, Y., and Ueda, Y.: An experimental study on railway embankment breach and its critical flow condition, in: 18th Congress of the Asia and Pacific Division of the IAHR, Jeju, Korea, IAHR, 19–23 August 2012b.
Tsubaki, R., Asai, K., Nakamura, A., Tomura, K., Kawahara, Y., and Nagano, H.: Inundation flow in moutanious village in Asa River basin during 2010 July torrential rainfall event, Journal of Japan Society of Civil Engineers, Ser. B1 (Hydraulic Engineer-ing), 70, I_1441–I_1446, doi:10.2208/jscejhe.70.I_1441, 2014 (in Japanese).
Ube Construction Office: Report of design work on the construc-tion secconstruc-tion 1 of the disaster prevenconstruc-tion work for Asa River, Ya-maguchi Prefecture, Japan, 2012.
Ueda, N. and Nakatsuka, H.: The circumstances and the effect of synthetic submersion-under-water damage mitigation measures (Second Dike etc.) in Hijikawa (East Ozu Area), River (Kasen), Japan River Association, 70, 24–27, 2014 (in Japanese). Vorogushyn, S., Merz, B., and Apel, H.: Development of
dike fragility curves for piping and micro-instability breach mechanisms, Nat. Hazards Earth Syst. Sci., 9, 1383–1401, doi:10.5194/nhess-9-1383-2009, 2009.
Wardhana, K. and Hadipriono, F. C.: Analysis of Recent Bridge Failures in the United States, J. Perform. Constr. Fac., 17, 144– 150, doi:10.1061/(ASCE)0887-3828(2003)17:3(144), 2003. Yamasaki, T., Yamamoto, H., Tateishi, Y., Harada, Y., Takayama,