Risk Management and Healthcare Policy
Dove
press
O R i g i n a l R e s e a R c H
open access to scientific and medical research
Open access Full Text article
Validation of a clinical risk-scoring algorithm
for severe scrub typhus
Pamornsri sriwongpan1,2
Jayanton Patumanond3
Pornsuda Krittigamas4
Hutsaya Tantipong5
chamaiporn Tawichasri6
sirianong namwongprom1,7
1clinical epidemiology Program,
Faculty of Medicine, chiang Mai University, chiang Mai, 2Department
of social Medicine, chiangrai Prachanukroh Hospital, chiang Rai,
3clinical epidemiology Program,
Faculty of Medicine, Thammasat University, Bangkok, 4Department
of general Pediatrics, nakornping Hospital, chiang Mai, 5Department
of Medicine, chonburi Hospital, chonburi, 6clinical epidemiology
society at chiang Mai, chiang Mai,
7Department of Radiology, Faculty
of Medicine, chiang Mai University, chiang Mai, Thailand
correspondence: sirianong namwongprom
Department of Radiology, Faculty of Medicine, chiang Mai University, chiang Mai 50200, Thailand Tel +66 53 945 458 Fax +66 53 945 476
email [email protected]
Objective: The aim of the study reported here was to validate the risk-scoring algorithm for prognostication of scrub typhus severity.
Methods: The risk-scoring algorithm for prognostication of scrub typhus severity developed earlier from two general hospitals in Thailand was validated using an independent dataset of scrub typhus patients in one of the hospitals from a few years later. The predictive performances of the two datasets were compared by analysis of the area under the receiver-operating charac-teristic curve (AuROC). Classification of patients into non-severe, severe, and fatal cases was also compared.
Results: The proportions of non-severe, severe, and fatal patients by operational definition were similar between the development and validation datasets. Patient, clinical, and laboratory profiles were also similar. Scores were similar in both datasets, both in terms of discriminating non-severe from severe and fatal patients (AuROC =88.74% versus 91.48%, P=0.324), and in discriminating fatal from severe and non-severe patients (AuROC =88.66% versus 91.22%,
P=0.407). Over- and under-estimations were similar and were clinically acceptable.
Conclusion: The previously developed risk-scoring algorithm for prognostication of scrub typhus severity performed similarly with the validation data and the first dataset. The scoring algorithm may help in the prognostication of patients according to their severity in routine clinical practice. Clinicians may use this scoring system to help make decisions about more intensive investigations and appropriate treatments.
Keywords: severity, clinical prediction rule, algorithm, prognosis, Thailand
Introduction
“Scrub typhus,” one of several potentially fatal tropical rickettsial infections, is caused by Orientia tsutsugamushi and presents as a systemic, vasculitis-like infection. Clinical manifestations are typically fever, eschar, generalized or regional lymphadenopathy, maculopapular rash, severe headache, and myalgia. Nausea and vomiting, diarrhea, and conjunctival injection can also occur.1,2 Without appropriate treatment, infected
patients usually experience complications in the second week. Those especially at risk of infection are the elderly, those without previous immunity,2–4 and those with risk
factors such as hypoalbuminemia, hyperbilirubinemia, high levels of aspartate amino-transferase (AST) and/or creatinine, and those with lung crepitations.3,5–10 Patients with
complications who are admitted to intensive care units with a high Acute Physiology and Chronic Health Evaluation II (APACHE II) score are at high risk of mortality.5
In rural areas where effective treatment is unavailable or delayed, mortality rates have been reported as high as 35%.2
Risk Management and Healthcare Policy downloaded from https://www.dovepress.com/ by 118.70.13.36 on 27-Aug-2020
For personal use only.
Number of times this article has been viewed
This article was published in the following Dove Press journal: Risk Management and Healthcare Policy
Dovepress
sriwongpan et al
The cost of treatment for scrub typhus patients with complications is much higher due to hospital admissions and more intensive treatments.11 Prognostication of disease
severity may help with the identification of disease severity and prompt initiation of treatments.
Prognostication of disease severity has been considered by researchers of various conditions. Examples include a clinical prediction rule for severe community-acquired pneu-monia,12 Mortality in Emergency Department Sepsis score,13
a prediction rule for risk of mortality in Clostridium difficile infection,14 and decision-tree algorithms for dengue fever15 and
dengue hemorrhagic fever.16 Some of these tools were found
to have both advantages and disadvantages when validated. Previously, we developed a clinical risk-scoring algorithm for scrub typhus severity comprising six predictors from routine practice.17 The objective of the study reported here
was to validate the risk-scoring algorithm developed earlier with an independent dataset obtained from similar patients from a few years later.
Materials and methods
Patients
Data were retrieved retrospectively from the medical files of scrub typhus patients. The criteria for inclusion were similar to those used in the previous study17 and were based
on history of disease exposure and presentation with acute fever and at least one of the following signs and symptoms: myalgia, headache, conjunctival injection, cough, profuse sweating, maculopapular rash, and/or lymphadenopathy accompanied by the presence of eschar, and/or a positive immuno-chromatographic test for scrub typhus.18
Patients were classified into three groups: 1. non-severe – patients without any complications 2. severe – patients with complications involving at least
one of the following organ systems:
• cardiovascular system – presence of any of any of the following: systolic blood pressure ,90 mmHg, myo-carditis (defined as elevated creatine kinase-myocardial band isoenzyme above baseline), or abnormal cardiac arrhythmia with no previous history of atrial fibril-lation, supra ventricular tachycardia, or frequent premature ventricular tachycardia
• respiratory system – presence of acute respiratory distress syndrome, defined as the ratio of partial pres-sure arterial oxygen and fraction of inspired oxygen (PaO2/FiO2) ,200 mmHg, with bilateral interstitial infiltration on chest film with normal cardio/thoracic ratio, or no volume overload of central venous pres-sure from central venous catheter
• central nervous system – presence of any of the following: Glasgow Coma Scale #12 without other causes, seizure without other causes, or meningoencephalitis
• hematological system – platelet count #20,000/mm3
• urinary system – presence of acute renal failure, defined as creatinine $2mg/dL or creatinine change of .0.5 mg/dL/day
• gastrointestinal and hepatobiliary system – presence of hepatitis, defined as elevated AST or alanine amino-transferase (ALT) more than fivefold normal levels. 3. fatal – patients who died in hospital from scrub typhus. Patients in any intervention trials during the same period were excluded from the data analysis.
Development data
The development data were for patients admitted to two university-affiliated referral hospitals – Nakornping Hospital, Chiang Mai and Chiangrai Prachanukroh Hospital – in the north of Thailand from 2004 to 2010 (n=526).
Validation data
The validation data were for patients admitted to Chiangrai Prachanukroh Hospital from 2011 to 2012 (n=257).
Data analysis
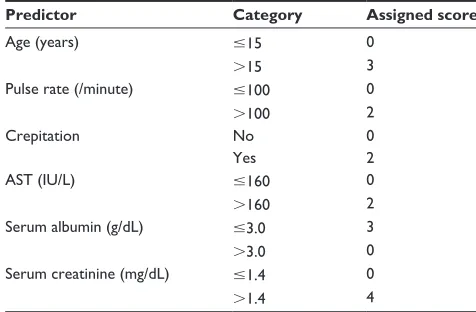
The characteristics of the development data and the valida-tion data were compared using an exact probability test, Student’s t-test, or Wilcoxon rank-sum test as appropriate. The patient risk scores were assigned following the scoring scheme previously developed (Table 1).17 Patients were
categorized into three severity groups: 1) non-severe, 2) severe, and 3) fatal, as described. The predictive perfor-mance of the scores was compared by analysis of the area under the receiver-operating characteristic curve (AuROC).
Table 1 Significant predictors and assigned item scores
Predictor Category Assigned score
age (years) #15 0
.15 3
Pulse rate (/minute) #100 0
.100 2
crepitation no 0
Yes 2
asT (iU/l) #160 0
.160 2
serum albumin (g/dl) #3.0 3
.3.0 0
serum creatinine (mg/dl) #1.4 0
.1.4 4
Risk Management and Healthcare Policy downloaded from https://www.dovepress.com/ by 118.70.13.36 on 27-Aug-2020
Dovepress Validation of scrub typhus severity score
Over- and underestimated proportions were calculated and compared.
ethical approval
The study was approved by the Ethics Committee for Research in Patients, Faculty of Medicine, Chiang Mai University, and the research ethical committees of the two hospitals.
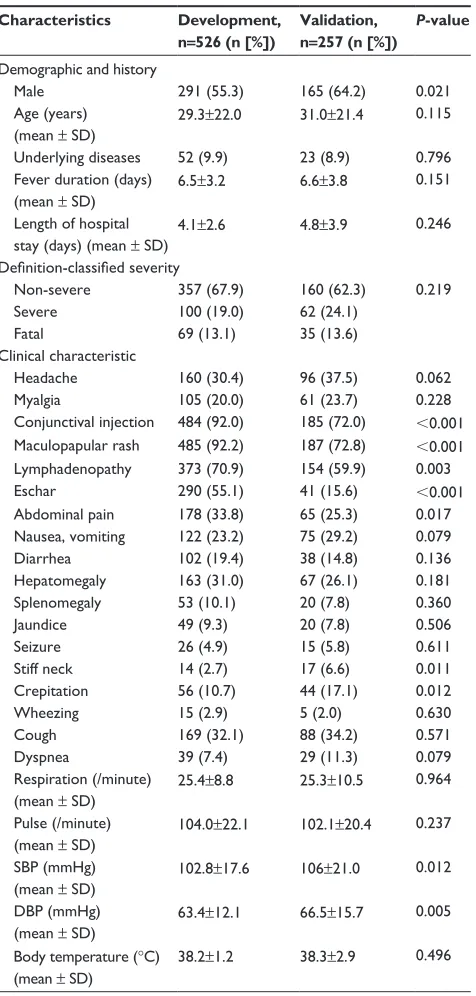
Table 2 Demographic and clinical characteristics of scrub typhus patients in the development and validation datasets
Characteristics Development,
n=526 (n [%]) Validation, n=257 (n [%]) P-value Demographic and history
Male 291 (55.3) 165 (64.2) 0.021
age (years) (mean ± sD)
29.3±22.0 31.0±21.4 0.115
Underlying diseases 52 (9.9) 23 (8.9) 0.796
Fever duration (days) (mean ± sD)
6.5±3.2 6.6±3.8 0.151
length of hospital stay (days) (mean ± sD)
4.1±2.6 4.8±3.9 0.246
Definition-classified severity
non-severe 357 (67.9) 160 (62.3) 0.219
severe 100 (19.0) 62 (24.1)
Fatal 69 (13.1) 35 (13.6)
clinical characteristic
Headache 160 (30.4) 96 (37.5) 0.062
Myalgia 105 (20.0) 61 (23.7) 0.228
conjunctival injection 484 (92.0) 185 (72.0) ,0.001 Maculopapular rash 485 (92.2) 187 (72.8) ,0.001
lymphadenopathy 373 (70.9) 154 (59.9) 0.003
eschar 290 (55.1) 41 (15.6) ,0.001
abdominal pain 178 (33.8) 65 (25.3) 0.017
nausea, vomiting 122 (23.2) 75 (29.2) 0.079
Diarrhea 102 (19.4) 38 (14.8) 0.136
Hepatomegaly 163 (31.0) 67 (26.1) 0.181
splenomegaly 53 (10.1) 20 (7.8) 0.360
Jaundice 49 (9.3) 20 (7.8) 0.506
seizure 26 (4.9) 15 (5.8) 0.611
stiff neck 14 (2.7) 17 (6.6) 0.011
crepitation 56 (10.7) 44 (17.1) 0.012
Wheezing 15 (2.9) 5 (2.0) 0.630
cough 169 (32.1) 88 (34.2) 0.571
Dyspnea 39 (7.4) 29 (11.3) 0.079
Respiration (/minute) (mean ± sD)
25.4±8.8 25.3±10.5 0.964
Pulse (/minute) (mean ± sD)
104.0±22.1 102.1±20.4 0.237
sBP (mmHg) (mean ± sD)
102.8±17.6 106±21.0 0.012
DBP (mmHg) (mean ± sD)
63.4±12.1 66.5±15.7 0.005
Body temperature (°c) (mean ± sD)
38.2±1.2 38.3±2.9 0.496
Abbreviations: DBP, diastolic blood pressure; sBP, systolic blood pressure; sD,
standard deviation.
Table 3 Laboratory test findings
Characteristics Development, n=526 (mean ± SD)
Validation, n=257 (mean ± SD)
P-value
Hematological
WBc (×103/mm3) 9.9±5.4 10.9±10.6 0.288
neutrophils (%) 70.2±17.1 71.3±15.8 0.387 lymphocytes (%) 21.1±14.6 20.1±13.6 0.525
Monocytes (%) 6.1±7.7 6.0±6.3 0.464
Platelets (×103/mm3) 133.1±107.8 167.2±127.5 ,0.001
Hematocrit (%) 35.2±6.2 36.5±6.3 0.498
Hemoglobin (g/dl) 11.8±2.1 12.1±2.2 0.156 Biochemistry
BUn (mg/dl) 27.6±26.7 26.7±26.4 0.681
creatinine (mg/dl) 1.7±1.9 1.8±2.1 0.431 Total bilirubin (mg/dl) 2.6±4.4 1.9±2.5 0.348 Direct bilirubin (mg/dl) 1.3±2.3 0.8±1.2 0.175
albumin (g/dl) 2.7±0.6 3.1±0.7 0.014
globulin (g/dl) 3.3±0.7 3.4±0.7 0.063
alT (iU/l) 125.2±259.7 143.1±505.3 ,0.001 asT (iU/l) 215.0±459.5 375.1±2,528.4 ,0.001 alP (iU/l) 251.3±193.5 201.5±164.6 ,0.001
na (mmol/l) 133.3±4.7 134.0±10.8 0.265
K (mmol/l) 3.6±0.6 3.8±2.1 0.028
cl2 (mmol/l) 100.7±5.6 101.4±6.0 0.163
cO2 (mmol/l) 21.2±4.7 21.8±5.2 0.121
Urine albumin (n [%])
,1+ 242 (54.6) 118 (51.5) 0.463
$1+ 201 (45.4) 111 (48.5)
Urine sugar (n [%])
,1+ 435 (98.2) 223 (97.4) 0.571
$1+ 8 (1.8) 6 (2.6)
Notes: The data were missing for some parameters: in the development set, urine
albumin and urine sugar =83 cases; in the validation set, asT =42 cases, albumin =68 cases, creatinine =48 cases, and urine albumin and urine sugar =28 cases.
Abbreviations: alP, alkaline phosphatase; alT, alanine aminotransferase; asT,
aspartate aminotransferase; BUn, blood urea nitrogen; cl2, chloride; cO2, carbon
dioxide; K, potassium; na, sodium; sD, standard deviation; WBc, white blood cell.
Table 4 score-classified scrub typhus severity levels in the development and validation datasets
Score-classified severity levels
Development
(n=526) Validation (n=167) P-value
Mean score ± sD 6.0±3.9 7.1±3.9 0.002
severity levels (n, %)
non-severe 278 (52.8) 64 (38.3) 0.004
severe 143 (27.2) 56 (35.5)
Fatal 105 (20.0) 47 (28.1)
Abbreviation: sD, standard deviation.
Results
Data for 257 patients comprised the validation dataset. Of those, 160 cases were defined as non-severe, 62 as severe, and 35 as fatal. The distribution of patients into the three severity groups of the development and the validation datasets was similar. The clinical characteristics of the patients were also
Risk Management and Healthcare Policy downloaded from https://www.dovepress.com/ by 118.70.13.36 on 27-Aug-2020
Dovepress
sriwongpan et al
similar except in terms of 1) sex, 2) symptoms or signs of con junctival injection, maculopapular rash, lymphadenopathy, eschar, abdominal pain, stiff neck, and crepitation, 3) vital signs of systolic blood pressure, and diastolic blood pressure (Table 2). The laboratory investigation data also showed simi-lar profiles for both datasets, except in terms of platelet count and AST, alanine aminotransferase, alkaline phosphatase, albumin, and potassium levels (Table 3).
The risk score was assigned to patients with six complete clinical parameters (n=167, 65%). The mean risk scores of patients in the validation data were different to those of patients in the development dataset (mean ± sd 7.1±3.9 and 6.0±3.9, respectively). The proportion of patients classified into the three severity levels was also different (P=0.004; Table 4).
In the validation dataset, the score correctly predicted 31.7% (53 out of 78) of patients into the non-severe group (score #5) with one-level underestimation of 6.6% (eleven patients) and no two-level underestimation, while 14.4% (24 out of 55) of patients were correctly classified into the severe group (score 6–9), with an underestimation of 5.4% (nine patients) and an overestimation of 13.8% (23 patients). Finally, for the fatal severity group (score $10), the score was predicted correctly for 14.9% (25 of 34) of patients, with one-level overestimation of 12.0% (20 patients) and two-level overestimation of 1.2% (2 patients), giving a total overestimation of 13.2% (Table 5).
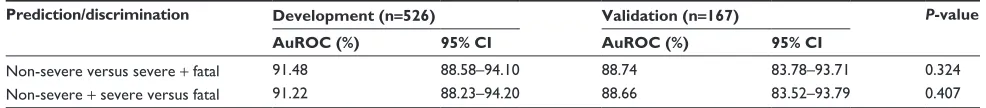
The overall predictive performance (as assessed by the AuROCs) of the validation dataset was insignificantly lower than that of the development dataset, both in the dis-crimination between non-severe versus (vs) severe and fatal
(AuROC =88.74% vs 91.48%, P=0.324) and between fatal versus non-severe and severe (AuROC =88.66% vs 91.22%,
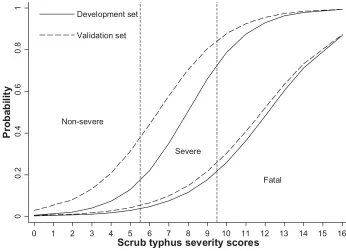
P=0.407; Table 6 and Figure 1).
Discussion
Validation is needed for any clinical prediction rules before they can be adopted in clinical practice, either internally or externally. The Mortality in Emergency Department Sepsis score, for example, was developed to evaluate the risk of death in patients in emergency departments, in which valida-tion in one-third of the sample yielded similar discriminavalida-tion (AuROC =0.82 vs 0.78).13 Further, a clinical prediction rule
for severe community-acquired pneumonia was devel-oped to screen patients for initial treatments in emergency departments. The rule performed similarly to the develop-ment data when prospectively validated in patients from the same hospitals (AuROC =0.92). However, the performance was poorer when externally validated in patients from other hospitals (AuROC =0.80).12 External validation of a
predic-tion rule for risk of mortality in Clostridium difficile infecpredic-tion also yielded poorer performance (AuROC =0.704 vs 0.653).14
It is very common for the performance of the validation data to be poorer than that of the development data.
Our clinical risk-scoring algorithm for severe scrub typhus was validated against patients admitted in only one hospital some years after the patients used in the development dataset. When only patients with complete information on the six predictors (n=167) were selected from the validation dataset, the performance of the algorithm was somewhat poorer than with the development data, both in terms of differentiating Table 5 Score-classified severity levels, criterion-classified severity levels, and risk estimation validity
Score-classified severity levels
Score range
Criterion-classified severity levels Risk estimation validity*
Non-severe, n=78 Severe, n=55 Fatal, n=34 Over (%) Correct (%) Under (%)
Mean ± sD 4.4±2.4 8.4±3.4 11.4±2.5
iQR 3–6 7–12 9–14
non-severe, n=64 #5 53 11 0 – 31.7 6.6
severe, n=56 6–9 23 24 9 13.8 14.4 5.4
Fatal, n=47 $10 2 20 25 13.2 14.9 –
Total 27.5 61.0 12.0
Note: *Percentage of total patients.
Abbreviations: iQR, interquartile range; sD, standard deviation.
Table 6 Discriminative performance of scrub typhus severity score in the development and validation datasets
Prediction/discrimination Development (n=526) Validation (n=167) P-value AuROC (%) 95% CI AuROC (%) 95% CI
non-severe versus severe + fatal 91.48 88.58–94.10 88.74 83.78–93.71 0.324
non-severe + severe versus fatal 91.22 88.23–94.20 88.66 83.52–93.79 0.407
Abbreviations: AuROC, area under the receiver-operating characteristic curve; CI, confidence interval.
Risk Management and Healthcare Policy downloaded from https://www.dovepress.com/ by 118.70.13.36 on 27-Aug-2020
Dovepress Validation of scrub typhus severity score
Non-severe
Severe
Fatal
0
0.2
0.4
0.6
0.8
1
P
ro
b
ab
ili
ty
0 1 2 3 4 5 6 7 8 9 10 11 12 13 14 15 16
Scrub typhus severity scores
Development set
Validation set
Figure 1 score-predicted probability of severity in the development data (solid lines) and the validation data (dashed lines).
Note: Vertical dotted lines represent score-derived criteria for classifying patients into non-severe, severe, and fatal groups.
non-severe from severe and fatal (AuROC =88.74% vs 91.48%), and fatal from non-severe and severe (AuROC
=88.66% vs 91.22%). However, these differences were not statistically or clinically significant. The overall proportion of correct classifications was somewhat lower (61.0% vs 68.3%), but overestimation was higher (27.0% vs 25.8%), which may be considered more beneficial to the patients.17
There were incomplete data on important predictors for 90 of 257 patients (35%). The missing data were AST (n=42, 24.1%), albumin (n=68, 26.5%), and creatinine (n=48, 18.7%). These patients were in the non-severe group, which did not require organ-specific investiga-tions. We did the sensitivity analysis by replacing the missing data by the mean values calculated from existing nonmissing data for each of the corresponding variables. When this was done, the discrimination between non-severe and severe and fatal was reduced (AuROC =84.41%) but was still considered excellent,19 while the discrimination
between fatal and non-severe and severe was unchanged. However, sensitivity analysis by multiple imputation of the missing data yielded almost identical performances (data not shown).
These sensitivity analyses imply that the derived risk-scoring algorithm might be successfully and safely applied to classify future patients, especially those with severe and fatal risk of scrub typhus. The score should help physicians in charge determine the need for further investigations
and start the necessary treatments for those at these risk levels.
The main advantage of the risk-scoring algorithm is that it requires routinely available patient information, comprising demographic, physical examination, and laboratory test data.17 In endemic areas with restricted
health resources,20–22 the score may help inform clinical
decision making with regard to both investigations and treatments.
In the present study, data on the validation patients were collected retrospectively and were based on provisional diag-nosis made as part of routine clinical practice, in which scrub typhus cases may reflect “suspected” rather than “confirmed” cases, by definition. Therefore, prospective validation to patients with a theoretically defined diagnosis of scrub typhus18 would
be helpful to confirm the algorithm’s feasibility for future use in routine practice.
Conclusion
A risk-scoring algorithm developed previously to classify scrub typhus patients into the three severity levels was validated using a different set of patients. The algorithm demonstrated good performance in this subsequent set of patients. The algorithm was clinically acceptable and could be applied in routine clinical practice to help identify patients with severe prognosis in order to judge the need for more intensive investigation and treatments.
Risk Management and Healthcare Policy downloaded from https://www.dovepress.com/ by 118.70.13.36 on 27-Aug-2020
Risk Management and Healthcare Policy
Publish your work in this journal
Submit your manuscript here: http://www.dovepress.com/risk-management-and-healthcare-policy-journal Risk Management and Healthcare Policy is an international,
peer-reviewed, open access journal focusing on all aspects of public health, policy, and preventative measures to promote good health and improve morbidity and mortality in the population. The journal welcomes submit-ted papers covering original research, basic science, clinical &
epidemio-logical studies, reviews and evaluations, guidelines, expert opinion and commentary, case reports and extended reports. The manuscript manage-ment system is completely online and includes a very quick and fair peer-review system, which is all easy to use. Visit http://www.dovepress.com/ testimonials.php to read real quotes from published authors.
Dovepress
Dove
press
sriwongpan et al
Acknowledgments
The authors wish to thank the authorities of Chiangrai Prachanukroh Hospital and Nakornping Hospital, Chiang Mai for their permission to collect data and wish to thank Chiang Mai University for its financial support.
Disclosure
The study was partially granted by the Faculty of Graduate, Chiang Mai University. The authors declare no other conflicts of interest in this work.
References
1. Lee N, Ip M, Wong B, et al. Risk factors associated with life-threatening rickettsial infections. Am J Trop Med Hyg. 2008;78(6):973–978. 2. Day NP, Newton P, Parola P, Raoult D. Scrub typhus and other tropical
rickettsioses. In: Cohen J, Powderly WG, Opal SM, editors. Infectious Diseases. 3rd ed. United States. Elsevier; 2010;2:1231–1237. 3. Kim DM, Kim SW, Choi SH, Yun NR. Clinical and laboratory findings
associated with severe scrub typhus. BMC Infect Dis. 2010;10:108. 4. Wu KM, Wu ZW, Peng GQ, Wu JL, Lee SY. Radiologic pulmonary
find-ings, clinical manifestations and serious complications in scrub typhus: experiences from a teaching hospital in eastern Taiwan. Int J Gerontol. 2009;3(4):223–232.
5. Lee CS, Hwang JH, Lee HB, Kwon KS. Risk factors leading to fatal outcome in scrub typhus patients. Am J Trop Med Hyg. 2009;81(3): 484–488.
6. Sriwongpan P, Krittigamas P, Kantipong P, Kunyanone N, Patumanond J, Namwongprom S. Clinical indicators for severe prognosis of scrub typhus. Risk Manag Healthc Policy. 2013;6:43–49.
7. Varghese GM, Abraham OC, Mathai D, et al. Scrub typhus among hospitalised patients with febrile illness in South India: magnitude and clinical predictors. J Infect. 2006;52(1):56–60.
8. Chanta C, Triratanapa K, Ratanasirichup P, Mahaprom W. Hepatic dysfunction in pediatric scrub typhus: role of liver function test in diag-nosis and marker of disease severity. J Med Assoc Thai. 2007;90(11): 2366–2369.
9. Thap LC, Supanaranond W, Treeprasertsuk S, Kitvatanachai S, Chinprasatsak S, Phonrat B. Septic shock secondary to scrub typhus: characteristics and complications. Southeast Asian J Trop Med Public Health. 2002;33(4):780–786.
10. Hu ML, Liu JW, Wu KL, et al. Short report: Abnormal liver function in scrub typhus. Am J Trop Med Hyg. 2005;73(4):667–668.
11. Lee CS, Min IS, Hwang JH, Kwon KS, Lee HB. Clinical significance of hypoalbuminemia in outcome of patients with scrub typhus. BMC Infect Dis. 2010;10(1):216.
12. España PP, Capelastegui A, Gorordo I, et al. Development and validation of a clinical prediction rule for severe community-acquired pneumonia. Am J Respir Crit Care Med. 2006;174(11):1249–1256. 13. Shapiro NI, Wolfe RE, Moore RB, Smith E, Burdick E, Bates DW.
Mortality in Emergency Department Sepsis (MEDS) score: a prospec-tively derived and validated clinical prediction rule. Crit Care Med. 2003;31(3):670–675.
14. Butt E, Foster JA, Keedwell E, et al. Derivation and validation of a simple, accurate and robust prediction rule for risk of mortality in patients with Clostridium difficile infection. BMC Infect Dis. 2013; 13(1):316.
15. Tanner L, Schreiber M, Low JG, et al. Decision tree algorithms predict the diagnosis and outcome of dengue fever in the early phase of illness. PLoS Negl Trop Dis. 2008;2(3):e196.
16. Lee VJ, Lye DC, Sun Y, Leo YS. Decision tree algorithm in deciding hospitalization for adult patients with dengue haemorrhagic fever in Singapore. Trop Med Int Health. 2009;14(9):1154–1159.
17. Sriwongpan P, Krittigamas P, Tantipong H, Patumanond J, Tawichasri C, Namwongprom S. Clinical risk scoring algorithm to forecast scrub typhus severity. Risk Manag Healthc Policy. 2014;7:11–17.
18. World Health Organization (WHO). WHO Recommended Surveillance Standards. 2nd ed. WHO/CDS/CSR/ISR/99.2. Geneva: WHO; nd. Available from: http://www.who.int/csr/resources/publications/ surveillance/whocdscsrisr992.pdf. Accessed October 5, 2011. 19. Hosmer DW Jr, Lemeshow S, Sturdivant RX. Applied Logistic
Regression. 3rd ed. New York, NY: Willey; 2013.
20. Abrahamsen SK, Haugen CN, Rupali P, et al. Fever in the tropics: aetiology and case-fatality – a prospective observational study in a tertiary care hospital in South India. BMC Infect Dis. 2013;30(13): 355.
21. Lee JH, Chung KM, Kim ES, et al. Dynamics of clinical symptoms in patients with scrub typhus. Jpn J Infect Dis. 2013;66(2):155–157. 22. Vikrant S, Dheer SK, Parashar A, et al. Scrub typhus associated acute
kidney injury – a study from a tertiary care hospital from western Himalayan state of India. Ren Fail. 2013;35(10):1338–1343.
Risk Management and Healthcare Policy downloaded from https://www.dovepress.com/ by 118.70.13.36 on 27-Aug-2020