Digital Holographic Method for Piezoelectric Transformers Vibration
Analysis
Pavel Psota1,2, Václav Kopecký1, Vít Lédl1,2, Roman Doleček1,2
1Faculty of Mechatronics, Technical University of Liberec, Studentská 2, 46117 Liberec, Czech Republic 2TOPTEC, Institute of Plasma Physics ASCR, Sobotecká 1660, 51101 Turnov, Czech Republic
Abstract.The paper describes a holographic method for vibration analysis in nanometer range. The method was successfully applied on different types of piezoelectric transformers and the measurement results are introduced. To proof the reliability of the method it was done a comparing simultaneous measurement of a piezoelectric component by the holographic method and the well-established single-point interferometric method. Results showing the minimal deviation of both methods are presented in the final part of the paper.
1 Introduction
A piezoelectric transformer (PT) is a device used for the transformation of alternating electric voltage by the means of ultrasonic vibrations. It utilizes converse piezoelectric effect in the input part and direct piezoelectric effect in the output part. The best transformation ratio is achieved at the mechanical vibration resonance. The measurement of out-of-plane displacement as well as the shapes of transformer vibration modes near resonant frequencies provides useful data, applicable in theoretical research of piezoelectric transformers behavior as well as in practical applications. A typical example is an effect of a transformer’s properties as a function of its mechanical mounting.
PTs are used e.g. for Cold cathode fluorescent lamp electronics, high voltage generator for cold plasma, mobile phone battery recharging etc. High transformation ratio at no-load conditions is a specific feature of the PT's operation. PT applications are complex, including specific transformer mounting, wiring and driving circuit electronics. The out-of-plane displacement method is used for the PT vibration mode visualization. Studied PT's vibrate in planar modes. In-plane displacements must be re-calculated using finite element simulations.
On the market, there is a broad portfolio of measurement devices, which are usually based on
the Doppler phenomenon, correlation analysis, ESPI (Electronic Speckle Pattern Interferometry) and others. Another physical principle suited for vibration analysis is digital holography (DH) [1, 2]. The DH based methods are non-invasive, very precise and, in addition, DH enables displacement measurement over the whole-field.
The most common holographic method for vibration analysis is time average holographic interferometry, which was introduced by Powell and Stetson [3]. Unfortunately, for amplitudes smaller than approximately one tenth of the wavelength of the laser light used, the time-average method reaches its limit of minimum measurable amplitude. This problem was solved by frequency shifted holographic interferometry introduced by Aleksoff [4].
Typical analogue recording media, which was used in the past in holography, did not have uniform and repeatable response. Therefore it was impossible to determine quantitative values of amplitude precisely by the frequency shifted holographic interferometry method. The measurement usually served for estimation of vibration amplitudes and for mode structure determination.
a powerful tool for vibration analysis in whole spectrum of measured amplitudes. However, the fringe procedure was still used [5, 6]. Nevertheless, modern digital cameras provide the advantage of very uniform and repeatable response, and they can be considered as a radiometric detector. Vikram took this advantage and theoretically showed how to generally avoid fringe procedure with use of three digital holograms with different frequency modulations [7]. This fact also led to development of digital holographic method suitable for measurement of very small amplitudes which enables to determine quantitative values of amplitude precisely with use of only two digital hologram sequences [8]. The method is based on the application of frequency shifted digital holography with the employment of phase shifting principles. Phase shifting reduces the noise rapidly. In [8] authors introduced the basic principle and potentials of the method and the application, testing and analysis are presented in this paper. This method was successfully used for measurement of ring and disc piezoelectric transformers. The reliability of the method was tested by simultaneous measurement of uni-morph membrane for different excitation voltages by the holographic method and a single-point laser Michelson interferometer [9].
2 The digital holographic method
2.1 Basics of digital holography
Digital holography is whole-field and noninvasive technique with widespread applications in industry and research. Digital holography consists of two steps: the recording of the digital hologram and its reconstruction. A digital hologram is realized if the interference pattern of a reference wave and the wave reflected from the object are recorded by a digital recording medium (CCD or CMOS sensor). The resulting hologram is electronically recorded and stored. Let the diffusely reflecting object be located at a distance d far from the CCD. For digital reconstruction the recorded hologram
h
( ,
)
is multiplied with a numerical model of the reference waver
( ,
)
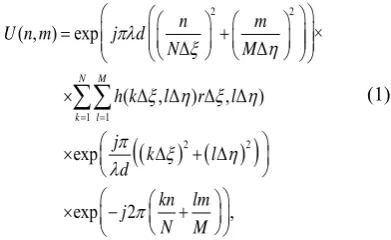
. The field in the image plane U is calculated by the Sommerfeld formula which describes the diffraction of a light wave at the hologram in distance d from the hologram. The Sommerfeld integral can be solved by the Fresnel approximation which in discrete finite form can be written as:
2 2 1 1 2 2( , ) exp ×
Δ Δ
( Δ , Δ ) Δ , Δ ) exp
exp 2 ,
N M
k l
n m
U n m j d
N M
h k l r l
j k l d kn lm j N M
(1) (1) where j 1and λ is the wavelength of the light.The stored hologram consists of N × M discrete values. The physical pixel size of CCD is
and the pixel spacing in the reconstructed image isx
y
. Equation (1) can be solved effectively by the FFT-algorithm. Intensity distribution I and phase distribution φ are then determined by2
( , )
( , ) ,
I n m
U n m
(2)
( , ) arctan Im( ( , )) / Re( ( , )) ,n m U n m U n m
where Re denotes their real part and Im denotes their imaginary part. Although the direct approach to phase distribution is a big benefit of digital holography, for vibration analysis, only the intensity field is considered.
2.2 Principle of the method
The experimentally easiest and the most often applied holographic method for vibration analysis is time average holographic interferometry. Let us consider a harmonically oscillating, diffusely reflecting object in position p:
d p t
( , )
d(p)
sin
t
where ω is the circular frequency and d(p) is the amplitude of vibration and such an oscillating object is recorded holographically using an exposure time much longer when compared to the period of the vibration of the object
T
2 /
, then the resulting intensity in the reconstructed image at position p is:2 0
( ) J ( ).
I p d(p)e(p) (3)
In (3) the sensitivity vector e(p)is given by the geometry of the holographic arrangement and J0 is
between these zeros, which do not correspond to nodal lines, exhibit less intensity compared to the zero fringe. Thus, the nodal lines can usually be identified. The simplest example is an out-of-plane vibrating surface and a holographic arrangement with illumination and observation, normal to the surface. If each point can be assumed to oscillate only in the normal direction to the surface
(0,0, ( ))
d
Zp
d(p)
, thene(p)
4 /
and the amplitudes at the centers of dark fringes are easily calculated byd
Z( )
p
b
m
/ 4
, where bm is them-th zero of J0, and λ is wavelength of the laser light
used.
Unfortunately, for amplitudes smaller than approximately one tenth of the wavelength of the laser light used, the time-average method reaches its limit of minimum measurable amplitude. This problem was solved by frequency shifted holographic interferometry. In frequency shifted holography the frequency of the reference wave is modulated by an integer multiple nω of the object vibration frequency ω: ( ) jn t
ref
f t e . If the object
wave UP is not modulated and the reference wave
UR is modulated by
f
ref , the resulting intensity inthe hologram plane at time t is proportional to: 2
( ) P ref( ) R
I t U f t U . Using the solution of
interference holographic equation and properties of Bessel functions we obtain:
2 2
n
( ) Jn J ( ).
I p U d(p)e(p) (4)
Frequency shifted holography is used to increase sensitivity for vibrations with small as well as large amplitudes. For measurement of small amplitudes, the first order of Bessel function J1 should be used. In time average holography with no modulation,
2 0
J in the neighborhood of zero corresponding to small amplitudes d is unity and has slope of zero
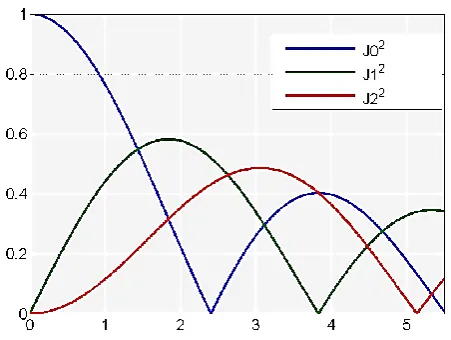
(the derivate is constant). Therefore for small amplitudes, it is difficult to determine significant intensity variation in the bright field, see figure 1. On the other hand, 2
1
J in the neighborhood of zero has a positive and steep slope in the dark field yielding visible intensity variations even for small amplitudes. The slope of the higher orders (e.g. J22) of the Bessel function is positive but not so steep. This is key to the method. The smallest detectable amplitude was estimated by Ueda, Miida and Sato [10] as
d p
( )
/3500
.Fig. 1. J02, J12and J22 Bessel functions.
2.3 Holographic setup
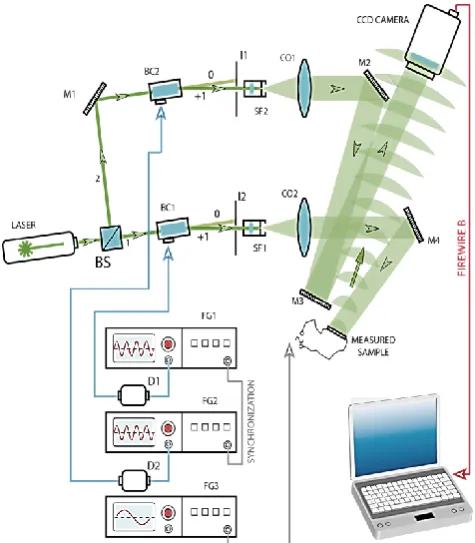
Fig. 2. The measurement setup: BS – beam splitter, SF – spatial filter, BC – Bragg cell, M – mirror, CO – collimating objective, FG – function generator, D – driver.
2.4 Data evaluation
The method for piezoelectric transformer measurement is based on the application of frequency shifted digital holography with the employment of phase shifting principles [8]. Frequencies of Bragg cells are chosen to fulfil the equation
2 1
/ ,
B B
CM
(5)where is the frequency of the object vibration
C is the camera’s frame frequency and M is number of frames used in heterodyne detection. This way, a sequence of M phase shifted digital holograms is recorded and processed by formula1 2 / 0
1/
M m Mm m
h
M
h e
(6)to get a filtered digital hologram h. Afterwards, the processed hologram is reconstructed using Fresnel transform (1) and the intensity distribution is calculated with use of formula (2). The interferogram reconstructed from the processed hologram h has a much higher signal to noise ratio and strongly suppressed DC term compared to the interferogram reconstructed from a single hologram. To suppress speckle noise in interferograms generated by coherent illumination, some advanced filtering methods can be used [11]. Low overall noise is a key factor to get the very high resolution of this method. Since the reflectance of the piezoelectric transformer is not uniform along the entire surface, the reference interferogram with no frequency shift of the reference
wave in a steady state must also be recorded. Such an interferogram represents the J0 intensity distribution of the steady state. The reference interferogram UJ0 is used to normalize the interferogram UJ1, reconstructed from the digital hologram with a frequency shifted reference wave:
U
J norm1
U
J1/
U
J0. A necessary condition for normalization is uniform response of the recording medium during the entire recording. Modern digital cameras meet these requirements. On the other hand, typical analogue recording media, being used in past in holography, do not have this property and therefore are not suitable for this method. After the normalization operation, we get a normalized version of (4):1
( ) J (
1)
J norm
U
p
d(p)e(p)
. In our experimental setupthe sensitivity vector is approximately perpendicular to the CCD target and its magnitude is e(p) 4 /
. Therefore the out-of-plane vibration amplitude dZ in every surface point p can be directly calculated by the inversion of the first monotonic interval of:1
( )
1(4
( )/ )
J norm Z
U
p
J
d
p
(7)For the inverse transfer function, it is necessary to determine the out-of-plane vibrations amplitude corresponding to J1MAX. The normalization of UJ1 permits
us to use well defined relations between J0 and J1 functions:
J
1MAX
0.582 (0)
J
0 andJ
1MAX
J
1(1.84)
(8)Thus we can derive the maximum amplitude:
1.84 / 4
Md
. For our experiment, the maximum amplitude isd
M
77,8968
nm and the transfer function is displayed in figure 3. This maximum amplitude dM is also the limiting value for the maximalmeasured amplitude by this method, without the risk of ambiguities. For greater amplitudes, standard time average digital holography, represented by the J0 function, serves perfectly.
Fig. 3. The transfer function for the calculation of amplitudes.
3
Measurement result
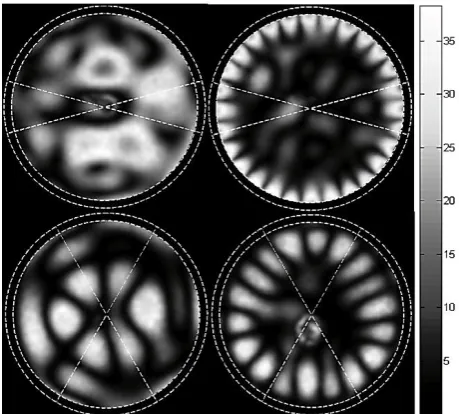
Sdesigned in 4-segments shapes with different wedge angles. The PTs were placed in a manufactured holder. The disc was pushed by a spring from the back-side to ensure that the pressure would be approximately identical during all measurements. The PTs were driven by a voltage of 30 Vpp. Some results of disc PT measurement are shown in figure 4. The intensity of pseudo-color image corresponds to the amplitude of the vibration according to the color-bar on the right-hand side. The dark black lines can be considered as nodal lines where the vibration amplitude is zero. Since the measurement method is based on modified time average holography, displacement magnitude of an oscillation from an equilibrium position is measured and it is not possible to measure the phase of vibrations.
Fig. 4. The out-of-plane displacement (all units of
amplitudes are in nanometers) of disc piezoelectric transformers with 4-segment electrodes shape. The 30° wedge 4-segment electrodes shape PT for resonant frequencies 118.70 kHz (left) and 251.55 kHz (right) driven by 30Vpp. The 4-segement 120° electrodes shape PT for resonant frequencies 140.65 kHz (left) and 249.70 kHz (right) driven by 30Vpp. Total transformer diameter is 20 mm, dashed white lines represent position of borderlines between electrode segments.
The reliability of this method was tested by the simultaneous measurement of the uni-morph membrane for different excitation voltages by the holographic method and using a single-point laser Michelson interferometer [9,12]. With the use of a lock-in amplifier technique, the Michelson interferometer enables us to measure amplitudes in the order of 10-12m. In part, we wanted to compare the amplitude values of a measurement point obtained by these methods, while, on the other hand, to confirm our prediction that the method is linear. Although the holographic method is a whole-field
method, whereas laser interferometry can measure amplitude in single point only, it was necessary to consider holographic data only for the area of interest. The results are plotted in figure 5 and figure 6. It seems the measurement error increases with smaller vibration amplitude. However, it can be seen that the estimated relative difference is fewer than 10%. The reliability of the holographic method for measurement of extremely small amplitudes (sub-nanometers) is under investigation now.
Fig. 5. Simultaneous amplitude measurement by
holographic (full line) and interferometric (dashed line) method for different excitation voltages (left).
Fig. 6.The relative percentage deviation of holographic
method from the interferometric method.
4 Conclusion
allowed measurement of the vibration of piezoelectric transformers in nanometer and sub-nanometer scale in the whole area. The measurement was done for resonant frequencies of ring and disc transformers driven by various voltage amplitudes. Moreover, the results of this developed method were compared to the measurement results of a single-point Michelson interferometer. It was demonstrated that this method is linear and reliable in the whole measurement range. The estimated measurement error of the method was estimated to 0.1nm.
Acknowledgements
This work was supported by the Student grant scheme at the Technical University of Liberec and by the European Regional Development Fund and the Ministry of Education, Youth and Sports of the Czech Republic in the Project No. CZ.1.05/2.1.00/03.0079: Research Center for Special Optics and Optoelectronic Systems (TOPTEC).
References
1. T. Kreis, Handbook of Holographic Interferometry, (2004).
2. R.L. Powell and K.A. Stetson, J. Opt. Soc. Am. 55, 1593–1598 (1965).
3. C. C. Aleksoff, Appl. Opt. 10, 1329-1341 (1971). 4. Y. Ishii, Optics and Lasers in Engineering, 36,
(2001).
5. F. Joud, F. Laloë, M. Atlan, J. Hare, and M. Gross, Optics express, 17,2774–2779 (2009).
6. Ch. Vikram, Journal of Modern Optics, 39, (1992) 7. V. Lédl, J. Václavík, R. Doleček and V. Kopecký,
AIP Conf. Proc. 1253, (2010).