fi
fi
Pressure and High Adult Arterial Stiffness
WHAT’S KNOWN ON THIS SUBJECT:Elevated blood pressure (BP) has long-term influence on the atherosclerotic process. The relative predictive ability of the standard BP definition endorsed by the National High Blood Pressure Education Program and the recently proposed 2 simplified definitions has not been studied.
WHAT THIS STUDY ADDS: Simplified pediatric BP tables predict risk of high adult arterial stiffness as well as the complex table does. These simple screening tools could be used for identifying pediatric subjects at risk and for intervening to improve adult cardiovascular outcomes.
abstract
OBJECTIVE:The ability of childhood elevated blood pressure (BP) to predict high pulse wave velocity (PWV), a surrogate marker for car-diovascular disease, in adulthood has not been reported. We studied whether elevated pediatric BP could predict high PWV in adulthood and if there is a difference in the predictive ability between the standard BP definition endorsed by the National High Blood Pressure Education Program and the recently proposed 2 simplified definitions.
METHODS:The sample comprised 1241 subjects from the Cardiovas-cular Risk in Young Finns Study followed-up 27 years since baseline (1980, aged 6–15 years). Arterial PWV was measured in 2007 by whole-body impedance cardiography.
RESULTS:The relative risk for high PWV was 1.5 using the simple 1 (age-specific) definition, 1.6 using the simple 2 (age- and gender-specific) definition, and 1.7 using the complex (age-, gender-, and height-specific) definition (95% confidence interval: 1.1–2.0,P= .007; 1.2–2.2, P= .001; and 1.2–2.2, P= .001, respectively). Predictions of high PWV were equivalent for the simple 1 or simple 2 versus complex definition (P= .25 andP= .68 for area under the curve comparisons, P= .13 andP= .35 for net reclassification indexes, respectively).
CONCLUSIONS:Our results support the previousfinding that elevated BP tracks from childhood to adulthood and accelerates the atheroscle-rotic process. The simplified BP tables could be used to identify pedi-atric patients at increased risk of high arterial stiffness in adulthood and hence to improve the primary prevention of cardiovascular dis-eases.Pediatrics2013;132:e70–e76
AUTHORS:Heikki Aatola, MD,aCostan G. Magnussen, PhD,b,c
Teemu Koivistoinen, MD, MSc,aNina Hutri-Kähönen, MD,
PhD,dMarkus Juonala, MD, PhD,b,eJorma S.A. Viikari, MD,
PhD,eTerho Lehtimäki, MD, PhD,fOlli T. Raitakari, MD, PhD,b,g
and Mika Kähönen, MD, PhDa
Departments ofaClinical Physiology,dPediatrics, andfClinical Chemistry, Fimlab Laboratories, University of Tampere and Tampere University Hospital, Tampere, Finland; Departments of
eMedicine, andgClinical Physiology and Nuclear Medicine, and thebResearch Centre of Applied and Preventive Cardiovascular
Medicine, University of Turku and Turku University Hospital, Turku, Finland; andcMenzies Research Institute Tasmania, University of Tasmania, Tasmania, Australia
KEY WORDS
blood pressure, pediatrics, prehypertension, screening, stiffness
ABBREVIATIONS
AUC—area under receiver-operating characteristic curve BP—blood pressure
CVD—cardiovascular diseases
NHBPEP—National High Blood Pressure Education Program NPV—negative predictive value
NRI—net reclassification improvement PPV—positive predictive value PWV—pulse wave velocity
Dr Aatola analyzed and interpreted the data, performed statistical analysis, and drafted the initial manuscript; Dr Magnussen analyzed and interpreted the data, performed statistical analysis, and critically reviewed and revised the manuscript; Dr Koivistoinen analyzed and interpreted the data, and reviewed and revised the manuscript; Drs Hutri-Kähönen, Viikari, and Lehtimäki acquired the data, handled funding and supervision, and reviewed and revised the manuscript; Dr Juonala acquired the data, analyzed and interpreted the data, and critically reviewed and revised the manuscript; Dr Raitakari conceived and designed the research, acquired the data, handled funding and supervision, and critically reviewed and revised the manuscrip; Dr Kähönen conceived and designed the research, acquired the data, analyzed and interpreted the data, handled funding and supervision, and critically reviewed and revised the manuscript; and all authors approved thefinal manuscript as submitted.
www.pediatrics.org/cgi/doi/10.1542/peds.2012-3426 doi:10.1542/peds.2012-3426
Accepted for publication Mar 12, 2013
Address correspondence to Mika Kähönen, MD, PhD, Tampere University Hospital, Department of Clinical Physiology, PO Box 2000, FI-33521 Tampere, Finland. E-mail: mika.kahonen@uta.fi PEDIATRICS (ISSN Numbers: Print, 0031-4005; Online, 1098-4275). Copyright © 2013 by the American Academy of Pediatrics
Previous reports have shown that the atherosclerotic process begins in youth, and elevated blood pressure (BP) accelerates it.1–4 Because of the epi-demic of overweight and obesity in youth, the prevalence of hypertension is increasing.5,6 Early modification of risk factors, especially elevated BP and obesity, to prevent the progression of atherosclerosis is among the major contemporary challenges in the pri-mary prevention of cardiovascular diseases (CVD).
Previous studies have shown that BP tracks from childhood to adulthood, and subjects having elevated BP in childhood and adolescence are at in-creased risk of developing hyper-tension in adulthood.7–9 These data indicate that elevated BP is established early in life, hence the prehypertension and hypertension are able to be iden-tified already in youth, underlying the potential to reduce risks and optimize health outcomes as they relate to hy-pertensive diseases.
In the most recent guidelines issued by the National High Blood Pressure Edu-cation Program (NHBPEP), BP screening was recommended at all pediatric visits for health care from age 3 years.10The NHBPEP guidelines provide decision-based cut-points to allow clinicians and pediatric health providers to de-fine youth as normal, prehypertensive (formerly high normal,.90th percen-tile) and hypertensive (.95th percen-tile), according to age, gender, and height percentiles. Considering there are 7 height percentiles, 2 measures (systolic and diastolic BP), and 17 age groups (1–17 years) for boys and girls, the NHBPEP tables contain 476 thresh-old values for the definition of pediatric prehypertension alone, the same amount for definition of pediatric hy-pertension. This complex definition could at least partly explain the poor diagnosis of prehypertension and hy-pertension in children and adolescents
reported previously.11,12 As a solution for this problem, Kaelber and Pickett13 and Mitchell et al12recently proposed new screening tables. Kaelber and Pickett reduced the number of thresh-old values to 64 (2 measures and 16 age groups for boys and girls) by omitting height percentiles and sepa-rate cut-points to denote hyperten-sion.13Mitchell et al introduced a table with only 10 threshold values (2 measures and 5 age groups in incre-ments of 3 years).12Those values were near the lowest prehypertensive BP value in the NHBPEP table and were set to end in either 0 or 5. Both these simplified tables are proposed to use as a screening tool, which can more quickly and easily be used to identify pediatric patients whose BP levels need additional evaluation.
Arterial stiffness is a surrogate marker for CVD and, assessed as pulse wave velocity (PWV), is generally ac-cepted as an independent predictor of cardiovascular events and all-cause mortality.14,15 Increased PWV was also added to the list of markers of subclinical organ damage and prog-nostic factors in the European guide-lines for management of arterial hypertension.16 We and others have shown that childhood systolic BP is an independent predictor of PWV in adulthood.17–19
These previously mentioned findings strengthen the hypothesis that elevated pediatric BP accelerates the arterial stiffening and atherosclerotic process. However, to the best of our knowledge, no information has been published concerning the ability of the childhood elevated BP definitions to predict ar-terial stiffness in adulthood. Therefore, the aim of the current study was to evaluate and compare the utility of these 3 definitions to predict high adult PWV using participants of the pro-spective Cardiovascular Risk in Young Finns Study.
METHODS
Subjects
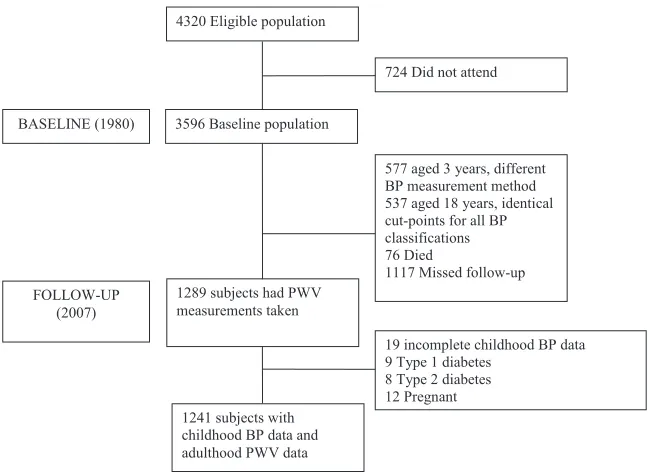
The Cardiovascular Risk in Young Finns Study is an ongoing multicenter follow-up study of atherosclerosis precursors in Finnish children and adolescents. The first cross-sectional study was conducted in 1980 for 3596 subjects aged 3 to 18 years.20 They were randomly selected from the Finnish national population register. Although data were available for participants aged 3 years in 1980 (n= 577), they were not included in the analyses because BP measures were collected using an ultrasound device. Measures from youth aged 18 years (n= 537) were not included in the analyses because the cut-points are identical for all 3 definitions. In 2007, 1289 subjects had PWV measurements taken. The sub-jects with incomplete childhood data (n= 19), subjects with type 1 (n= 9) or type 2 (n= 8) diabetes, and female patients who were pregnant (n= 12) were excluded. Therefore, 1241 subjects were included in the analysis. Studyflowchart is shown in Fig 1. We repeated the analysis after excluding participants taking lipid-lowering (n = 24) or antihypertensive medications (n = 76), with essentially similar results. All subjects gave written informed consent, and the study was approved by local ethics committees.
Clinical Measurements
used in the analyses because in 1980 in all age groups, diastolic BP was better achieved with Korotkoff’sfifth phase (no missing values in this study population) than Korotkoff’s fourth phase (absent in 2.5% of subjects). This was consistent with results reported previously by Uhari et al21Readings to the nearest in-teger of millimeters of mercury were performed 3 times on each participant. The mean of these 3 measurements was used in the analyses.
Definition of Elevated BP Levels in Childhood
Simple 1 Definition
Participants were defined according to age-specific (increments of 3 years) cut-points proposed by Mitchell et al.12The cut-points are near the lowest pre-hypertensive ($90th percentile) BP value in the NHBPEP tables and are set to end in 0 or 5.
Simple 2 Definition
Participants were defined according to age- and gender-specific BP cut-points
proposed by Kaelber and Pickett.13 The cut-points correspond to the lower limit of height (5th percentile) in the prehypertensive BP range ($90th per-centile) for a given age and gender in the NHBPEP tables.
Complex Definition
Participants were defined according to age, gender, and height percentiles for prehypertensive youth BP issued by the NHBPEP.10
Arterial PWV Studies
We used a whole-body impedance car-diography device (CircMon, JR Medical Ltd, Saku Vald, Estonia) to determine PWV. CircMon includes a whole-body impedance cardiography channel, dis-tal impedance plethysmogram channel, and an electrocardiogram channel. When the pulse pressure wave enters the aortic arch and the diameter of the aorta changes, the whole-body im-pedance decreases. The CircMon soft-ware measures the time difference between the onset of the decrease in
gram signal from a popliteal artery at knee joint level. The measurement is triggered by the R wave of the elec-trocardiogram. The PWV can be de-termined from the distance and the time difference between the 2 recording sites. The repeatability index and the reproducibility index were good (99% and 87%, respectively).22 A detailed description of the method,17,23the val-idation study,23and reference values24 have been reported previously. High PWV was defined as values at or above the age-, gender-, and heart-rate-specific 80th percentile.
Statistical Methods
The comparisons between study par-ticipants and nonparpar-ticipants (subjects lost to follow-up or excluded) were performed with the use of age- and gender-adjusted regression analysis for continuous variables, thex2test for categorical variables and the t test to examine differences in age. Age- and gender-adjusted logistic regression was used to estimate relative risks and 95% confidence intervals of adult high PWV according to the 3 definitions for elevated pediatric BP.
The ability of each definition to predict high adult PWV was assessed using sensitivity, specificity, positive pre-dictive value (PPV), negative prepre-dictive value (NPV), area under receiver-operating characteristic curves (AUC), and estimates of risk reclassification; statistics that are in line with criteria put forward by the American Heart Association.25Sensitivity was calculat-ed as true-positives/(true-positives + false-negatives) 3 100; specificity as true-negatives/(true-negatives + false-positives) 3 100; NPV as true-negatives/(true-negatives + false-negatives) 3 100; and PPV as true-positives/(true-positives + false-positives)3100. AUC was determined FIGURE 1
from the logistic model and represents an estimate of the probability that the model assigns a higher risk to those who have the outcome (high PWV) compared with those who do not have the outcome. Differences in AUC between the simpli-fied and complex definitions were esti-mated using the DeLong algorithm.26Net reclassification improvement (NRI) was also calculated to determine the extent to which the complex (vs simple 1 or simple 2) definition reassigned partic-ipants to a risk status that better reflected their final outcome (case or control).27,28 The proportions of partic-ipants reclassified to either higher- or lower-risk categories are presented. Risk classification is improved if an in-dividual with the outcome in adulthood (case) is placed in a higher risk category in youth or if an individual without the outcome in adulthood (control) is moved to a lower risk category in youth. The NRI is the sum of improvements in the reclassification of both case and control participants.
Analyses were performed with the SPSS for Windows (Release 20.0.0, SPSS Inc, IBM Corporation, Armonk, NY) and Stata (Release 10, StataCorp LP, College Sta-tion, TX). Statistical significance was inferred at a 2-tailedPvalue,.05.
RESULTS
The baseline (1980) characteristics of study participants (n = 1241) and nonparticipants (n= 1241) are shown in Table 1. There were more boys among nonparticipants (P , .0001), and they were slightly younger (P = .01). There was no difference in height, systolic BP, or diastolic BP. The preva-lence of elevated BP in childhood was the same in the both groups according to the simple 1, simple 2, and complex definition (P= .10,P= .11, andP= .33, respectively).
Table 2 shows the characteristics of study participants in baseline and follow-up by PWV status in adulthood.
There was no difference in gender, age, or height between low- and high-PWV groups in the baseline. Those having high adult PWV had higher systolic and diastolic BP values (P= .02 andP= .004, respectively) and higher prevalence of elevated BP in childhood according to the simple 1, simple 2, and complex BP definition (P= .007,P= .001, andP= .0005, respectively). In the follow-up the BP differences were more evident, and the absolute differences in the prevalence
of elevated BP (23.1% vs 48.6%, P, .0001) and in PWV (7.7 m/s vs 9.9 m/s, P,.0001) were remarkable.
Subjects having elevated BP in child-hood were at increased risk of high PWV in adulthood (Table 3). The magnitude of risk was similar according to the simple 1, simple 2, or complex BP def-inition (50%,P= .007, 60%,P= .001, and 70%,P= .001, respectively).
Prediction of high adult PWV by the simplified definitions was equal with the TABLE 1 Baseline Characteristics of Study Participants and Nonparticipants (Subjects Missed
Follow-up or Excluded) in 1980
Variable Participants Nonparticipants PValue
No. of subjects 1241 1241
Gender, female,n 687 (55.4) 583 (47.0) ,.0001
Age, y 10.763.3 10.463.2 .01
Height, cm 145619 143619 .59
Systolic BP, mm Hg 112610 112611 .07
Diastolic BP, mm Hg 6869 6869 .07
Prevalence of elevated BP, simple 1 definition (age),n
669 (53.9) 710 (57.2) .10
Prevalence of elevated BP, simple 2 definition (age and gender),n
717 (57.8) 756 (60.9) .11
Prevalence of elevated BP, complex definition (age, gender, and height percentile),n
536 (43.2) 560 (45.1) .33
Values are mean6SD orn(%). Comparison between participants and nonparticipants were performed using age- and gender-adjusted regression analysis for continuous variables,x2tests for categorical variables, andttest to examine
differences in age
TABLE 2 Baseline (1980) and Follow-up (2007) Characteristics of Study Subjects by PWV Status in Adulthood
Variable Low PWV High PWV PValue
No of subjects 994 247
Gender, female,n 554 (55.3) 137 (55.5) .97 1980
Age, y 10.763.3 10.763.3 .87
Height, cm 145619 145619 .55
Systolic BP, mm Hg 112610 113611 .02
Diastolic BP, mm Hg 6769 69610 .004
Prevalence of elevated BP, simple 1 definition (age),n 517 (52.0) 152 (61.5) .007 Prevalence of elevated BP, simple 2 definition
(age and gender),n
552 (55.5) 165 (66.8) .001
Prevalence of elevated BP, complex definition (age, sex and height percentile), n
405 (40.7) 131 (53.0) .0005
2007
Age, y 37.763.3 37.763.3 .87
Height, cm 172619 17269 .37
Systolic BP, mm Hg 118613 128614 ,.0001 Diastolic BP, mm Hg 74611 81611 ,.0001 Prevalence of elevated BP,na 230 (23.1) 120 (48.6) ,.0001
PWV, m/s 7.761.1 9.961.4 ,.0001
Low PWV was defined as values below the age-, gender-, and heart-rate-specific 80th percentile. High PWV was defined as values at or above the age-, gender-, and heart-rate-specific 80th percentile. Values are mean6SD orn(%). Comparison between groups were performed using age- and gender-adjusted regression analysis for continuous variables,x2tests for
categorical variables, andttest to examine differences in age
aClassified as systolic BP$130 mm Hg and/or diastolic blood pressure$85 mm Hg
were significantly different between the simple 1 and complex definition (P= .25 andP= .13, respectively) or between the simple 2 and complex definition (P= .68 andP= .35, respectively). The simple 1 and simple 2 definitions had higher sensitivity than complex definition (61.5, 66.8, and 53.0, respectively) but lower specificity (48.0, 44.5, and 59.3, re-spectively). All definitions had high NPV (83.4, 84.4, and 83.5, respectively).
Sensitivity Analyses
To test the robustness of ourfindings, we performed analyses using other standardized cut-points corresponding to the 70th, 75th, 85th, and 90th per-centiles of PWV with essentially similar results (Supplemental Tables 5 and 6). We made also 2 additional subgroup analyses. First, we studied age and gender differences in 2 age groups and used 9 years of age as a cut-point. This cut-point was chosen because Juonala et al reported that risk factor mea-surements obtained at or after 9 years of age were predictive of subclinical atherosclerosis in adulthood in this cohort.29All 3 definitions made equal predictions for high PWV for older girls and boys, except the simple 1 definition
statistically significant which at least partly can be explained by small group sizes (170 girls and 114 boys). Second, we used age- and gender-specific 85th percentile for BMI in 1980 as a cut-point to define subjects as normal weight or overweight. All 3 definitions made equal predictions for high PWV (1.8–2.1) for overweight subjects (Supplemental Ta-ble 8). These predictions were not sta-tistically significant, possibly because of small group size (N= 185).
DISCUSSION
This study shows that elevated pediatric BP predicts increased PWV in adulthood. We also observed that 2 simplified def-initions12,13 for elevated pediatric BP predict high adult PWV equivalent to the more complex definition currently en-dorsed by the NHBPEP.10Thisfinding is clinically meaningful because both these simplified tables could be more easily implemented as a screening tool in pediatric health care settings and outside of a physician’s office when the height percentile required for the com-plex definition may not be obtainable.
We found also that subjects having high PWV in adulthood had higher BP values
childhood regardless the BP definition. In adulthood, differences between these groups were markedly greater (eg, the prevalence of elevated BP was more than twofold in the high-PWV group). Overall, all these observations suggest that early exposure to elevated BP plays an important role in the development of arterial stiffness and CVD.
Previous studies have reported clear tracking of BP, and especially elevated BP, from childhood to adulthood.7–9 Additionally, systolic BP in childhood predicts hypertension,9,30,31 arterial stiffness,17–19,32 and coronary artery calcium4in adulthood. Ourfindings are in agreement with these reports showing that subjects having elevated BP in childhood are at higher risk of having increased PWV in adulthood. The risk is increased if elevated BP in childhood is defined according to ei-ther the NHBPEP table or 1 of the 2 simplified tables. To the best of our knowledge, this is the first study to demonstrate that all these definitions are able to differentiate youth at in-creased risk of high PWV in adulthood.
The stiffening process of large arteries is complex.33,34It is suggested that el-evated blood BP causes mechanical load that leads to overproduction of collagen and degradation and remod-eling of normal elastin.33,34 As men-tioned earlier, elevated BP tracks from childhood to adulthood7–9thus having long-term influence on the stiffening process. To slow down this process, it is necessary to identify subjects whose TABLE 3 RR and 95% CI of High PWV in Adulthood According to the 3 Definitions for Elevated
Pediatric BP
Simple 1 Definition (Age) Simple 2 Definition (Age and Gender)
Complex Definition (Age, Gender, and Height Percentile)
RR 1.5 1.6 1.7
(95% CI) 1.1–2.0 1.2–2.2 1.2–2.2
Pvalue .007 .001 .001
High PWV was defined as values at or above the age-, gender, and heart-rate-specific 80th percentile. All estimates adjusted for age and gender. CI, confidence interval; RR, relative risk.
TABLE 4 Sensitivity, Specificity, PPV, NPV, AUC With 95% CIs, and NRI Values of the 3 Definitions for Elevated Pediatric BP to Predict High PWV in Adulthood
Definition Sensitivity, % Specificity, % PPV, % NPV, % AUC 95% CI Pvalue NRI, % Pvalue Simple 1 definition (age) 61.5 48.0 22.7 83.4 0.548 0.508–0.587 0.25a 22.8 0.13a Simple 2 definition (age and gender) 66.8 44.5 23.0 84.4 0.556 0.517–0.596 0.68b 21.0 0.35b Complex definition (age, gender, and height percentile) 53.0 59.3 24.4 83.5 0.561 0.521–0.602
High PWV was defined as values at or above the age-, gender- and heart rate-specific 80th percentile. CI, confidence interval.
high BP needs adequate intervention and treatment. It is especially im-portant to make early diagnosis of hypertension in childhood because hypertension is a major modifiable risk factor. However, hypertension and prehypertension in children and ado-lescents are mostly undiagnosed.11,12 This is a major clinical problem, and every effort should be made to help physicians in the screening process. Before it is possible to make correct diagnosis of hypertension, it is first necessary to identify elevated BP mea-surements. Because of that, Kaelber and Pickett13and Mitchell et al12proposed the new BP tables to aid in decision-making between normal and abnormal pediatric BP. Mitchell et al reported sixfold improvement, from 15% to 77%, in recognition of hypertensive pres-sures when using their simplified table than NHBPEP table.12This user-friendly screening tool could lead to wider screenings and diagnosis of prehyper-tension and hyperprehyper-tension in children and adolescents such that effective lifestyle interventions and medication could be optimized for health outcomes.
Because the clinical screening of ele-vated BP is more efficient with the simplified tables, it is important to know how well the simplified tables identified subjects at increased CVD risk. In this study, we found that the simplified definitions made almost identical pre-dictions for high PWV as the complex
definition. In addition, AUC and NRI analyses showed no difference between the simplified and complex definitions. The complex definition had lower sen-sitivity (53.0%) for high PWV than simple 1 and simple 2 (61.5%–66.8%, re-spectively) definitions, and all defi -nitions had satisfactory (83.4%–84.4%) NPV. Thesefindings further support the usability of both simplified tables to identify children and adolescents needing additional evaluation of BP. It is also worth mentioning that relative risks of high PWV for overweight sub-jects were equal (1.8–2.1) according to all 3 definitions. These predictions were not statistically significant, but this may be due to small group size.
The strength of this study is the large randomly selected cohort of young adults followed for 27 years since childhood. However, our study has some limitations that need to be considered in the interpretation of our findings. First, the CircMon-based PWV mea-surement method is not yet widely used in epidemiologic settings, apparently limiting comparability of our findings with observations from other cohorts. However, PWV values measured by CircMon are highly comparable to those measured by Doppler ultrasound method.23 Also reference values for PWV measured with CircMon method24 are similar to those observed in other studies in which varying meth-ods of measurement have been used,
indicating the generalizability of our findings. Second, bias due to non-participation in the follow-up study needs to be considered. Baseline characteristics in 1980 were mainly similar among participants and non-participants, with the exception of age. This statistically significant difference can be explained by the large number of participants because the absolute difference was small and not clinically meaningful. Therefore, the current study cohort appears to be fairly representative of the original study population. Third, as shown in Supple-mental Tables 7 and 8, these results should be interpreted with caution for children aged ,9 years and over-weight subjects. Finally, the ethnic ho-mogeneity of our study cohort limits the generalizability of our results to white European subjects.
CONCLUSIONS
Our results suggest that elevated BP in childhood predicts high PWV in adult-hood. Additionally, it is possible to use the simplified BP tables to identify children and adolescents at increased risk of high adult PWV because the predictions using these tables are equivalent to the more complex NHBPEP table. This could aid the screening of elevated pediatric BP and hence im-prove the primary prevention of CVD and hypertension-related diseases.
REFERENCES
1. Berenson GS, Srinivasan SR, Bao W, Newman WP III, Tracy RE, Wattigney WA. Association between multiple cardiovascular risk fac-tors and atherosclerosis in children and young adults. The Bogalusa Heart Study.N Engl J Med. 1998;338(23):1650–1656
2. McGill HC Jr, McMahan CA, Zieske AW, Malcom GT, Tracy RE, Strong JP. Effects of nonlipid risk factors on atherosclerosis in
youth with a favorable lipoprotein profile. Circulation. 2001;103(11):1546–1550
3. Raitakari OT, Juonala M, Kähönen M, et al. Cardiovascular risk factors in childhood and carotid artery intima-media thickness in adulthood: the Cardiovascular Risk in Young Finns Study.JAMA. 2003;290(17):2277–2283
4. Hartiala O, Magnussen CG, Kajander S, et al. Adolescence risk factors are pre-dictive of coronary artery calcification at middle age: the cardiovascular risk in
young Finns study.J Am Coll Cardiol. 2012; 60(15):1364–1370
5. Wang Y, Beydoun MA. The obesity epidemic in the United States—gender, age, socio-economic, racial/ethnic, and geographic characteristics: a systematic review and meta-regression analysis. Epidemiol Rev. 2007;29(1):6–28
6. McCrindle BW. Assessment and manage-ment of hypertension in children and ado-lescents.Nat Rev Cardiol. 2010;7(3):155–163
7. Bao W, Threefoot SA, Srinivasan SR, Berenson GS. Essential hypertension
Bogalusa Heart Study. Am J Hypertens. 1995;8(7):657–665
8. Chen X, Wang Y. Tracking of blood pressure from childhood to adulthood: a systematic review and meta-regression analysis. Cir-culation. 2008;117(25):3171–3180
9. Juhola J, Magnussen CG, Viikari JS, et al. Tracking of serum lipid levels, blood pres-sure, and body mass index from childhood to adulthood: the Cardiovascular Risk in Young Finns Study. J Pediatr. 2011;159(4): 584–590
10. National High Blood Pressure Education Program Working Group on High Blood Pressure in Children and Adolescents. The fourth report on the diagnosis, evaluation, and treatment of high blood pressure in children and adolescents.Pediatrics. 2004; 114(suppl. 2, 4th report):555–576
11. Hansen ML, Gunn PW, Kaelber DC. Under-diagnosis of hypertension in children and adolescents.JAMA. 2007;298(8):874–879
12. Mitchell CK, Theriot JA, Sayat JG, Muchant DG, Franco SM. A simplified table improves the recognition of paediatric hypertension. J Paediatr Child Health. 2011;47(1-2):22–26
13. Kaelber DC, Pickett F. Simple table to identify children and adolescents needing further evaluation of blood pressure. Pe-diatrics. 2009;123(6):e972–e974
14. Cohn JN, Quyyumi AA, Hollenberg NK, Jamerson KA. Surrogate markers for car-diovascular disease: functional markers. Circulation. 2004;109(25 suppl 1):IV31–IV46
15. Vlachopoulos C, Aznaouridis K, Stefanadis C. Prediction of cardiovascular events and all-cause mortality with arterial stiffness: a systematic review and meta-analysis. J Am Coll Cardiol. 2010;55(13):1318–1327
16. Mancia G, De Backer G, Dominiczak A, et al; The task force for the management of ar-terial hypertension of the European Society of Hypertension; The task force for the management of arterial hypertension of the European Society of Cardiology. 2007 guidelines for the management of arterial hypertension: The task force for the man-agement of arterial hypertension of the
(ESC).Eur Heart J. 2007;28(12):1462–1536
17. Aatola H, Hutri-Kähönen N, Juonala M, et al. Lifetime risk factors and arterial pulse wave velocity in adulthood: the cardiovas-cular risk in young Finns study. Hyperten-sion. 2010;55(3):806–811
18. Aatola H, Koivistoinen T, Hutri-Kähönen N, et al. Lifetime fruit and vegetable con-sumption and arterial pulse wave velocity in adulthood: the Cardiovascular Risk in Young Finns Study. Circulation. 2010;122 (24):2521–2528
19. Li S, Chen W, Srinivasan SR, Berenson GS. Childhood blood pressure as a predictor of arterial stiffness in young adults: the Bogalusa Heart Study.Hypertension. 2004; 43(3):541–546
20. Raitakari OT, Juonala M, Rönnemaa T, et al. Cohort profile: the cardiovascular risk in Young Finns Study.Int J Epidemiol. 2008;37 (6):1220–1226
21. Uhari M, Nuutinen M, Turtinen J, Pokka T. Pulse sounds and measurement of di-astolic blood pressure in children.Lancet. 1991;338(8760):159–161
22. Tahvanainen A, Koskela J, Tikkakoski A, et al. Analysis of cardiovascular responses to passive head-up tilt using continuous pulse wave analysis and impedance cardi-ography.Scand J Clin Lab Invest. 2009;69 (1):128–137
23. Kööbi T, Kähönen M, Iivainen T, Turjanmaa V. Simultaneous non-invasive assessment of arterial stiffness and haemodynamics— a validation study. Clin Physiol Funct Im-aging. 2003;23(1):31–36
24. Koivistoinen T, Kööbi T, Jula A, et al. Pulse wave velocity reference values in healthy adults aged 26–75 years.Clin Physiol Funct Imaging. 2007;27(3):191–196
25. Hlatky MA, Greenland P, Arnett DK, et al; American Heart Association Expert Panel on Subclinical Atherosclerotic Diseases and Emerging Risk Factors and the Stroke Council. Criteria for evaluation of novel markers of cardiovascular risk: a scientific statement from the American Heart Asso-ciation [published correction appears in
26. DeLong ER, DeLong DM, Clarke-Pearson DL. Comparing the areas under two or more correlated receiver operating characteris-tic curves: a nonparametric approach. Biometrics. 1988;44(3):837–845
27. Pencina MJ, D’Agostino RBS Sr, D’Agostino RB Jr, Vasan RS. Evaluating the added predictive ability of a new marker: from area under the ROC curve to reclassifi ca-tion and beyond.Stat Med. 2008;27(2):157– 172, discussion 207–212
28. Cook NR, Ridker PM. Advances in measur-ing the effect of individual predictors of cardiovascular risk: the role of reclassifi -cation measures.Ann Intern Med. 2009;150 (11):795–802
29. Juonala M, Magnussen CG, Venn A, et al. Influence of age on associations between childhood risk factors and carotid intima-media thickness in adulthood: the Cardio-vascular Risk in Young Finns Study, the Childhood Determinants of Adult Health Study, the Bogalusa Heart Study, and the Muscatine Study for the International Child-hood Cardiovascular Cohort (i3C) Consor-tium.Circulation. 2010;122(24):2514–2520
30. Sun SS, Grave GD, Siervogel RM, Pickoff AA, Arslanian SS, Daniels SR. Systolic blood pressure in childhood predicts hyperten-sion and metabolic syndrome later in life. Pediatrics. 2007;119(2):237–246
31. Juhola J, Oikonen M, Magnussen CG, et al. Childhood physical, environmental, and genetic predictors of adult hypertension: the cardiovascular risk in young Finns study.Circulation. 2012;126(4):402–409
32. Juonala M, Järvisalo MJ, Mäki-Torkko N, Kähönen M, Viikari JS, Raitakari OT. Risk factors identified in childhood and de-creased carotid artery elasticity in adult-hood: the Cardiovascular Risk in Young Finns Study.Circulation. 2005;112(10):1486–1493
33. Zieman SJ, Melenovsky V, Kass DA. Mecha-nisms, pathophysiology, and therapy of ar-terial stiffness. Arterioscler Thromb Vasc Biol. 2005;25(5):932–943
34. Greenwald SE. Ageing of the conduit arteries.J Pathol. 2007;211(2):157–172
(Continued fromfirst page)
FINANCIAL DISCLOSURE:The authors have indicated they have nofinancial relationships relevant to this article to disclose.
DOI: 10.1542/peds.2012-3426 originally published online June 10, 2013;
2013;132;e70
Pediatrics
Kähönen
Markus Juonala, Jorma S.A. Viikari, Terho Lehtimäki, Olli T. Raitakari and Mika
Heikki Aatola, Costan G. Magnussen, Teemu Koivistoinen, Nina Hutri-Kähönen,
Arterial Stiffness
Simplified Definitions of Elevated Pediatric Blood Pressure and High Adult
Services
Updated Information &
http://pediatrics.aappublications.org/content/132/1/e70
including high resolution figures, can be found at:
References
http://pediatrics.aappublications.org/content/132/1/e70#BIBL
This article cites 33 articles, 11 of which you can access for free at:
Subspecialty Collections
ers_sub
http://www.aappublications.org/cgi/collection/cardiovascular_disord
Cardiovascular Disorders
http://www.aappublications.org/cgi/collection/cardiology_sub
Cardiology
following collection(s):
This article, along with others on similar topics, appears in the
Permissions & Licensing
http://www.aappublications.org/site/misc/Permissions.xhtml
in its entirety can be found online at:
Information about reproducing this article in parts (figures, tables) or
Reprints
http://www.aappublications.org/site/misc/reprints.xhtml
DOI: 10.1542/peds.2012-3426 originally published online June 10, 2013;
2013;132;e70
Pediatrics
Kähönen
Markus Juonala, Jorma S.A. Viikari, Terho Lehtimäki, Olli T. Raitakari and Mika
Heikki Aatola, Costan G. Magnussen, Teemu Koivistoinen, Nina Hutri-Kähönen,
http://pediatrics.aappublications.org/content/132/1/e70
located on the World Wide Web at:
The online version of this article, along with updated information and services, is
http://pediatrics.aappublications.org/content/suppl/2013/06/05/peds.2012-3426.DCSupplemental
Data Supplement at:
by the American Academy of Pediatrics. All rights reserved. Print ISSN: 1073-0397.