60 |
P a g e
EFFECT OF SOFT STOREYS ON THE SEISMIC
BEHAVIOUR MULTI-STOREY BUILDINGS-AN
EXPERIMENTAL STUDY
Bashir Asim
1, Yousuf Saqib
2, Reshi Owais
3,Bhat Javed
4, Sheikh J Iqbal
5, Farooq Sahil
61,2,3
Department of Civil Engineering, National Institute of Technology (India)
4
Professor, Department of Civil Engineering, National Institute of Technology (India)
5
Assistant Professor, Department of Electrical Engineering, National Institute of Technology (India)
6Department of Electrical Engineering, National Institute of Technology (India)
ABSTRACT
The North Kashmir Earthquake on October 8, 2005 was a landmark moment in the history of study of engineering
aspects of earthquakes in the Indian subcontinent. Ever since, there has been an increased awareness for the need
to evaluate and improve the seismic performance of multi-storeyed reinforced concrete buildings particularly in
seismically active regions of the subcontinent. There are several factors affecting the behaviour of a building
during an earthquake. The leitmotif of this study is to experimentally discern the occurrence and effects of one of
the associated structural phenomena of earthquakes. Stiffness Irregularity in vertical direction is a structural
anomaly, as a consequence of which Soft Storeys are formed. In this paper, an experimental study is performed on
a typical multi-storeyed building with different soft storey conditions i.e. soft storey at different levels. It is
intended to describe the performance characteristics such as stiffness and its effect on the seismic behaviour of
structures. The study is carried out on small scale representative models constructed using Model Similitude laws.
The testing of models is carried on the shake table wherein a previous earthquake motion (El Centro, 1940) is
simulated and the associated hardware is used to record the response of the structures vis-à-vis the presence of
soft storey. The performance of all the building models under the occurrence of the said stimulated earthquake
motion is evaluated and a comparative study of the models is carried out.
Keywords -
-
Earthquake Testing, MDF Modelling, Model Similitude, Shake Table, Soft Storey
I. INTRODUCTION
Soft storeys are one of the typical causes of failure of structures during earthquakes. A soft storey is a structural
anomaly attributed to the discontinuity of stiffness along the height of a structure. Severe structural damages
suffered by several modern buildings during recent earthquakes illustrate the importance of avoiding sudden
changes in vertical stiffness and strength. Classically being associated with retail spaces and parking garages ,
they are often seen in lower stories of the building , which means when they collapse , they can cause serious
structural damage or even lead to the collapse of the whole building.[1]
Recent earthquakes like Bhuj earthquake (2001), North Kashmir earthquake (2005), Indonesiaearthquake (2004),
Haiti earthquake (2010) and Japan earthquake (2011) have shown that a large number of existing reinforced
concrete buildings are vulnerable to damage or even collapse during a strong earthquake owing to the
61 |
P a g e
To protect structures from significant damage, the study of response reduction of structures under such severeearthquakes has gained significance in structural engineering. Study of the response of structure is very important.
So an effort has been made to study the behaviour of a multi-storey regular building and stiffness irregular
building frame models subjected to earthquake loading. This experiment enables the understanding how the
behaviour of a multi-storey building changes with the introduction of soft storeys and different soft storey
conditions. The experiment gives a clear picture of how the introduction of soft storeys make a multi-storey
building more vulnerable to damage during an earthquake. The frame of model is rectangular in plan as well as in
elevation. The building models without stiffness irregularity and with stiffness irregularity at different levels have
been used for testing. Regular model consists of symmetrical plan as well as elevation and irregular model
consists of stiffness irregularity.
II.TESTING METHODOLOGY
The testing chronology adapted is:
1. Selecting a prototype structure.
2. Developing an experimental model.
3. Model Scaling, Evaluating Model Dimensions and Model Similitude (as per facility constraints and
equipment capacities).
4. Executing the Testing Program for inducing Loading.
5. Post Processing and Response Evaluation.
6. Reporting.
III. PROCEDURE
i. Small Scale models of a typical high rise building are prepared using MDF (Medium density Fibre) as the
model material.
ii. The displacement-time history of the El Centro Earthquake of 1940 is fed into the MATLAB software. The
complete programming for the simulation of the earthquake is carried out in MATLAB itself.
iii. Once done with programming, the table is set for testing. After testing the working of the shake table by
visual comparison of the input and the actual vibration generated, models are mounted and fixed to the shake
table for testing.
iv. The models with different soft storey conditions are tested on the shake table one at a time and the response is
recorded by accelerometers fixed at each storey level of the model. Accelerometers give a real-time
acceleration plot in time domain. The acceleration responses are then processed in MATLAB to give the
displacement response in time domain.
v.
From the obtained plots the absolute maximum values are obtained which are then compared for differentmodels using various plots and tables to arrive at comparative conclusions about the effect of soft storeys on
62 |
P a g e
3.1 MODELLING OF A FRAMED RCC STRUCTURE
The model is a small scale representation of a six storey RCC framed structure at a soft soil site in Seismic Zone V
of the Seismic Zoning Map of India (IS 1893:2002 Part I) with floor dimensions 4m X 8m with floor height 3.5m,
and column size 300mm X 300mm.The modelling has been done using Froude’s Similitude law, which is a vital
physical tool for studying the behaviour of actual large scale structures through their small scale models.[2]
Froude’s Similitude is based on Froude number, CF = v / (L.g)1/2, with other significant parameters being the
Length Scale Factor (λ), Young’s Modulus Ratio (E)of RCC and MDF, Specific Mass Ratio (ρ)of concrete and
MDFwhere MDF is Medium Density Fibreboard (E=1000MPa and Specific Weight= 7.75 kN/m3).
Bracings are provided to the storeys thereby making them stiffer as compared to those which don’t have bracings.
The storeys without bracings are soft storeys.MDFsection (8mm X 8mm X 900mm) members have been glued
using Hot Melt Adhesive (HMA),and fixed on a 25cm X 45cm base board (6mm thick), representing the ground.
The shake table model has been such designed assuming the strains in two consecutive architectural floors are
proportional as per similitude to the strains in one structural floor of the model. Consequently, a 6-storeyed RCC
structure has been modelled as a three storeyed MDF model (3 DOF System). Also scaling down the weights
yields that weight to be placed on each storey of model is 2 Kg.After affirming the values of material constants of
both concrete, and MDF, calculations are made to find out the equivalent stiffness required to correctly model the
RCC framed structure. Based on the stiffness required in the MDF, a corresponding model column size is adopted
and tested experimentally.
Figure1.
Models with soft storey at different levels
The models prepared are then fixed on to the shake table platform and subjected to earthquake vibrations using the
shake table assembly. The vibration induced is random and corresponds to the El Centro (1940) ground shaking,
scaled down by a factor of 2.The response of the structures to the shaking is obtained from the accelerometers
installed at different levels in the modelled structures. The acceleration response obtained is converted to the
corresponding displacement response by double integration of the acceleration response plot in MATLAB, using
predefined blocks for the above operations.
63 |
P a g e
storey drifts are computed for each model. The values thus obtained are compared and presented in the form ofplots and tables.
IV. RESULTS
The forcing function or the time history of the stimulated earthquake (El Centro earthquake) is shown in Fig. 2.
The plot shows the variation of the ground displacement with time of the simulated North- South component of El
Centro earthquake ground shaking.
The time history plots are recorded at every floor level by installing an accelerometer. The time history plot has
been obtained after the model was subjected to given reference earthquake.
Figure2.The simulated earthquake motion (El Centro, 1940)
The plots of the acceleration responses are recorded at each level of the three models with different soft storey
conditions. The displacement time histories are also obtained from the recorded acceleration time histories by
double integration of the acceleration response function in MATLAB.
4.1 RECORDED RESPONSE
4.11 MODEL1 (No Soft Storey)
64 |
P a g e
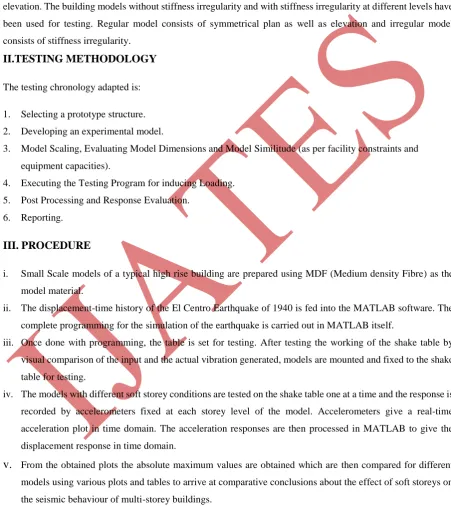
Figure 3.2.
Acceleration and displacement response recorded at 2
ndfloor of model 1
Figure 3.3.
Acceleration and displacement response recorded at 3
rdFloor of model 1
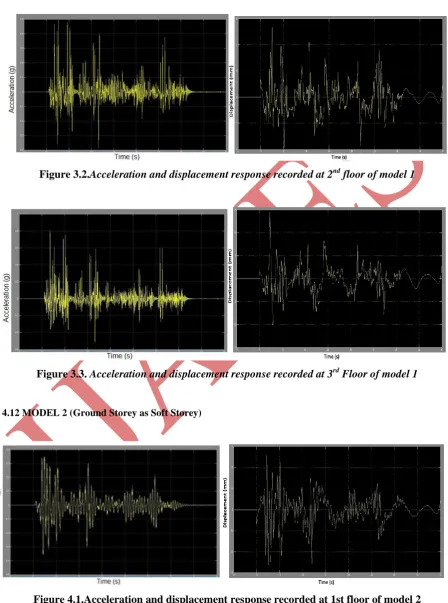
4.12 MODEL 2 (Ground Storey as Soft Storey)
65 |
P a g e
Figure 4.2.Acceleration and displacement response recorded at 2
ndfloor of Model 2
Figure 4.3.Acceleration and displacement response recorded at 3
rdFloor of Model 2
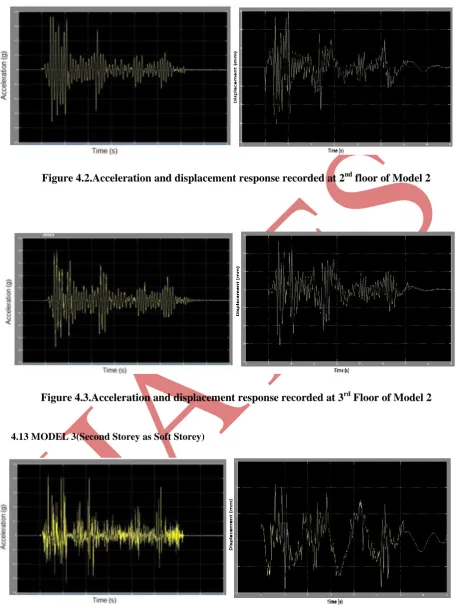
4.13 MODEL 3(Second Storey as Soft Storey)
66 |
P a g e
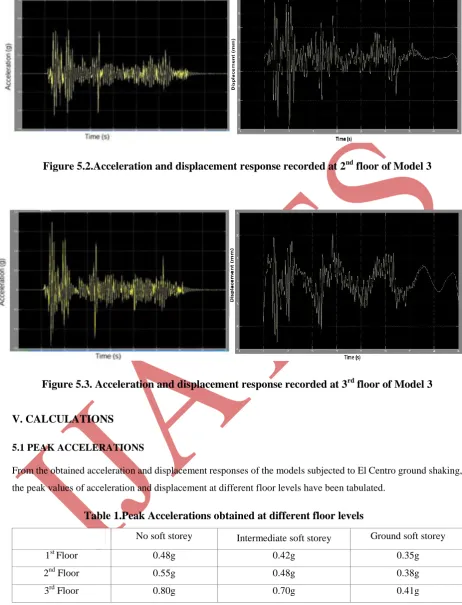
Figure 5.2.Acceleration and displacement response recorded at 2
ndfloor of Model 3
Figure 5.3. Acceleration and displacement response recorded at 3
rdfloor of Model 3
V. CALCULATIONS
5.1 PEAK ACCELERATIONS
From the obtained acceleration and displacement responses of the models subjected to El Centro ground shaking,
the peak values of acceleration and displacement at different floor levels have been tabulated.
Table 1.Peak Accelerations obtained at different floor levels
No soft storey Intermediate soft storey Ground soft storey
1st Floor 0.48g 0.42g 0.35g
2nd Floor 0.55g 0.48g 0.38g
3rd Floor 0.80g 0.70g 0.41g
The accelerations obtained experimentally at each floor can be multiplied by the lumped masses at the respective
floor heights to obtain the forces acting at each floor. Knowing the lateral force acting at each floor height, we can
67 |
P a g e
5.2 SHEAR FORCE CALCULATIONS
Table2.Shear Force Calculations at Different Floors of Model 1 (with no soft storey)
Floor Level Weight (Kg)
(Wi )
Force at each floor
( kN )
(Fi = mix a)
Shear Force
(kN)
3 2 0.80 x 9.8 x 2 = 15.68 15.68
2 2 0.55 x 9.8 x 2 = 10.78 26.46
1 2 0.48 x 9.8 x 2 = 9.41 35.87
Table 3.Shear Force Calculations for Model 2 (with ground storey soft)
Floor No. Weight(Kg)
(Wi)
Force at each floor
(kN)
( Fi = mi x a)
Shear Force
(kN)
3 2 0.41 x 9.8 x 2 = 8.036 8.04
2 2 0.38 x 9.8 x 2 = 7.45 15.49
1 2 0.35 x 9.8 x 2 = 6.86 22.35
Table 4.Shear Force Calculations for Model 3 (with intermediate soft storey)
Floor No. Weight (Kg)
(Wi)
Force at each floor
(kN)
( Fi = mi x a)
Shear Force
(kN)
3 2 0.70 x 9.8 x 2 = 13.72 13.72
2 2 0.48 x 9.8 x 2 = 9.41 23.13
1 2 0.42 x 9.8 x 2 = 8.23 31.36
5.21 COMPARISON OF SHEAR AT DIFFERENT STOREYS
68 |
P a g e
5.3 PEAK DISPLACEMENTS
From the acceleration responses at various floor levels, the displacement response were obtained by double
integration of the acceleration response function using MATLAB software. The ground accelerations are
subtracted from the observed total floor accelerations prior to the derivation of displacement responses. Thus the
pseudo-displacement response, not the total displacement response is obtained. From these plots the absolute
maximum value of pseudo-displacements i.e., storey drifts are noted and tabulated.
Table5. Peak Relative Storey Drifts obtained from the displacement response
Floor Level Model 1
(No soft storey)
Model 2
(Ground Storey Soft)
Model 3
(Intermediate Storey Soft)
3 14 mm 31 mm 28 mm
2 13 mm 30 mm 24 mm
1 12 mm 26 mm 11 mm
5.31 COMPARISON OF STOREY DRIFTS AT DIFFERENT FLOOR LEVELS
Figure 7.Comparison of Storey Drifts (Displacements) at different floor levels
VI. CONCLUSIONS
i.The buildings with soft storeys resist smaller forces as compared to the stiff structures. The base shear and the
shear forces at different floor levels are lesser for the buildings with soft storeys as compared to the stiff
buildings. On the basis of comparative study, the building with no soft storey is seen to have the maximum
69 |
P a g e
storey is found to be maximum.ii.This can be attributed to the fact that on introduction of soft storey in a building, its stiffness decreases and its
time-period increases. The higher time-period leads to smaller accelerations in the building and hence the
smaller lateral force. As a result of this, lesser values of storey shear are obtained in the buildings with soft
storeys.
iii.On comparing the displacement response of the models, it is observed that the storey drift in case of buildings
with soft storey is very large as compared to a stiff building. Large changes in relative storey drifts are
observed across the soft storey. These high relative drifts in the buildings lead to a large amount of undesirable
additional bending moments in columns which leads to the failure of the structure as a whole.
iv.
Small scale models made using medium density fibre-board are found to show good results. Thus MDF canbe regarded as a good material for modelling of realistic RCC structures for earthquake testing.
REFERENCES
Books:
[1] Anil K. Chopra (1995), Dynamics of Structures, Theory and Application to Earthquake Engineering,
Englewood Cliffs, New Jersey: Prentice-Hall, 1995.
[2] Harris and Sabnis, Structural Modeling and Experimental Techniques, CRC Press, 1999.
Internet:
MDF Design Technology (http://www.design-technology.org/mdf.htm)
Dynamic Designs International Earthquake Engineering Challenge, University of Bristol